- *Corresponding Author:
- Jie Han
Emergency Department,
Qingdao Municipal Hospital,
Qingdao,
Shandong Province 266073,
China
E-mail: 958987973@qq.com
| This article was originally published in a special issue, “Modern Applications in Biomedical Research and Pharmaceutical Sciences” |
| Indian J Pharm Sci 2022:84(3)Spl Issue “32-41” |
This is an open access article distributed under the terms of the Creative Commons Attribution-NonCommercial-ShareAlike 3.0 License, which allows others to remix, tweak, and build upon the work non-commercially, as long as the author is credited and the new creations are licensed under the identical terms
Abstract
Non-small cell lung cancer is the leading cause of cancer-associated mortality worldwide and lung adenocarcinoma is its most common type. The fringe protein family can modulate the Notch receptors to regulate pathways and affect a variety of physiological processes, such as embryo development and tumor formation. To investigate the influence of manic fringe expression on the prognosis of lung adenocarcinoma patients and evaluate its correlation with immune suppression of tumor microenvironment is the objective of the study. Wilcoxon rank test and logistic regression were used to analyze the relationship between manic fringe expression and clinical characteristics of patients with lung adenocarcinoma. The influence of manic fringe expression on the prognosis of lung adenocarcinoma patients was analyzed using Kaplan- Meier plotter analysis and Cox regression, and a receiver operating characteristic curve and nomogram were constructed. Single sample gene set enrichment analysis was used to analyze the correlation between manic fringe expression and immune infiltration. The expression of manic fringe in lung adenocarcinoma was verified using the Oncomine and tumor immune estimation resource database. Manic fringe expression in lung adenocarcinoma patients was significantly lower than that in normal lung tissues. Kaplan-Meier plotter analysis revealed that the overall survival and disease-specific survival of lung adenocarcinoma patients with low manic fringe expression were shorter (p<0.05) than those of patients with high expression. Multivariate Cox analysis further confirmed that high manic fringe expression was an independent predictor of longer overall survival in patients with lung adenocarcinoma. Furthermore, the other clinicopathological features, such as tumour and lymph nodes classification and residual tumor R classification, were correlated with worse prognosis. Single sample gene set enrichment analysis showed that manic fringe expression was correlated with infiltration of interdigitating dendritic cells and tumor cells. Manic fringe may be used as an independent prognostic biomarker and is associated with immune infiltration in lung adenocarcinoma.
Keywords
Manic fringe, lung adenocarcinoma, differentially expressed genes, Kaplan-Meier plotter analysis, Cox regression
Lung cancer is one of the most commonly diagnosed cancer and its morbidity and mortality rank first among malignant tumors[1]. Concurrently, Lung Adenocarcinoma (LUAD) is the most common type of lung cancer, accounting for 30 %-40 % of the total incidence of lung cancer[2,3]. Statistics show that more than 50 % of lung cancer patients are already in the advanced stage of the disease when they are initially diagnosed and lose the opportunity for surgical treatment owing to distant metastasis, chemotherapy remains the mainstay of treatment, which is a major cause for the overall prognosis deviation in lung cancer patients[4]. Therefore, it is crucial to identify biomarkers for LUAD. These biomarkers may aid in the early diagnosis of the disease and help to identify the high-risk patients. Many biomarkers are involved in the occurrence and development of tumors and the identification of these disease-specific biomarkers may help to provide a novel therapeutic target for tumor treatment and elucidate the mechanism of LUAD[5].
Manic Fringe (MFNG) is a member of the glycosyltransferase 31 gene family. Members of this gene family, including LFNG O-Fucosylpeptide 3-beta- N-Acetylglucosaminyltransferase or Lunatic Fringe (LFNG) (GeneID: 3955) and RFNG O-Fucosylpeptide 3-beta-N-Acetylglucosaminyltransferase (RFNG) (GeneID: 5986), encode the evolutionarily conserved glycosyltransferases that act in the Notch signaling pathway to define boundaries during embryonic development[6]. Although their structure is distinct from the other glycosyltransferases, these proteins have a fucose-specific beta-1,3-Nacetylglucosaminyltransferase activity that leads to the elongation of O-linked fucose residues on Notch, leading to alterations in Notch signaling[7]. Changes in Notch pathway activity lead to the development of a variety of cancers such as leukemia, lung cancer and cervical cancer[8-10]. Although the role of Notch signaling in tumor initiation and progression has been emphasized, MFNG[11,12], which plays an important role in the Notch pathway, has particularly attracted our interest. Studies on MFNG are scarce and the role and prognostic value of MFNG in LUAD remains unexplored.
We studied the expression of MFNG in LUAD and its prognostic value in LUAD patients, and further analyzed the influence of age, gender, and other factors, on disease prognosis, and single sample Gene Set Enrichment Analysis (ssGSEA) was used to verify the correlation between MFNG expression and immune compromised of tumor microenvironment in LUAD patients. Finally, MFNG messenger Ribonucleic Acid (mRNA) level was determined using the Oncomine and Tumor immune estimation resource (Timer) databases.
Materials and Methods
Patient data sets:
All raw data of LUAD, including transcriptome RNA Sequencing (RNA-Seq) data and the corresponding clinical information, were down-loaded from The Cancer Genome Atlas (TCGA) database[13] and does not warrant clinical ethical review. The RNASeq expression data of MFNG in LUAD were also downloaded from TCGA. Therefore, 535 LUADs and 59 adjacent normal tissue samples were retained. The selected samples contained MFNG gene expression data and related clinical information, including age, sex, smoking status, Tumor (T) stage, Lymph Nodes (N) stage, metastases (M) stage, and tumor location. The mRNA expression data are presented as mean±Standard Deviation (SD).
Immune cells infiltration analysis using ssGSEA:
Immune infiltration analysis of LUAD was performed using ssGSEA in the Gene Set Variation Analysis (GSVA) R package[14,15] and the infiltration levels of all immune cell types were quantified from the gene expression profiles. Spearman’s correlation analysis was used to analyze the relationship between interdigitating Dendritic Cells (iDCs) and T cells with the highest correlation and MFNG expression, and the Wilcoxon rank sum test was used to analyze the correlation between iDCs and T cell infiltration and MFNG expression.
Oncomine and Timer databases:
The Oncomine[16] and Timer[17] databases were used to analyze the expression level of MFNG in tumor tissues and normal tissues and to demonstrate the MFNG expression levels in different types of tumors.
Statistical analyses:
All statistical analyses were performed with R (V 3.6.3) 9 and the R package grammar of graphics plot 2 (ggplot2) was used to visualize the differences in expression[18]. Paired t-test and Mann-Whitney U-test were used to determine the differences between LUAD tissues and the adjacent normal tissues. Kaplan-Meier and log-rank tests were performed using the Survminer package 10 to assess the effect of MFNG expression on patient survival, including Overall Survival (OS), Disease Specific Survival (DSS) and Progression-Free Interval (PFI). A Receiver Operating Characteristic (ROC) curve was applied to assess the diagnostic value of MFNG expression, with the Area Under the ROC Curve (AUC) used as the diagnostic value. Univariate and multivariate Cox analyses of LUAD were performed to identify the potential prognostic factors. Subsequently, multivariate Cox analysis was used to verify the independent prognostic factors of MFNG expression and a nomogram was constructed to predict the 1, 3 and 5 y OS of patients with LUAD.
Results and Discussion
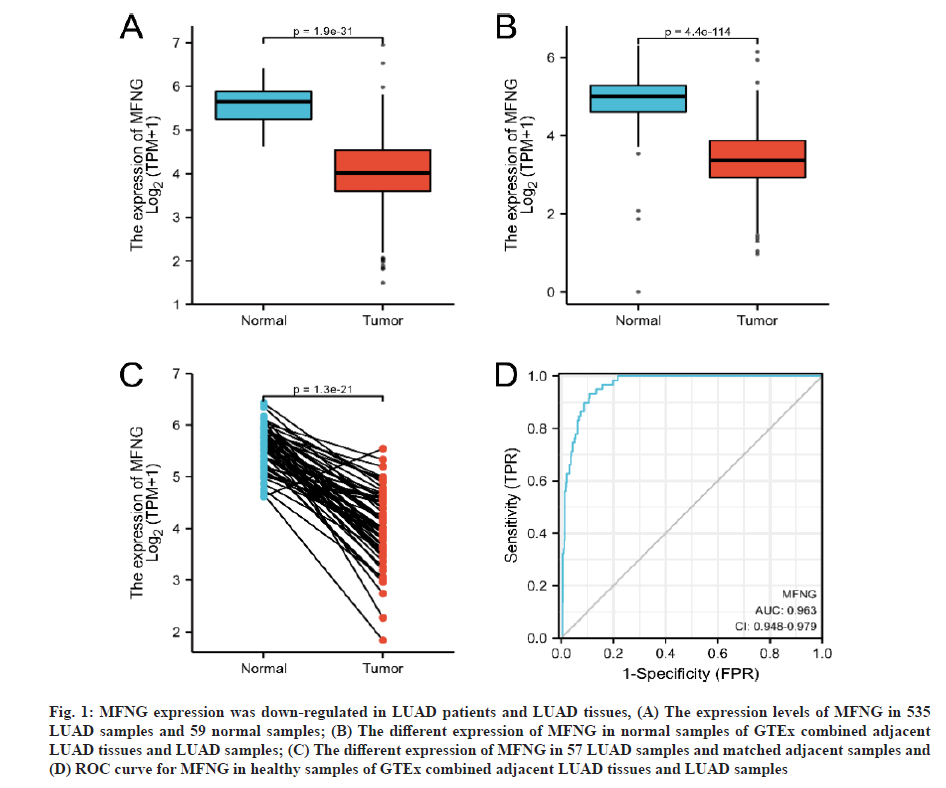
MFNG expression was down-regulated in LUAD patients and LUAD tissues. Comparison of MFNG expression in 535 LUAD tissues and 59 para-cancer tissues showed that MFNG expression levels in LUAD tissues were significantly lower than those in the para-cancer tissues (p=1.9E-31) (fig. 1A). For further verification, the differences in MFNG expression between the Genotype-Tissue Expression (GTEx) combined with adjacent LUAD tissues and the MFNG expression in LUAD tissues were analyzed. Decreased expression of MFNG was found in the LUAD tissues (p=4.4E−114) (fig. 1B). We paired 57 LUAD specimens with matched adjacent specimens and this analysis also revealed the low expression of MFNG in tumor tissues (p=1.3E−21) (fig. 1C), Finally, the ROC curve[19] was used to analyze the predictive potential of MFNG expression (AUC=0.963). The results showed that MFNG has a good prognostic predictive ability.
Fig. 1: MFNG expression was down-regulated in LUAD patients and LUAD tissues, (A) The expression levels of MFNG in 535 LUAD samples and 59 normal samples; (B) The different expression of MFNG in normal samples of GTEx combined adjacent LUAD tissues and LUAD samples; (C) The different expression of MFNG in 57 LUAD samples and matched adjacent samples and (D) ROC curve for MFNG in healthy samples of GTEx combined adjacent LUAD tissues and LUAD samples
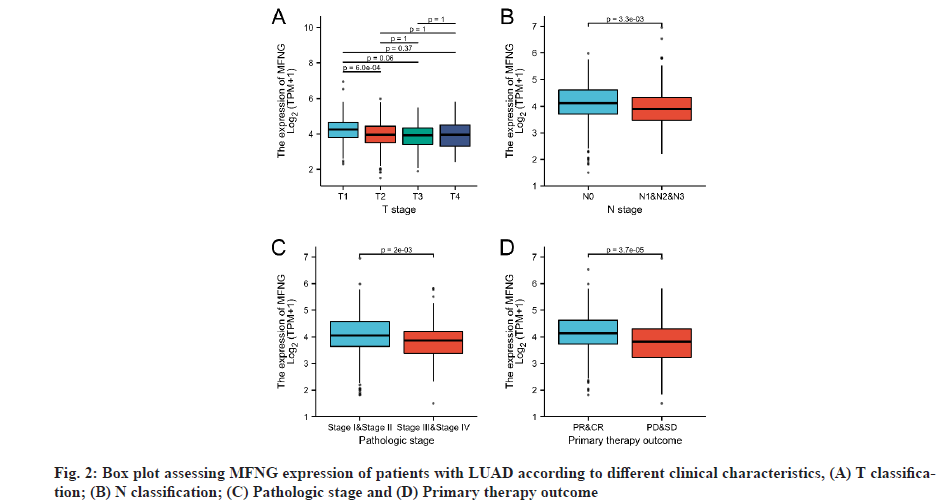
The clinical and gene expression characteristics of 594 LUAD patients were collected from the TCGA database. According to the average MFNG expression, the LUAD patients were divided into high expression group and the low expression group (Table 1). Further, the Wilcoxon sign rank and logistic regression analysis were used to analyze the correlation between MFNG expression level and clinical features. Wilcoxon rank sum test showed that MFNG expression was correlated with T classification (p=0.001), N classification (p=0.003), pathologic stage (p=0.012) and primary therapy outcome (p<0.001) (Table 1). Logistic regression analysis was used to analyze the inference efficiency of MFNG for clinical variables and to evaluate the relationship between MFNG expression and the clinical variables. Low MFNG expression was associated with poor prognosis in LUAD patients (fig. 2). MFNG expression level was significantly correlated with sex (male vs. female: Odd’s Ratio (OR)=0.691, 95 % Confidence Interval (CI)=0.487-0.979, p=0.038); N classification (N2, N3 and N1 vs. N0 (OR: 0.537, 95 % CI=0.368-0.780, p=0.001); pathologic stage (stage III and stage IV vs. stage I N classification (N2, N3 and N1 vs. N0 stage II: OR=0.523, 95 % CI=0.337-0.805, p=0.003) and primary outcome (Partial Response (PR) and Complete Response (CR) vs. Progressive Disease (PD) and Stable Disease (SD): OR=0.393, 95 % CI=0.247-0.619, p≤0.001) (Table 2).
| Characteristics | Low expression of MFNG | High expression of MFNG | p |
|---|---|---|---|
| n | 256 | 257 | |
| T stage, n (%) | 0.001 | ||
| T1 | 63 (12.4 %) | 105 (20.6 %) | |
| T2 | 155 (30.4 %) | 121 (23.7 %) | |
| T3 | 26 (5.1 %) | 21 (4.1 %) | |
| T4 | 11 (2.2 %) | 8 (1.6 %) | |
| N stage, n (%) | 0.003 | ||
| N0 | 150 (29.9 %) | 180 (35.9 %) | |
| N1 | 54 (10.8 %) | 41 (8.2 %) | |
| N2 | 49 (9.8 %) | 25 (5 %) | |
| N3 | 1 (0.2 %) | 1 (0.2 %) | |
| M stage, n (%) | 0.518 | ||
| M0 | 176 (47.7 %) | 168 (45.5 %) | |
| M1 | 15 (4.1 %) | 10 (2.7 %) | |
| Pathologic stage, n (%) | 0.012 | ||
| Stage I | 122 (24.2 %) | 152 (30.1 %) | |
| Stage II | 63 (12.5 %) | 58 (11.5 %) | |
| Stage III | 54 (10.7 %) | 30 (5.9 %) | |
| Stage IV | 15 (3 %) | 11 (2.2 %) | |
| Gender, n (%) | 0.047 | ||
| Female | 126 (24.6 %) | 150 (29.2 %) | |
| Male | 130 (25.3 %) | 107 (20.9 %) | |
| Primary therapy outcome, n (%) | < 0.001 | ||
| PD | 45 (10.6 %) | 23 (5.4 %) | |
| SD | 24 (5.6 %) | 13 (3.1 %) | |
| PR | 2 (0.5 %) | 4 (0.9 %) | |
| CR | 136 (31.9 %) | 179 (42 %) | |
| Age, n (%) | 0.175 | ||
| £65 | 128 (25.9 %) | 110 (22.3 %) | |
| >65 | 121 (24.5 %) | 135 (27.3 %) | |
| Smoker, n (%) | 0.974 | ||
| No | 36 (7.2 %) | 38 (7.6 %) | |
| Yes | 211 (42.3 %) | 214 (42.9 %) | |
| Age, median (Interquartile Range (IQR)) | 65 (58, 72) | 67 (59, 73) | 0.058 |
Table 1: The relationship between MFNG expression level and clinical features
| Characteristics | Total (n) | OR | p value |
|---|---|---|---|
| Age (>65 vs. ≤65) | 494 | 1.298 (0.912-1.851) | 0.148 |
| Gender (Male vs. Female) | 513 | 0.691 (0.487-0.979) | 0.038 |
| T stage (T3 and T4 vs. T1 and T2) | 510 | 0.756 (0.446-1.269) | 0.292 |
| N stage (N2 and N3 and N1 vs. N0) | 501 | 0.537 (0.368-0.780) | 0.001 |
| M stage (M1 vs. M0) | 369 | 0.698 (0.296-1.581) | 0.395 |
| Pathologic stage (Stage III and Stage IV vs. Stage I and Stage II) | 505 | 0.523 (0.337-0.805) | 0.003 |
| Residual tumor (R1 and R2 vs. R0) | 361 | 1.220 (0.456-3.322) | 0.689 |
| Primary therapy outcome (PD and SD vs. PR and CR) | 426 | 0.393 (0.247-0.619) | <0.001 |
| Smoker (Yes vs. No) | 499 | 0.961 (0.585-1.576) | 0.874 |
| Anatomic neoplasm subdivision 2 (Peripheral lung vs. central lung) | 189 | 1.201 (0.652-2.231) | 0.558 |
Table 2: The relationship between MFNG expression and clinicopathological characteristics
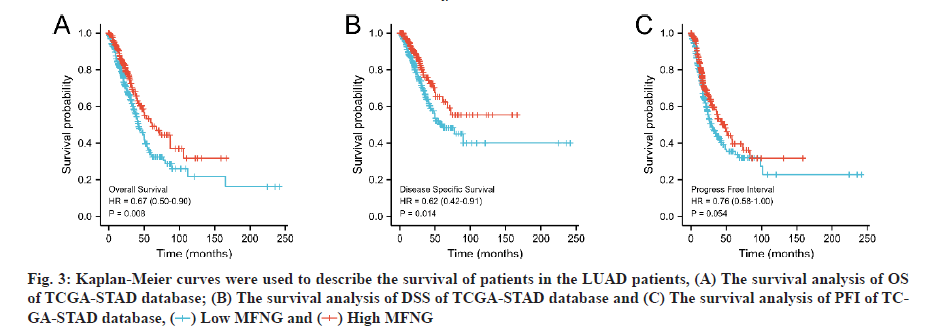
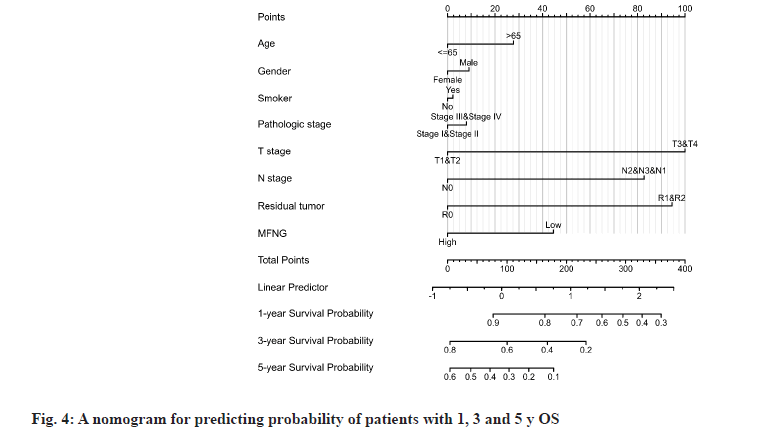
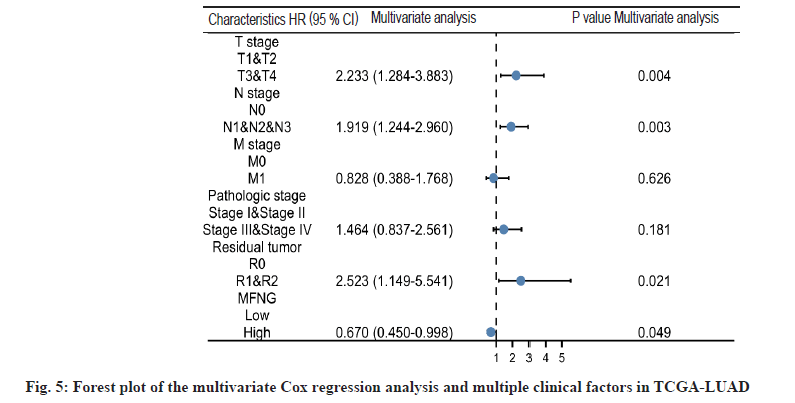
Diagnostic value and independent risk of MFNG expression in LUAD patients was described in detail. LUAD patients were divided into high and low expression groups according to the median MFNG expression level. OS, DSS and PFI were used as observation index of disease prognosis and the Kaplan-Meier curves were used to describe the survival of patients in the two groups. Under the three indexes, the survival probability of the MFNG high expression group was higher than that of the MFNG low expression group. When OS (fig. 3A, p=0.008) and DSS (fig. 3B, p=0.014) were taken as standards, the difference was statistically significant. Univariate Cox analysis showed that high MFNG expression was significantly associated with OS (Hazard Ratio (HR)=0.654, 95 % CI=0.485-0.881, p=0.005), T stage (HR=2.364, 95 % CI=1.621-3.448, p<0.001), N stage (HR=2.606 95 % CI=1.939-3.503, p<0.001), M stage (HR=2.111 95 % CI=1.232-3.616, p=0.007), pathologic stage (HR=2.624, 95 % CI=1.926-3.576, p<0.001), and residual tumor (HR=3.973 95 % CI=2.217-7.120, p<0.001) were also significantly associated with the OS. Additionally, multifactor regression analysis further confirmed that MFNG expression was an independent prognostic factor in LUAD patients (HR=0.670, 95 % CI=0.450-0.998, p=0.049) (Table 3 and fig. 4). The 1, 3 and 5 y OS of TCGA-Stomach Adenocarcinoma (STAD) was predicted according to age; T, M, N grade; pathological stage; tumor residual amount and MFNG expression level (fig. 5).
| Characteristics | Total (n) | Univariate analysis | Multivariate analysis | ||
|---|---|---|---|---|---|
| HR (95 % CI) | p value | HR (95 % CI) | p value | ||
| Age | 494 | ||||
| £65 | 238 | Reference | |||
| >65 | 256 | 1.228 (0.915-1.649) | 0.171 | ||
| Gender | 504 | ||||
| Female | 270 | Reference | |||
| Male | 234 | 1.060 (0.792-1.418) | 0.694 | ||
| T stage | 501 | ||||
| T1 and T2 | 437 | Reference | |||
| T3 and T4 | 64 | 2.364 (1.621-3.448) | <0.001 | 2.233 (1.284-3.883) | 0.004 |
| N stage | 492 | ||||
| N0 | 325 | Reference | |||
| N1 and N2 and N3 | 167 | 2.606 (1.939-3.503) | <0.001 | 1.919 (1.244-2.960) | 0.003 |
| M stage | 360 | ||||
| M0 | 335 | Reference | |||
| M1 | 25 | 2.111 (1.232-3.616) | 0.007 | 0.828 (0.388-1.768) | 0.626 |
| Pathologic stage | 496 | ||||
| Stage I and Stage II | 389 | Reference | |||
| Stage III and Stage IV | 107 | 2.624 (1.926-3.576) | <0.001 | 1.464 (0.837-2.561) | 0.181 |
| Residual tumor | 352 | ||||
| R0 | 336 | Reference | |||
| R1 and R2 | 16 | 3.973 (2.217-7.120) | <0.001 | 2.523 (1.149-5.541) | 0.021 |
| Anatomic neoplasm subdivision | 490 | ||||
| Left | 194 | Reference | |||
| Right | 296 | 1.024 (0.758-1.383) | 0.878 | ||
| Anatomic neoplasm subdivision 2 | 182 | ||||
| Central lung | 62 | Reference | |||
| Peripheral lung | 120 | 0.913 (0.570-1.463) | 0.706 | ||
| Smoker | 490 | ||||
| No | 71 | Reference | |||
| Yes | 419 | 0.887 (0.587-1.339) | 0.568 | ||
| Number of packs per years smoked | 345 | ||||
| <40 | 169 | Reference | |||
| ≥40 | 176 | 1.038 (0.723-1.490) | 0.84 | ||
| MFNG | 504 | ||||
| Low | 252 | Reference | |||
| High | 252 | 0.654 (0.485-0.881) | 0.005 | 0.670 (0.450-0.998) | 0.049 |
Table 3: Cox regresssion analysis and clinical pathological characteristics of LUAD patients
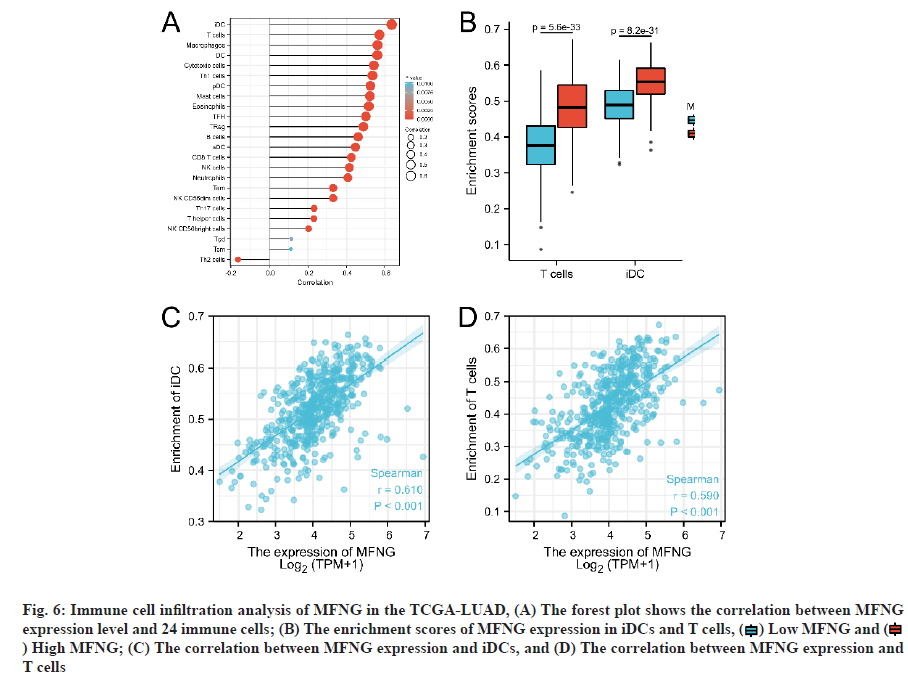
We studied the relationship between MFNG expression and immune cell invasion in LUAD using ssGSEA quantitative analysis and further explored the correlation between MFNG expression and TCGA-LUAD immune cell invasion using Spearman’s correlation analysis. The results showed that high MFNG expression was significantly positively correlated with infiltration levels of iDCs and T cells (p<0.001, fig. 6).
Fig. 6: Immune cell infiltration analysis of MFNG in the TCGA-LUAD, (A) The forest plot shows the correlation between MFNG expression level and 24 immune cells; (B) The enrichment scores of MFNG expression in iDCs and T cells,  Low MFNG and
  ) High MFNG; (C) The correlation between MFNG expression and iDCs, and (D) The correlation between MFNG expression and T cells
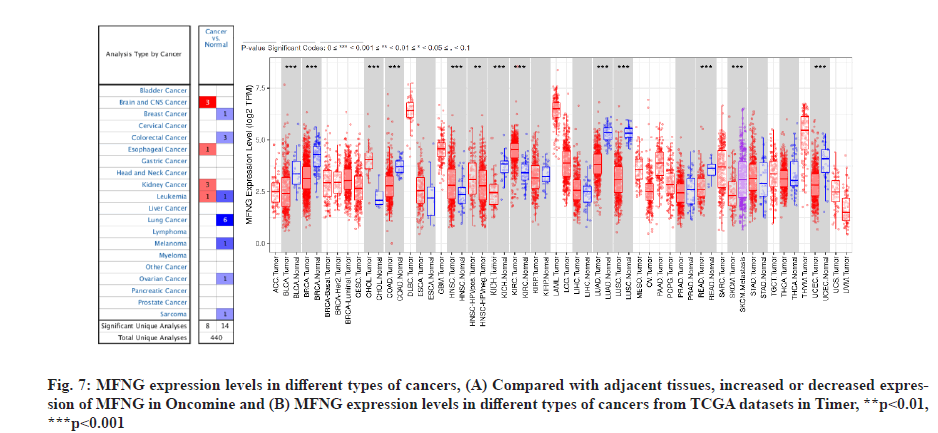
Finally, MFNG expression was verified in the Oncomine and Timer databases, and the expression of MFNG in LUAD was consistent with the above results. In addition to LUAD, downregulation of MFNG was also detected in bladder urothelial carcinoma, invasive breast carcinoma, basal cell carcinoma and uterine corpus endometrial carcinoma, while MFNG upregulation was noted in kidney clear cell carcinoma (fig. 7).
The Notch signaling pathway is a highly conserved pathway involved in the regulation of cell proliferation and differentiation and alterations in the Notch pathway are often closely related to the occurrence, development, invasion and metastasis of various tumors. It may promote or inhibit tumor development depending on the interaction between the tumor cells and the Tumor Microenvironment (TME)[20]. Mammalian Notch signaling relies on four receptors (Notch 1-4) and ligands of the Delta-like (Dll1, 3 and 4) or Jagged (Jag1 and 2) families. Receptor glycosylation regulates receptor-ligand interactions, with the fringe family of N-acetylglucosaminyltransferases, mainly LFNG and MFNG, potentiating delta-induced signals and reducing responsiveness to Jagged ligands[21-23]. MFNG is a member of the glycosyltransferase 31 gene family and encodes the evolutionarily conserved glycosyltransferases that act in the Notch signaling pathway, to define boundaries during embryonic development. Although their genomic structure is distinct from the other glycosyltransferases, these proteins have a fucose-specific beta-1,3-Nacetylglucosaminyltransferase activity that leads to the elongation of the O-linked fucose residues on Notch causing alterations in Notch signaling. The protein encoded by this gene may control Notch signaling in a wide variety of tumors[24].
LUAD, the most frequent lung cancer subtype[1,2,25], usually shows hematogenous metastasis in the early stages[26]. LUAD displays a poor prognosis and is difficult to detect in its early stages. MFNG, a crucial component of the Notch signaling pathway[27], may be used as a diagnostic indicator and possibly a therapeutic target for LUAD. At present, there are no studies on the relationship between MFNG expression and LUAD.
We first used the TCGA database to compare MFNG expression levels in LUAD tissues and paracancer tissues. These results were then combined with those obtained for normal samples in GTEx for further comparison and it was found that MFNG expression was significantly decreased in cancer tissues. The ROC curve also confirmed the diagnostic value of MFNG expression in LUAD. There was no predictive nomogram for LUAD combining the MFNG. Therefore, we constructed a prognostic nomogram, including age; T, M, N classification; pathological stage; primary therapy outcome; age; smoking status and MFNG expression, hoping to improve the accuracy of identification of at-risk patients. MFNG was also demonstrated to be an independent prognostic marker of LUAD in our study. Using ssGSEA, we found a relationship between MFNG expression levels and immune infiltration. In certain subsets of immune cells, such as immature dendritic cells and T cells, MFNG expression levels were positive correlated with them[28]. Since MFNG is down in LUAD organization, iDCs and T cells should also decrease in LUAD organization. The interaction between T cells and dendritic cells usually occurs in the lymph nodes of the tissue. Existing studies have found that the interaction between the two also occurs inside the tumor. This means that dendritic cells in the tumor microenvironment can affect the tumor-killing effect of T cells[29]. The function of dendritic cells in tumors usually changes, including the reduction of dendritic cell aggregation at the tumor site and the increase of cytokine production by tumor cells and surrounding cells, thereby producing immune compromised. Similarly, metabolic disorders in the tumor microenvironment can also inhibit the function of T cells. Glucose limitation, lipid metabolism and hypoxia in TME will significantly affect T cell responses and even affect the number of T cells[29,30]. The changes in the function and quantity of T cells and iDCs in tumor tissues may be closely related to the expression level of MFNG. We provide new ideas for the treatment of LUAD.
There are some limitations to our study. Cell function tests and animal validation are lacking. In addition, there may be some bias due to the confounding factors in data from the public database TCGA. To our knowledge, this is the first study to investigate the prognostic value of MFNG expression in LUAD and explore the relationship between MFNG expression and immune compromised. However, further studies are required to understand the role of MFNG in LUAD and the underlying mechanisms.
To conclude, our study shows that the downregulation of MFNG expression is associated with poor prognosis in LUAD and may be an independent prognostic indicator in LUAD patients. The decrease in function and number of T cells and iDCs in tumor tissue and immune suppression in LUAD may be closely related to MFNG expression level. These results may help us to detect LUAD early and provided a new idea for the treatment of LUAD.
Conflict of interests:
The authors declared no conflict of interest.
References
- Siegel RL, Miller KD, Jemal A. Cancer statistics, 2016. CA Cancer J Clin 2016;66(1):7-30.
[Crossref] [Google Scholar] [PubMed]
- Mori M, Rao SK, Popper HH, Cagle PT, Fraire AE. Atypical adenomatous hyperplasia of the lung: A probable forerunner in the development of adenocarcinoma of the lung. Mod Pathol 2001;14(2):72-84.
[Crossref] [Google Scholar] [PubMed]
- Hinds JR, Hitchcock GC. Adenocarcinoma of the lung. Thorax 1969;24(1): 10-7.
- Chang AJ, Bradley JD. Clinical perspectives on dose escalation for non-small-cell lung cancer. Clin Lung Cancer 2010;11(5):299-302.
[Crossref] [Google Scholar] [PubMed]
- Li C, Liu H, Niu Q, Gao J. Circ_0000376, a novel circRNA, promotes the progression of non-small cell lung cancer through regulating the miR-1182/NOVA2 network. Cancer Manag Res 2020;12:7635.
[Crossref] [Google Scholar] [PubMed]
- Egan S, Herbrick JA, Tsui LC, Cohen B, Flock G, Beatty B, et al. Mapping of the human lunatic fringe (LFNG) gene to 7p22 and manic fringe (MFNG) to 22q12. Genomics 1998;54(3):576-7.
[Crossref] [Google Scholar] [PubMed]
- Svensson P, Bergqvist I, Norlin S, Edlund H. MFng is dispensable for mouse pancreas development and function. Mol Cell Biol 2009;29(8):2129-38.
[Crossref] [Google Scholar] [PubMed]
- Nicot C. Tumor suppressor inactivation in the pathogenesis of adult T-cell leukemia. J Oncol 2015;2015.
[Crossref] [Google Scholar] [PubMed]
- Meder L, Büttner R, Odenthal M. Notch signaling triggers the tumor heterogeneity of small cell lung cancer. J Thorac Dis 2017;9(12):4884-8.
[Crossref] [Google Scholar] [PubMed]
- Bolha L, Ravnik-Glava? M, Glava? D. Long noncoding RNAs as biomarkers in cancer. Dis Markers 2017;2017.
[Crossref] [Google Scholar] [PubMed]
- Meisel CT, Porcheri C, Mitsiadis TA. Cancer stem cells, quo vadis? The Notch signaling pathway in tumor initiation and progression. Cells 2020;9(8):1879.
[Crossref] [Google Scholar] [PubMed]
- López-Arribillaga E, Rodilla V, Colomer C, Vert A, Shelton A, Cheng JH, et al. Manic Fringe deficiency imposes Jagged1 addiction to intestinal tumor cells. Nat Commun 2018;9(1):1-3.
[Crossref] [Google Scholar] [PubMed]
- Blum A, Wang P, Zenklusen JC. SnapShot: TCGA-analyzed tumors. Cell 2018;173(2):530.
[Crossref] [Google Scholar] [PubMed]
- Yu G, Wang LG, Han Y, He QY. clusterProfiler: An R package for comparing biological themes among gene clusters. OMICS 2012;16(5):284-7.
[Crossref] [Google Scholar] [PubMed]
- Bindea G, Mlecnik B, Tosolini M, Kirilovsky A, Waldner M, Obenauf AC, et al. Spatiotemporal dynamics of intratumoral immune cells reveal the immune landscape in human cancer. Immunity 2013;39(4):782-95.
[Crossref] [Google Scholar] [PubMed]
- Rhodes DR, Yu J, Shanker K, Deshpande N, Varambally R, Ghosh D, et al. ONCOMINE: A cancer microarray database and integrated data-mining platform. Neoplasia 2004;6(1):1-6.
[Crossref] [Google Scholar] [PubMed]
- Li T, Fu J, Zeng Z, Cohen D, Li J, Chen Q, et al. TIMER2.0 for analysis of tumor-infiltrating immune cells. Nucleic Acids Res 2020;48(W1):W509-14.
[Crossref] [Google Scholar] [PubMed]
- Maag JL. gganatogram: An R package for modular visualisation of anatograms and tissues based on ggplot2. F1000Res 2018;7:1576.
[Crossref] [Google Scholar] [PubMed]
- Hajian-Tilaki K. Receiver operating characteristic (ROC) curve analysis for medical diagnostic test evaluation. Caspian J Intern Med 2013;4(2):627-35.
[Google Scholar] [PubMed]
- Piao HY, Guo S, Wang Y, Zhang J. Long noncoding RNA NALT1-induced gastric cancer invasion and metastasis via NOTCH signaling pathway. World J Gastroenterol 2019;25(44):6508-26.
[Crossref] [Google Scholar] [PubMed]
- Stanley P, Okajima T. Roles of glycosylation in Notch signaling. Curr Top Dev Biol 2010;92:131-64.
[Crossref] [Google Scholar] [PubMed]
- Haltiwanger RS. Regulation of signal transduction pathways in development by glycosylation. Curr Opin Struct Biol 2002;12(5):593-8.
[Crossref] [Google Scholar] [PubMed]
- Tan JB, Xu K, Cretegny K, Visan I, Yuan JS, Egan SE, et al. Lunatic and manic fringe cooperatively enhance marginal zone B cell precursor competition for delta-like 1 in splenic endothelial niches. Immunity 2009;30(2):254-63.
[Crossref] [Google Scholar] [PubMed]
- Moran JL, Johnston SH, Rauskolb C, Bhalerao J, Bowcock AM, Vogt TF. Genomic structure, mapping, and expression analysis of the mammalian lunatic, manic and radical fringe genes. Mamm Genome 1999;10(6):535-41.
[Crossref] [Google Scholar] [PubMed]
- Olsen SN, Wronski A, Castaño Z, Dake B, Malone C, De Raedt T, et al. Loss of RasGAP tumor suppressors underlies the aggressive nature of luminal B breast cancers. Cancer Discov 2017;7(2):202-17.
[Crossref] [Google Scholar] [PubMed]
- Dost AF, Moye AL, Vedaie M, Tran LM, Fung E, Heinze D, et al. Organoids model transcriptional hallmarks of oncogenic KRAS activation in lung epithelial progenitor cells. Cell Stem Cell 2020;27(4):663-78.
[Crossref] [Google Scholar] [PubMed]
- Liu D, Lin L, Wang Y, Chen L, He Y, Luo Y, et al. PNO1, which is negatively regulated by miR-340-5p, promotes lung adenocarcinoma progression through Notch signaling pathway. Oncogenesis 2020;9(5):1-6.
[Crossref] [Google Scholar] [PubMed]
- Alamri A, Rahman R, Zhang M, Alamri A, Gounni AS, Kung SK. Semaphorin-3E produced by immature dendritic cells regulates activated natural killer cells migration. Front Immunol 2018;9:1005.
[Crossref] [Google Scholar] [PubMed]
- Leone RD, Powell JD. Metabolism of immune cells in cancer. Nat Rev Cancer 2020;20(9):516-31.
[Crossref] [Google Scholar] [PubMed]
- Cubillos-Ruiz JR, Silberman PC, Rutkowski MR, Chopra S, Perales-Puchalt A, Song M, et al. ER stress sensor XBP1 controls anti-tumor immunity by disrupting dendritic cell homeostasis. Cell 2015;161(7):1527-38.
[Crossref] [Google Scholar] [PubMed]
