- *Corresponding Author:
- Yan Wu
Department of Anesthesiology
Hubei Cancer Hospital, Tongji Medical College
Huazhong University of Science and Technology
Wuhan, 430079, Hubei Province, China
E-mail: wywuyandrys09@126.com
| This article was originally published in Special issue on “Trends in therapeutic Management of Various Conditions” |
| Indian J Pharm Sci 2020:82(3)spl issue 6;51-57 |
This is an open access article distributed under the terms of the Creative Commons Attribution-NonCommercial-ShareAlike 3.0 License, which allows others to remix, tweak, and build upon the work non-commercially, as long as the author is credited and the new creations are licensed under the identical terms
Abstract
In order to explore the mechanism of dexmedetomidine on brain damage in sepsis, mice were used to detect the staining of cells with hematoxylin-eosin and terminal-deoxynucleotidyl transferase mediated nick end labeling, the content of Evans blue in the brain, and the expression of TNF-α, IL-1β, malonaldehyde, reactive oxygen species, Bcl-2, Bax, cleaved caspase-3 were explored to understand possible mechanism of dexmedetomidine brain protection. The results showed that firstly, dexmedetomidine could attenuate the abnormal morphological changes of neurons in the brain and neuronal apoptosis, secondly, dexmedetomidine could attenuate the expression of TNF-α, IL-1β, MDA, ROS, Bcl-2, Bax, cleaved caspase-3 and iNOS. In summary, the cerebral protection mechanism of dexmedetomidine in septic mice might be connected with reducing the blood brain barrier destruction, reducing brain inflammation and oxidative stress levels, as well as inhibition of apoptosis by altering the expression of Bax, Bcl-2, and cleaved caspase-3. Despite some shortcomings in this investigation, these results still provide clear guidance for future research.
Keywords
Dexmedetomidine, sepsis, mice, protection mechanism
Sepsis is defined as a systemic inflammatory response syndrome[1], usually associated with a confirmed or highly suspected infection. Patients with infections may develop severe sepsis, organ dysfunction, organ hypoperfusion or hypotension[2,3] and even hypotension, which is difficult to improve with fluid resuscitation, develops to sepsis shock[4]. Severe sepsis can lead to multiple important organ dysfunctions, the most common of which is the respiratory system, followed by the cardiovascular, renal, and central nervous systems[5]. Sepsis and its associated complications are the most common causes of death in clinically critically ill patients with an annual death toll of around 200 000 in the United States. Sepsis-associated encephalopathy (SAE) refers to the asystematic brain dysfunction accompanied with sepsis with the evidence of a lack of direct central nervous system infection after clinical and laboratory examinations, no abnormalities in brain structure, and exclusion of other types of encephalopathy such as hepatic or renal encephalopathy[6]. In addition, studies have shown that patients with sepsis accompanied with encephalopathy have a significantly higher incidence of long-term cognitive dysfunction and are more susceptible to neurodegenerative diseases[7]. Many critical illnesses can have brain function disorders in the early stages of no diagnosis, but the clinical manifestations of early SAE are easily ignored by clinicians, and there are no definitive diagnostic criteria for SAE at present[8]. The diagnosis is mainly exclusionary diagnosis. Therefore, the treatment of SAE is often delayed[9]. It can be concluded that early detection of some subtle changes in the state of consciousness, careful elimination of the cause, early treatment, can not only help to improve the patient’s early prognosis, but also help improve the patient’s long-term outcome[10].
In summary, this study detected the staining of hematoxylin-eosin (HE) and terminal-deoxynucleotidyl transferase mediated nick end labeling (TUNEL) cells, the content of Evans blue in the brain, the expression level of TNF-α, IL-1β, MDA, ROS, Bcl-2, Bax, cleaved caspase-3 and iNOS in the brain of mice, indicating that the cerebral protection mechanism of dexmedetomidine in septic mice might be connected with reducing the blood brain barrier destruction, reducing brain inflammation and oxidation stress levels, as well as inhibition of apoptosis by altering the expression of Bax, Bcl-2, and cleaved caspase-3.
Materials and Methods
Animals:
A total of 81 SPF class BALB/c mice (male, 3 mo old, 20-23 g) were selected in this study. Mice were housed in polypropylene cages and placed in a relatively constant environment of ambient temperature of approximately 23 ± 0.5° and humidity of approximately 62 ± 5 % and were provided free access to food. The breeding house maintains a 12-h day and night alternate and the mice were housed for 1 to 3 d.
Grouping and preparation of animal models:
In this study these 81 SPF level BALB/c mice were randomly divided into 3 treatment groups, normal control group, model group (LPS group) and dexmedetomidine treatment group (LPS+ DEX group). LPS group and LPS+DEX group were given intraperitoneal injection of 10 mg/kg LPS (lipopolysaccharide) to induce sepsis, while the control group was given intraperitoneal injection of 10 ml/kg of normal saline (NS). LPS+DEX group was given intraperitoneal injection of DES (25 μg/kg) at 0, 2 and 4 h after injecting LPS, while the control and LPS group were given 10 ml/kg NS at these 3 time points.
Specimen collection:
After 8 h of model development, depending on the detection method and purpose, the mice were subjected to 4 different procedures. Firstly, 6 mice were chosen randomly from each group and 2% Evans blue solution (3 ml/kg) was injected through the tail vein. After 2 h, Evans blue content in the brain was detected using a procedure described in the next section. Three mice were randomly selected from each group and the heart of each mouse was exposed, a syringe needle was used to puncture the apex cordis, a blunt syringe needle was inserted and the needle end of the syringe to the infusion channel, a small slit was made in the right auricle, the infusion channel opened to lavage with NS. Eight hours after model establishment, 12 mice were randomly selected, anesthetized and were sacrificed by cervical dislocation. The skull was opened, brain was carefully removed and transferred into a cryogenic vial and quickly frozen in liquid nitrogen for detection of TNF-α, IL-1β, MDA and ROS using ELISA.
Detection of Evans blue content in brain tissue:
Evans blue 2 % solution was aspirated with a 1 ml syringe and was injected into the circulatory system of the mouse through the tail vein at a dose of 3 ml/ kg. After 2 h of Evans blue injection, 10 % chloral hydrate (0.1 ml/10 g) was intraperitoneally injected to anesthetize the mice, the thorax was dissected open to reveal the heart, the apex cordis was punctured with a needle, a slit was made in right auricle and through the puncture of the apex cordis NS was slowly instilled, staining of the fluid from the right auricle was observed and the perfusion was stopped when the color was faded. The skull was opened and the brain was carefully removed and weighed. The brain tissue was then placed in a homogenizer, formamide solution was added (1 ml of formamide per 100 mg of brain tissue) homogenized, the homogenate was transferred into an Eppendorf tube, placed in a water bath at 60° for 24 h protected from light. The homogenate was centrifuged at 5000 rpm for 10 min, the supernatant was aspirated and its optical density (OD) was measured at a wavelength of 632 nm on an ultraviolet spectrophotometer against an ultra-pure water blank. The Evans blue content (ng/mg) of each group of brain tissues was calculated from a standard curve.
HE staining:
The sections were exposed to the following solvents for the corresponding times listed; in xylene I for 10 min, xylene II for 10 min, 100 % ethanol I for 10 min, 100% ethanol II for 10 min, 95 % ethanol I for 5 min, 95 % ethanol II for 5 min, 85 % ethanol for 5 min, 75 % ethanol for 5 min, and distilled water for 5 min and then sections were covered with appropriate amounts of HE staining solution A (hematoxylin) for 10 min. Then the section was rinsed under running water for 5 min to remove the residual staining solution and then alcoholic hydrochloric acid solution was added for differentiation for 30 s. At this time, the slice turned red and then it was rinsed under running water for 30 min till it turned back to blue, the section was placed in ultrapure water for 5 min, in 95 % ethanol twice for 5 min each time and 100 % ethanol twice for 10 min each time. sections were soaked in xylene twice, 10 minutes for each time, then blotted dry covered with neutral gum and the finally covered with a cover slip. After the neutral gum was completely dried, it was observed under an optical microscope and photographed.
TUNEL staining:
First, the tissue was embedded in paraffin, sectioned, patched and dewaxed. Then, appropriate amount of proteinase K was added to cover the surface of the tissue, incubated for 15-30 min at room temperature, washed 3 times with PBS as the enzyme plate should be washed as thoroughly as possible. The tissue was covered with 3% H2O2 solution and incubated for 10 min at room temperature to inactivate endogenous peroxidase activity, washed 3 times with PBS. Each sample required 2 μl terminal deoxyribonucleic acid transferase (TDT) and 48 μl biotinylated d-UTP (BiotindUTP) to configure biotin labeling solution. Biotin labeling solution (50 μl) was added to each sample, incubated at 37° for 60 min in dark. Streptavidin-HRP is diluted 50 times to prepare a working solution which was added to the sample, incubated in a wet box for 30 min at room temperature, washed 3 times with PBS. DAB coloring solution A and B were mixed in a ratio of 1:1, added to the sample, placed it at room temperature for 5-30 min and washed with PBS for 3 times. Next, hematoxylin staining solution was applied to the surface of the tissue for nuclear staining, washed 3 times with PBS, gradient ethanol dehydration was carried out, cleared with xylene, sealed with neutral resin and observed under the microscope. Positive cells were shown in brown in the nucleus and 5 high power fields (×400) were counted in 3 mouse cortex and hippocampus, respectively.
Enzyme linked immunosorbent sorbent assay (ELISA):
The frozen brain tissue was weighed, PBS was added in a ratio of 1 mg of tissue to 10 ml of PBS, the tissue was sonicated on ice, and then according to the instructions of the BCA protein concentration assay kit the protein concentration of the centrifuged supernatant of each sample in each group was determined. Appropriate amounts of concentrated washing solution was taken, diluted with 29 volumes of distilled water before use. After incubation, the above enzyme plate was taken out of the incubator, microplate sealers from the surface were carefully removed, wells were filled with washing solution, allowed to stand for 30 s and then the washing solution was removed, plate was inverted on a filter paper and tapped several times to remove the liquid in the plate. The washing process was repeated 5 times. Then, the color developing agent A (50 μl) was added to each well in a dark room followed by the color developing agent B (50 μl) was added. After the staining time was reached, 50 μl of stop solution was directly added to each well. The target plate was placed on a microplate reader, the wavelength was set to 450 nm, the absorbance (OD) of the blank well was adjusted to zero, and the OD value of each well was measured. The OD value should be determined within 10 min after the addition of the stop solution. Finally, the linear regression equation of the standard curve was derived according to the concentration of the standard substance and its corresponding OD value and the corresponding sample concentration is calculated based on the OD value of the sample using the regression equation.
Brain tissue reactive chlorine free radical (ROS) detection:
Frozen brain tissue was weighed into an EP tube and 100 mM phosphate buffer pre-cooled in a refrigerator was added in the ration of 20 ml to 1 mg of tissue. The mixture was homogenized by ultrasonication over ice. After complete homogenization, it was centrifuged (1000 g, 10 min, 4°), the supernatant was collected and stored at -20° for subsequent use. The protein concentration of the supernatant from each sample was determined using the BCA protein determination kit. A working solution of 1 mM DCFH-DA was prepared fresh in PBS in the ration of 10 mM DCFHDA: PBS was 1:9. The measurement wells and blank control wells of the sample were loaded as shown in Table 1, incubated after thoroughly mixing the liquid in each well for 30 min at 37°. Finally, the fluorescence of the plate was read on the microplate reader, the fluorescence excitation wavelength was set to 500 nm, and the fluorescence intensity was measured.
| Measuring well | Control well | |
|---|---|---|
| Homogenate supernatant | 180 μl | 180 μl |
| 1 mM DCFH-DA working fluid | 10 μl | |
| PBS (μl) | 10 μl |
Table 1: Sample Addition in Different Wells in ROS Detection Elisa Plate
Western blot analysis:
The hippocampus (30 mg) or cortical tissue (50 mg) of each group of mice were weighed into EP tubes, and cold Western and IP cell lysis buffer were added at a ratio of 15 μl of lysate per 1 mg of tissue. PMSF (1 mM) was added within 5 min before the addition of the lysate. The tissue was homogenized by ultrasonic homogenization while keeping the EP tubes over ice. After the homogenization the tubes were kept on ice for 30 min, centrifuged (12 000 g, 5 min, 4°), supernatant was collected and the sample protein concentration was determined using the BCA protein determination kit. According to the final concentration, a total protein amount of 50-100 μg was adjusted electrophoresis. The general volume is 5-15 μl, then according to the measured protein concentration the protein content of 50~100 μg per protein sample was adjusted, loading buffer was added in the ration of 1:4, stored at -80° till subjected to SDS-PAGE for electrophoresis.
Two glass plates were aligned in the correct way, inserted into the glass plate clamp properly to avoid leakage. Then, as shown in Table 2, the corresponding concentration of the separation gel was prepared according to the molecular weight of the target protein (8 % separation gel was selected for iNOS, 12 % or 10 % separation gel was selected for Bax, Bcl-2, and cleaved caspase-3). According to Table 2, the reagents were prepared by sequentially taking the reagents (about 5 ml for one separation gel). After adding a series of liquids, mixed the liquid with a 1000 l pipette and was added to the gap between the two glass plates till the level is about 2 cm from the edge of the small board.
| Concentration of separation gel | 10% (ml) | 12% (ml) | 14% (ml) |
|---|---|---|---|
| H2O | 1.8 | 1.2 | 1.1 |
| 30 % Acr | 1.4 | 1.6 | 2.0 |
| 1.5 M Tris-HCl (PH 8.8) | 2.2 | 2.2 | 2.2 |
| 10 % SDS | 0.04 | 0.04 | 0.04 |
| 10 % AP | 0.04 | 0.04 | 0.04 |
| TEMED | 0.002 | 0.002 | 0.002 |
Table 2: Configuration of Separation Gel
Tripple distilled water was added into the gap between the glass plates, the glass plates was slowly lowered to the surface of the separation gel to prevent the water flow to excessively impact on the separation gel. Kept room temperature for 30 min, and the concentrated gel was poured. As shown in Table 3, the separation gel was allowed to solidify at room temperature for about 30 min. At this time, a fold line appears at the interface between the glue and water. The water on the gel was poured out, and the residual water was further removed by a filter paper. Then, according to the formula listed in Table 3, a concentrated gel (about 2 ml of a separating gel) was prepared. After all the reagents were added to the beaker, they were immediately pipetted and mixed and then the liquid mixed by the pipette was added between the two glass plates until a slight amount of liquid overflows. A comb was inserted between the two glass plates to avoid bubbles in the concentrated gel.
| 5% concentrated gel | |
|---|---|
| H2O | 1.6 |
| 30 % Acr | 0.28 |
| 1.5 M Tris-HCl (pH 8.8) | 0.27 |
| 10 % SDS | 0.02 |
| 10 % AP | 0.05 |
| TEMED | 0.001 |
Table 3: Configuration of Concentrated Gel
The measureed data were expressed as mean±standard deviation (SD) and statistical analysis was performed using SPSS13.0 statistical analysis software. One-way analysis of variance (ANOVA) was used for comparison between groups. P<0.05 was considered statistically significant.
Results and Discussion
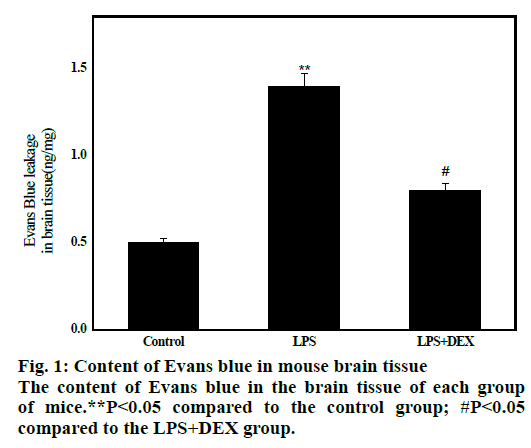
The results are shown in fig. 1. The average concentration of Evans blue in brain tissue of LPS group was 1.16±0.25 after 8 h of LPS administration, which was significantly higher than that of control group (0.52±0.22, P<0.01), indicating that BBB permeability increased and transport of Evans blue from blood into brain tissue increased. After administration of DEX, the average content of Evans blue in the LPS+DEX group was 0.81 ± 0.12, which was significantly lower than that in the LPS group (1.17 ± 0.26, P<0.05). This indicates that the BBB permeability is reduced compared to the model group. The results indicate that DEX can improve the LPS-induced increase in mouse BBB permeability.
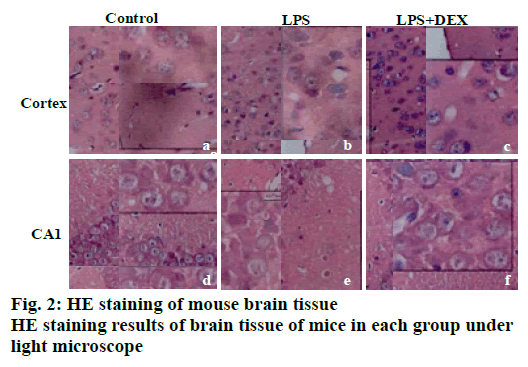
The results of HE staining are shown in fig. 2. It can be observed that there is no obvious abnormality in the cell morphology of cortex and the hippocampal CA1 area in the control group. It can be seen that the cell morphology is regular, no shrinkage, and the edge is clear. In the LPS model group, a large number of irregular cell contours were observed in the cortex, and the cells were shrunk and the nuclei were deeply stained. In the CA1 area of the LPS group, abnormal cell morphology was observed, and the size was different. A large number of cells were deeply stained, and the cell arrangement was irregular. After DEX treatment, the abnormal changes of neuronal structure caused by LPS in the brain cortex and hippocampus were all relieved to varying degrees. In the LPS+DEX group, the deepstained and shrunken cells in the brain endothelium were significantly reduced, and the cells deeply stained in the CA1 area were also significantly reduced.
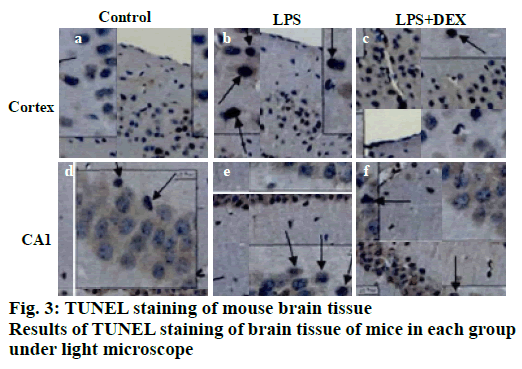
TUNEL staining results of brain tissue is shown in fig. 3, apoptotic cells were occasionally seen in the cerebral cortex and the CA1 reced.
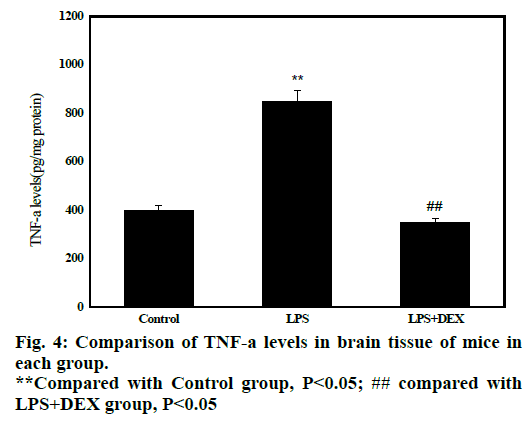
Statistical results in fig. 4 shows that after administration of LPS, the content of TNF-α in brain tissue of LPS group (847.70±120.01) was significantly higher than that of control group (428.71 ± 47.01, P<0.05). After treatment with DEX, the content of TNF-α in the brain tissue of LPS+DEX group (348.59 158.42) was significantly lower than that in the LPS group (P<0.05). The results indicated that treatment with DEX can reduce the level of TNF-α in brain tissue of LPS-induced sepsis mice.
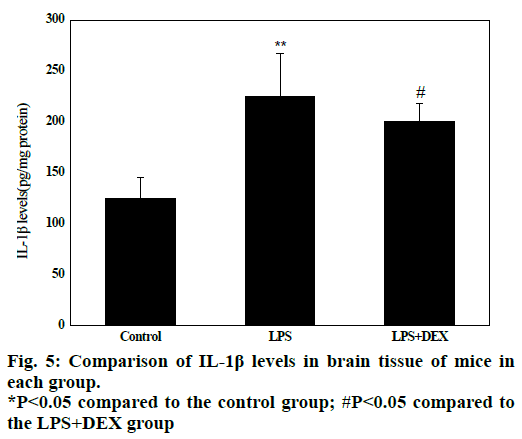
Experimental data in fig. 5 shows that in the LPS group, the IL-1β content in the brain tissue (224.08 ± 61.32) was significantly higher than that in the control group (128.5 ± 41.52) after LPS treatment (P<0.05). Compared to the LPS group, the IL-1β content in the brain tissue of the LPS+DEX group was (197.06 ± 46.13) was significantly lower than that in the LPS group (224.08 ± 61.32, P<0.05). The results indicated that DEX can reduce the level of IL-1β in brain tissue of LPS model mice.
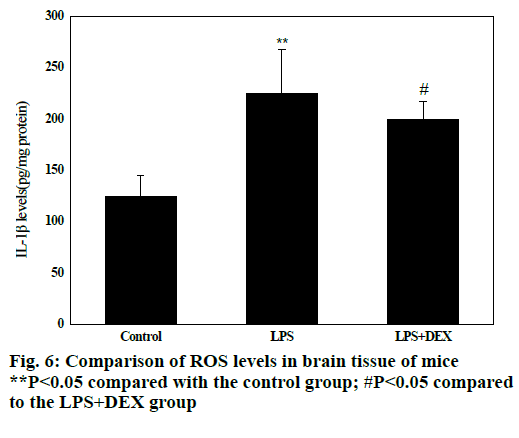
Fig. 6 shows that compared with the control group, the levels of ROS in the brain tissue of the LPS group were significantly increased after intraperitoneal injection of LPS (P<0.05), and the difference was statistically significant; compared with the LPS group, the levels of ROS in brain tissue of LPS+DEX mice were significantly decreased after treatment with DEX (P<0.05), and the difference was statistically significant. The results indicated that DEX can reduce the level of ROS in brain tissue of LPS model mice.
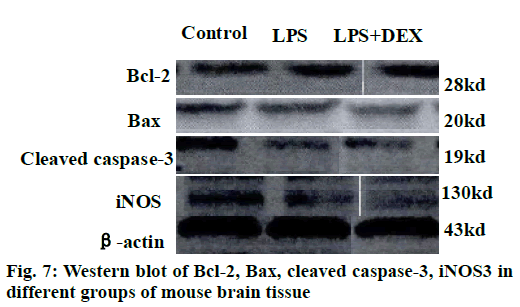
The results of the Western blot strips of the brain tissue cortex and hippocampal iNOS of each group of mice are shown in fig. 7. Compared to the control group, the level of iNOS in the cortex was significantly increased in the LPS group after intraperitoneal injection of LPS (P<0.05). Compared to the LPS group, the level of iNOS in the cortex of the LPS+DEX group was significantly decreased after treatment with DEX (P<0.05). In addition, Western blot analysis of iNOS in hippocampus of mice in each group showed the same change. The level of iNOS in the hippocampus of the LPS+DEX group was significantly lower than that of the LPS group (P<0.05). The experimental results showed that DEX can reduce the level of iNOS in brain tissue of LPS model mice.
The semi-quantitative statistics of Bax/Bcl-2 Western blot strips in the brain cortex and hippocampus indicated that compared to the control group, intraperitoneal injection of LPS resulted in a decrease in the relative expression of Bcl-2/Bax in the cerebral cortex and hippocampus (P<0.05). However, the relative expression of Bcl-2/Bax in the brain cortex and hippocampus of LPS+DEX mice was increased compared with LPS group after treatment with DEX (P<0.05). The results indicated that DEX may reduce the expression of proapoptotic protein Bax by comparatively increasing the expression of protein Bcl-2, thereby reduce the occurrence of intracerebral apoptosis induced by LPS.
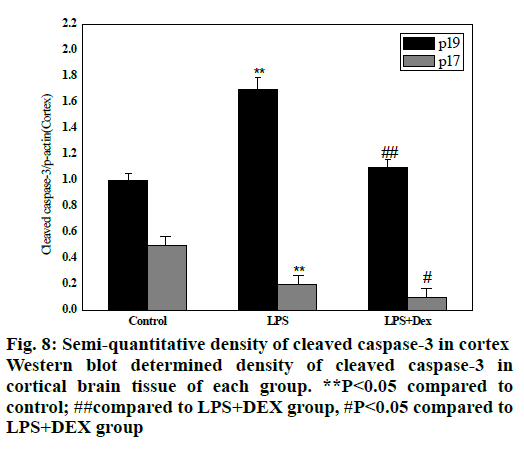
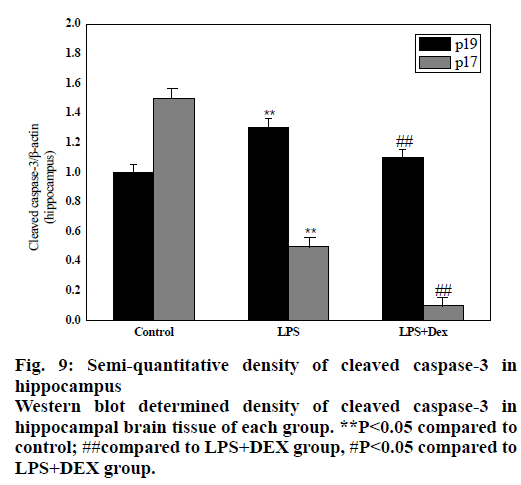
As shown in figs. 8 and 9, compared to the control group, intraperitoneal injection of LPS resulted in elevated levels of cleaved caspase-3 in the brain endothelium and hippocampus, and the difference was statistically significant (P<0.05). However, after treatment with DEX, the levels of cleaved caspase-3 in the cortex and hippocampus of the LPS+DEX group were decreased compared to that of the LPS group (P<0.05). The results suggested that DEX may reduce the occurrence of intracerebral apoptosis induced by LPS by reducing the level of cleaved caspase-3.
In this study, SPF-level BALB/c mice were used to detect the staining of HE and TUNEL cells, the content of Evans blue in the brain, the expression levels of TNF-α, IL-1β, MDA, ROS, Bcl-2, Bax, cleaved caspase-3 and iNOS in mouse brain to explore the possible mechanism of dexmedetomidine brain protection. The results showed that firstly, dexmedetomidine can attenuate the abnormal morphological changes of neurons in the brain and neuronal apoptosis, secondly, dexmedetomidine can attenuate the expression levels of TNF-α, IL-1β, MDA, ROS, Bcl-2, Bax, cleaved caspase-3 and iNOS. In summary, the cerebral protection mechanism of dexmedetomidine in septic mice may be connected to reducing the blood brain barrier destruction, reducing brain inflammation and oxidative stress levels, as well as inhibition of apoptosis by altering the expression of Bax, Bcl-2, and Cleaved caspase-3. There are still some shortcomings in the research process, but the research results still provide some guidance for future research.
References
- Ning Q, Liu Z, Wang X. Neurodegenerative changes and neuroapoptosis induced by systemic lipopolysaccharide administration are reversed by dexmedetomidine treatment in mice. Neurol Res 2017;39(4):357-66.
- Rodríguez-González R, Sobrino T, Veiga S. Neuroprotective effects of dexmedetomidine conditioning strategies: Evidences from an in vitro model of cerebral ischemia. Life Sci 2016;144:162-69.
- Wang Y, Wang C, Zhang D. Dexmedetomidine protects against traumatic brain injury-induced acute lung injury in mice. Medical science monitor: Int Med J Exp Clin Res 2018;24:4961.
- Wang Y, Wu S, Yu X. Dexmedetomidine protects rat liver against ischemia-reperfusion injury partly by the α2A-adrenoceptor subtype and the mechanism is associated with the TLR4/NF-κB pathway. Int J Mol Sci 2016;17(7):995.
- Zhu Y J, Peng K, Meng X W. Attenuation of neuroinflammation by dexmedetomidine is associated with activation of a cholinergic anti-inflammatory pathway in a rat tibial fracture model. Brain Res 2016;1644:1-8.
- Dellepiane S, Marengo M, Cantaluppi V. Detrimental cross-talk between sepsis and acute kidney injury: new pathogenic mechanisms, early biomarkers and targeted therapies. Crit Care 2016;20(1):61.
- Mazeraud A, Pascal Q, Verdonk F. Neuroanatomy and physiology of brain dysfunction in sepsis. Clin Chest Med 2016;37(2):333-45.
- Liu Z, Wang Y, Wang Y. Dexmedetomidine attenuates inflammatory reaction in the lung tissues of septic mice by activating cholinergic anti-inflammatory pathway. Int Immunopharmacol 2016;35:210-16.
- Jiang L, Hu M, Lu Y. The protective effects of dexmedetomidine on ischemic brain injury: a meta-analysis. J Clin Anesth 2017;40:25-32.
- Heming N, Mazeraud A, Verdonk F. Neuroanatomy of sepsis-associated encephalopathy. Crit Care 2017;21(1):65.
