- *Corresponding Author:
- P. Trivedi
School of Pharmaceutical Sciences, Rajiv Gandhi Proudyogiki Vishwavidyalaya, Airport Bypass Road, Gandhi Nagar, Bhopal-462 036, India
E-mail: prof_piyushtrivedi@yahoo.com
| Date of Submission | 13 January 2005 |
| Date of Revision | 06 August 2005 |
| Date of Acceptance | 16 May 2006 |
| Indian J Pharm Sci, 2011, 73 (3): 300-302 |
Abstract
Simple, sensitive, and specific spectrophotometric methods were developed and validated for quantitation of diclofenac potassium and tizanidine in tablet dosage form. Three new analytical methods were developed based on the simultaneous estimation of drugs in a binary mixture without previous separation. In multiwavelength technique, the binary mixture was determined by mixed standards and three sampling wavelengths of 277 nm, 295 nm (isobestic point), and 320 nm. In simultaneous equation method, the drugs were determined by using the absorptivity values of diclofenac potassium and tizanidine at selected wavelengths, viz., 277 nm and 320.3 nm. The standard deviation value for the validation parameters was found to be between 0.08 and 0.68 for multiwavelength technique and between 0.069 and 1.23 for simultaneous equation method. The graphical absorbance ratio method was performed by absorbances at 277 nm, 295 nm (isobestic point), and 320.4 nm of their mixture. These three methods are simple, accurate, and rapid, and they require no preliminary separation and can therefore be used for routine analysis of both drugs in quality control laboratories.
Diclofenac potassium (DP) is potassium-[(2,6-dichlorophenyl)amino]-phenyl acetate. It is a potassium salt of an aryl acetic acid derivative [1-4]. It possesses analgesic, antiinflammatory, and antipyretic activity. It inhibits prostaglandin synthesis by interfering with the action of prostaglandin synthetase (cyclooxygenase) [5,6]. Tizanidine (TZD) is 5-chloro-N-(2-imidazolin-2-yl)-2,1,3-benzothiadiazol-4-ylamine [7]. Tizanidine is a rapidly acting potent central muscle relaxant. It is a central α2-receptor agonist. Its major site of action is the spinal cord, and it preferentially inhibits polysynoptic mechanisms responsible for excessive muscle tone, mainly by reducing the release of excitatory amino acids from interneurons. The drug doesn’t affect neuromuscular transmission [8].
Literature survey reveals that as such, no spectrophotometric and HPLC method has yet been reported for the analysis of these two drugs in combination. The IP, BP, and USP do not specify spectrophotometric determination for diclofenac potassium or tizanidine, whereas diclofenac sodium is official in IP, BP, and USP; and titrimetry, HPLC, spectrophotometry, gas chromatographic methods have been reported for diclofenac sodium.
Molecular absorption spectroscopy has been extensively used for the quantitative determination of drugs in pharmaceutical preparation as well as for the analysis of synthetic mixtures. The use of these techniques for pharmaceutical analysis have the inherent disadvantage that most active drugs absorb in the UV region and exhibit strongly overlapped spectra that impede their simultaneous determination.
As such, no spectrophotometric method for simultaneous estimation of diclofenac potassium and tizanidine combination has been reported, which prompted to pursue the present work. It was also planned to validate the developed methods as per ICH norms [9-14]. The objective of the present work is to develop and validate new analytical methods for simultaneous determination of diclofenac potassium and tizanidine in a binary mixture without separation.
Materials and Methods
An UV/Vis recording spectrophotometer (Shimadzu Model-UX160A) with ±0.5 nm (with auto wavelength correction 1 cm matched quartz cells) wavelength accuracy and 3 nm bandwidth was employed in the binary mixture determination. 2% dimethyl formamide (DMF) (analytical grade) was used as the solvent after considering the solubility factors of both the drugs as well as the interference due to excipient matrix present in tablet formulation. Reference standards (diclofenac potassium and tizanidine) of purity 98.50% to 101.5% were procured from Sun Pharmaceuticals Ltd., Baroda, India.
Multiwavelength method (Method A) [15,16]
The utility of multiwavelength data processing programme is to calculate the unknown concentration of component of interest present in a mixture containing both a component of interest and an unwanted interfering component by the mechanism of the absorbance difference between two points on the mixture spectra is directly proportional to the concentration of the components of interest, independent of the interfering components. It involves the estimation of two components, each time considering the second one to be an interfering one. An important criterion for this method is the presence of some absorbance in the spectrum of interfering component, where the component of interest has its λmax. With such flexibility, the interference among the components can be dramatically reduced. The measuring wavelength can be spaced either equally of arbitrarily, depending on the measuring purpose. The number of measuring wavelengths ranges from the number of components (applicable when pure component samples are used) to the number of standard samples minus 1 (applicable when mixed standard samples are used).
Vierordt’s simultaneous equation method (Method B) [17,18]
This method of analysis is based on the absorption of drugs (X and Y) at the wavelength maximum of the other. The quantification analyses of DP and TZD in a binary mixture were performed with the following equations: Cx = (A2ay1–A1ay2)/ax2ay1–ax1ay2 (Eqn. 1), Cy = (A1ax2– A2ax1)/ax2ay1–ax1ay2 (Eqn. 2), where Cx and Cy are the concentrations of X and Y, respectively in the diluted sample, ax1 and ax2 are absorptivities of X at λ1 and λ2, ay1 and ay2 are absorptivities of Y at λ1 and λ2. The absorbance of the diluted samples at λ1 and λ2 are A1 (A1 = axibcx+ayibcy) and A2 (A2 = ax2bcx+ay2bcy), respectively.
Graphical absorbance ratio Q-Analysis method (Method C) [19,20]
The drugs that obey Beer’s law at all wavelengths and the ratio of absorbances at any two wavelengths are a constant value independent of concentration or pathlength. The concentration of individual components may be calculated by mathematical treatment of the simultaneous equations Cx = Qm–Qy/Qx–Qy)×A1/ax1 (Eqn. 3), Cy = Qm–Qy/Qy–Qx)×A1/ax1 (Eqn. 4), where Qm = A2/ A1, A1 is absorbance of sample at isoabsorptive point, A2 is absorbance of sample at λ max of one of the two components, Qx = ax2/ax1, Qy = ay2/ay1, ax1 and ax2 represent absorptivities of X at λ1 (isoabsorptive point) and λ2 (λ max of one of the two components) and ay1 and ay2 denote absorptivities of Y at λ1 (isoabsorptive point) and λ2, respectively; Cx and Cy be the concentration of X [should lie outside the range of (0.1-0.2)] and Y, respectively.
Preparation of standard stock solution
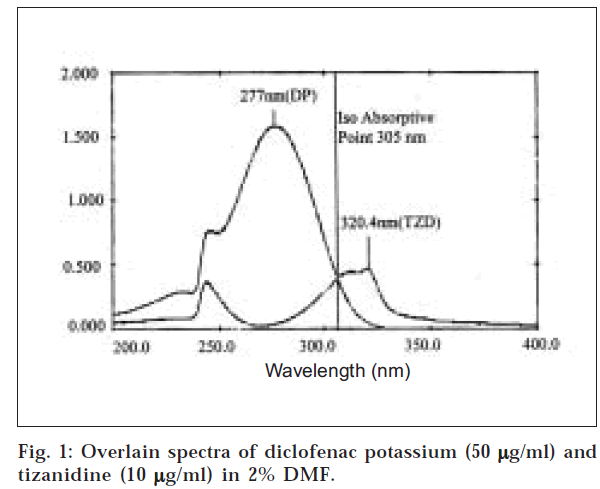
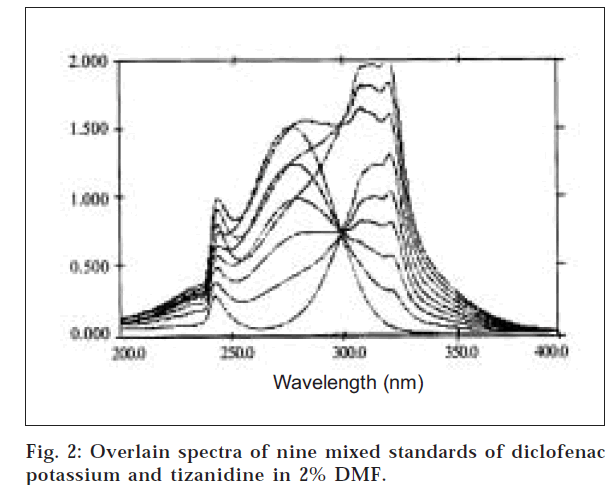
An equivalent of 10 mg each of diclofenac potassium (DP) and tizanidine (TZD) in 100 ml of 2% DMF was used as standard stock solution. DP and TZD were further diluted to 50 μg/ml and 10 μg/ml, respectively. Both solutions were scanned over the range of 400 nm and 200 nm in the spectrum mode with the scan speed of 480/min and the overlain spectra of the two were recorded (fig. 1). The overlain spectra exhibit major absorbance maxima at 277 nm and 320.4 nm for DP and TZD, respectively, which revealed that the peaks are well resolved, thus satisfying the criteria for obtaining maximum precision based on absorbance. Beer–Lamberts law obeyed in the range of 0-50 μg/ml and 0-25 μg/ml for DP and TZD, respectively. Nine mixed standards 0, 10, 20, 30, 40, 50, 25, 35, and 45 for DP; and 25, 20, 15, 10, 5, 0, 40, 35 and 30 for TZD were obtained from the stock solution containing 50 μg/ml each of DP and TZD.
Analysis of tablet formulation
Twenty tablets (brand name-Tizaren, manufactured by Sun Pharmaceuticals Ltd.) were taken and their average weight was determined. They were crushed to fine powder containing the equivalent of 50 mg of DP was taken in 100 ml volumetric flask. The TZD present in this tablet powder was 2 mg, which could not be found out accurately due to low absorbance. Hence, to increase the accuracy, accurately weighed 8 mg of pure drug of TZD was added to the crushed tablet, which increased the amount of TZD to 10 mg. It was then dissolved in 2% DMF by intermittent shaking for 4-5 min. The volume was made up to 100 ml, and the solution was filtered through Whatman filter paper (No. 41). The filtrate was further diluted to get final concentration of 25 μg/ml of DP and 5 μg/ml of TZD.
The analysis of the binary mixture containing TZD and DP was performed from the absorbance value at 277 nm (λmax for DP), 320.40 nm (λmax for TZD) and 305 nm (isobestic point) as in the fig. 1 of the binary mixture in 2% DMF by using the formulas mentioned above (Eqns. 3 and 4). The obtained results are given in Table 1.
| Label claim (µg/ml) | DP | 50 | 50 | 50 | 50 | 50 | 50 |
|---|---|---|---|---|---|---|---|
| TZD | 10 | 10 | 10 | 10 | 10 | 10 | |
| Method A (%) | DP | 101.69 | 101.5 | 101.04 | 98.78 | 98.25 | 101.34 |
| TZD | 100.03 | 98.4 | 99.61 | 98.58 | 99.78 | 98.92 | |
| Method B (%) | DP | 98.46 | 97.92 | 97.89 | 98.14 | 98.36 | 98.42 |
| TZD | 100.07 | 98.1 | 101.5 | 99.2 | 100.3 | 98.7 | |
| Method C (%) | DP | 97.99 | 98.32 | 98.49 | 97.66 | 97.33 | 98.98 |
| TZD | 98.51 | 97.85 | 97.67 | 98.24 | 99.01 | 97.38 |
% is amount of drug present in the tablet expressed as percentage, Method A is multiwavelength method, Method B is simultaneous equation method, Method C is graphical absorbance ratio method, DP is diclofenac potassium, TZD is tizanidine
Table 1: Results Of Analysis Of Tablet Formulation
Recovery studies
To a pre-analyzed tablet solution having 25 μg/ml of DP and 5 μg/ml of TZD, a definite and different concentration of pure drug was added and then its recovery study was performed. This was repeated six times to emphasize validation, and the results are summarized in Tables 2 and 3. The results were calculated by using the formula: % Label claim = CxDxA/ Wx100/L (Eqn. 5), % Dissolved = CxDxWs/LxVmx100 (Eqn. 6), where C is concentration from standard curve, D is dilution factor, A is average weight of the tablet, W is weight of composite taken, Ws is weight in mg of respective standard and Vm is volume of dissolution medium.
| Amount of pure drug added (µg/ml) | DP | 5 | 10 | 15 | 20 | 25 |
|---|---|---|---|---|---|---|
| TZD | 25 | 20 | 15 | 10 | 5 | |
| Method A (%) | DP | 98.01 | 99.66 | 99.74 | 98.52 | 99.03 |
| TZD | 98.15 | 97.39 | 97.46 | 97.20 | 97.57 | |
| Method B (%) | DP | 98.23 | 98.35 | 98.02 | 98.66 | 98.64 |
| TZD | 100.30 | 102.10 | 102.20 | 100.44 | 98.15 | |
| Method C (%) | DP | 97.37 | 98.95 | 98.64 | 98.45 | 98.65 |
| TZD | 98.94 | 99.75 | 98.25 | 98.69 | 98.76 |
% is amount of drug present in the tablet expressed as percentage, Method A is multiwavelength method, Method B is simultaneous equation method, Method C is graphical absorbance ratio method, DP is diclofenac potassium, TZD is tizanidine
Table 2: Recovery Experiment Results Obtained For Diclofenac Potassium And Tizanidine
| Method A | Method A | Method C | |||||||||||||||
|---|---|---|---|---|---|---|---|---|---|---|---|---|---|---|---|---|---|
| Tablet formulation | DP | SD | 1.01 | 0.25 | 0.59 | ||||||||||||
| Coeff. varn | 0.99 | 0.25 | 0.61 | ||||||||||||||
| TZD | SD | 0.68 | 1.23 | 0.59 | |||||||||||||
| Coeff. varn | 0.60 | 1.23 | 0.61 | ||||||||||||||
| Recovery studies | DP | SD | 0.09 | 0.18 | 0.02 | 0.09 | 0.52 | 0.09 | 0.15 | 0.27 | 0.19 | 0.39 | 0.18 | 0.08 | 0.48 | 0.25 | 0.16 |
| Coeff. varn | 0.33 | 0.52 | 0.42 | 0.23 | 1.04 | 0.34 | 0.44 | 0.70 | 0.42 | 0.80 | 0.62 | 0.23 | 0.12 | 0.56 | 0.33 | ||
| TZD | SD | 0.10 | 0.07 | 0.09 | 0.09 | 0.05 | 0.13 | 0.12 | 0.13 | 0.25 | 0.10 | 0.06 | 0.27 | 0.16 | 0.14 | 0.21 | |
| Coeff. varn | 0.35 | 0.29 | 0.48 | 0.61 | 0.47 | 1.28 | 0.81 | 0.65 | 1.01 | 0.34 | 0.40 | 1.33 | 0.64 | 0.46 | 0.61 | ||
SD is standard deviation, coeff. varn. is coefficient of variation
Table 3: Statistical Validation Of Tablet Formulation And Recovery Experiment Results Obtained For Diclofenac Potassium And Tizanidine
Result and Discussion
In the present work, three methods, namely, multiwavelength spectroscopy, simultaneous equation (Vierordt’s method), and graphical absorbance ratio method (Q – Analysis) were developed for the simultaneous spectroscopic estimation of diclofenac potassium and tizanidine in commercially available tablet dosage form using 2% DMF (pH from 6.3-6.8) solvent. From the overlain spectra of the two drugs, 277 nm and 320 nm were selected as the sampling wavelengths for diclofenac potassium at a concentration of 50 μg/ml and tizanidine at a concentration of 10 μg/ml, respectively (fig. 1).
The use of nine mixed standards and three sampling wavelengths of 277 nm (λmax of DP) 295 nm, and 320 nm (λmax of TZD) gave optimum accuracy, precision, time, economy, and sensitivity. The wavelengths used for graphical absorbance ratio method is 305 nm (isoabsorptive point) and 320.4 nm (λ max of TZD) (fig. 2). The proposed procedures were successfully applied to the determination of TZD and DP in the commercially available tablets dosage form, and the results are presented in Tables 2 and 3. The values of standard deviation for the validation parameters (linearity, accuracy, repeatability, intermediate precision, and reproducibility) of DP and TZD in tablet formulation were found to be between 0.08 and 0.68 for method A, 0.069 and 1.230 for method B, and 0.08-0.59 for method C.
A critical evaluation of the proposed method was performed by the statistical analysis of the experimental data. In order to demonstrate the validity and applicability of the proposed methods, recovery studies were performed by analyzing synthetic mixtures of DP and TZD with different composition ratios. The percentage recoveries of TZD and DP from spiked excipients are summarized in Table 2.
The percentage recoveries were found to be 99.5-101%, 98-103% and 97-100% for methods A, B, and C, respectively, and the results presented in Tables 2 and 3 agreed with the labelled content. The relative standard deviations were found to be within the limit, indicating good accuracy, precision, and repeatability of the proposed methods.
Multiwavelength technique (Method A) shows less standard deviation for DP and TZD in linearity, whereas Method C has least coefficient of variation for DP and TZD in linearity. In accuracy, the standard deviation and coefficient of variation values by simultaneous equation method was low for DP, and it was high for TZD. This variation may be due to the external addition of the pure drug. Method C shows less variation values for DP and TZD. All the three methods in precision show less standard deviation and coefficient of variation for DP and TZD by simultaneous method than the other two methods. The coefficient of variation values for all the methods were found to lie within the limit (<2%). Among the methods, multiwavelength method has low variation values and within the limit of percentage mean for both DP and TZD.
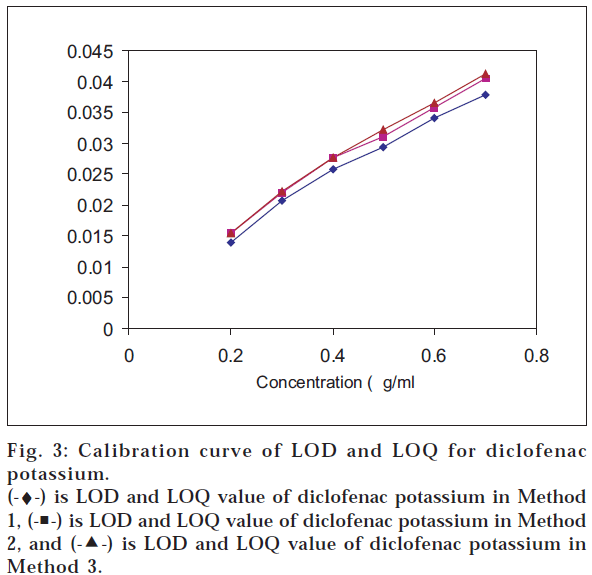
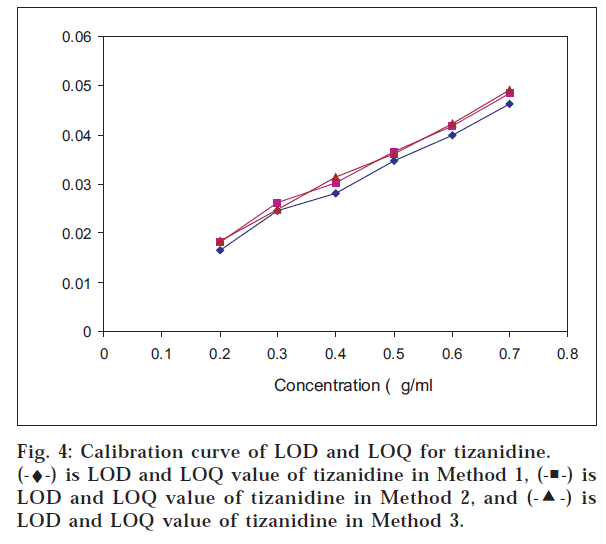
The LOD and LOQ values for tizanidine were found to be least by the graphical absorbance ratio method – 0.3102 μg/ml and 0.9147 μg/ml, respectively; and in case of multiwavelength spectroscopic method for diclofenac potassium, it was 0.4239 μg/ml and 1.2846 μg/ml, respectively (figs. 3 and 4) (Table 4).
| Validation parameter | Drug | Statistics | Method A | Method B | Method C |
|---|---|---|---|---|---|
| Linearity | SD | 0.25 | 0.45 | 0.39 | |
| DP | Coeff. Varn | 0.54 | 0.65 | 0.45 | |
| SD | 0.38 | 0.44 | 0.40 | ||
| TZD | Coeff. Varn | 0.61 | 0.73 | 0.52 | |
| Accuracy | SD | 1.01 | 0.25 | 0.59 | |
| DP | Coeff. Varn | 0.99 | 0.26 | 0.61 | |
| SD | 0.68 | 1.23 | 0.59 | ||
| TZD | Coeff. Varn | 0.60 | 1.23 | 0.61 | |
| Repeatability | SD | 0.19 | 0.13 | 0.18 | |
| DP | Coeff. Varn | 0.72 | 0.49 | 0.57 | |
| SD | 0.14 | 0.08 | 0.19 | ||
| TZD | Coeff. Varn | 1.03 | 0.59 | 0.85 | |
| Intermediate | SD | 0.18 | 0.09 | 0.26 | |
| Precision | DP | Coeff. Varn | 0.80 | 0.37 | 1.06 |
| SD | 0.13 | 0.07 | 0.26 | ||
| TZD | Coeff. Varn | 0.92 | 0.71 | 0.49 | |
| Reproducibility | SD | 0.16 | 0.09 | 0.13 | |
| DP | Coeff. Varn | 0.45 | 0.37 | 0.81 | |
| SD | 0.08 | 0.09 | 0.09 | ||
| TZD | Coeff. Varn | 0.55 | 0.08 | 0.53 | |
| Robustness | SD | 0.12 | 0.11 | 0.30 | |
| DP | Coeff. Varn | 0.31 | 0.08 | 0.53 | |
| SD | 0.09 | 0.51 | 0.12 | ||
| TZD | Coeff. Varn | 0.31 | 0.68 | 0.45 | |
| LOD | DP | 0.42 | 0.76 | 0.51 | |
| TZD | 0.36 | 0.38 | 0.31 | ||
| LOQ | DP | 1.28 | 2.30 | 1.53 | |
| TZD | 1.09 | 1.16 | 0.91 |
LOD is limit of detection, LOQ is limit of quantitation, SD is standard deviation, coeff. varn. is coefficient of variation
Table 4: Results Of Validation Parameters (αG/Ml)
With respect to the validation results obtained from the above developed methods, multiwavelength method is more accurate, precise, and simple, with limited errors. The simultaneous equation and graphical absorbance ratio methods are accurate and precise but require mathematical calculations, which make the work complicated. It can be said that the three methods described here are simple, accurate and could be used for rapid and reliable determination of diclofenac potassium and tizanidine in routine laboratory analysis.
Acknowledgements
Authors gratefully acknowledge Director, Shri G. S. Institute of Technology & Science, Indore, for providing the necessary facilities for undertaking the research work. Authors are grateful to the Ministry of Human Resource Development, New Delhi, for providing a research fellowship for this project.
References
- The Indian Pharmacopoeia, Vol-I, Govt. of India, The Controller of Publications, New Delhi, 1996, 242.
- United State Pharmacopoeia, Vol. XXIV, NF-14, United statesPharmacopoeial Convention, Rockville, MD, 2000, 546.
- Budavari, S., Eds., In; The Merck Index, 12th Edn., Merck & Co., Inc., Whitehouse Station, New Jersey, 1996, 521.
- Reynolds, J. E. F., Eds., In; Martindale, The Extra Pharmacopoeia, 31st Edn., The Royal Pharmacopoeial Society, London, 1996, 327.
- Tripathi, K. D., Eds., In; Essentials of Medical Pharmacology, 3rd Edn.,Jaypee Brothers Medical Publishers Pvt Ltd., 1995, 421.
- Ronald, F. B., In.; Foye, W. O, Thomas, L. L., and David, A. W., Eds., In; Principles of Medicinal Chemistry, 4th Edn., Lippincott Williams & Wilkins, B. I., Waverly Pvt. Ltd., USA, 1996, 558.
- Budavari, S., Eds., In; The Merck Index, 12th Edn., Merck & Co., Inc., Whitehouse Station, New Jersey, 1996, 1618.
- Current Index of Medical Specialities, Vol. 24, No-1, Jan-March, 2001, 277.
- Code Q2A, Text on Validation of Analytical Procedure, Step-3, Consensus Guidelines, ICH Harmonized Tripartite Guidelines, 1994.
- Code Q2A, Text on Validation of Analytical Procedure, Step-4, Consensus Guidelines, ICH Harmonized Tripartite Guidelines, 1994.
- Validation of Analytical Procedures-Definition and Terminology, FDA’s Centre for Veterinary Medicine Guidance Document, 63, 1999.
- Taylor, J. K., Anal. Chem., 1983, 55, 600.
- Wilson, T. P., J. Pharm. Biomed. Anal., 1990, 8, 389.
- Hsu, H. and Chien, C. S., J. Food and Drug Analysis, 1994, 2, 161.
- Erk, N., Die Pharmazie, 2003, 58, 543.
- Instruction Manual, Shimadzu 160A, UV/Vis Recording spectrophotometer, Shimadzu Corporation, Tokyo, Japan, 4.55.
- Davidson A.G., In; Beckett, A. H. and Stenlake, J. B., Eds., Practical Pharmaceutical Chemistry, 4th Edn., Vol-2, CBS Publishers & Distributors, New Delhi, 1997, 275.
- Glen, A. C., J. Pharm. Pharmacol., 1960, 12, 595.
- Pernarowski, M., Kneval, A. M. and Christian, J. E., J. Pharm.Sci., 1960, 50, 943.
- Ghanem, A., Meshali, M. and Foda, A., J. Pharm. Pharmcol., 1975, 31, 122.


