- *Corresponding Author:
- Smita Rane
School of Pharmacy and Technology Management, Shirpur Campus, NMIMS University, Shirpur‑425 405, India
E‑mail: smita.edu@hotmail.com
| Date of Submission | 29 July 2010 |
| Date of Decision | 09 April 2013 |
| Date of Acceptance | 30 April 2013 |
| Indian J Pharm Sci 2013;75(4):420-426 |
Abstract
The aim of this study was to investigate the combined influence of 3 independent variables in the preparation of paclitaxel containing pH-sensitive liposomes. A 3 factor, 3 levels Box-Behnken design was used to derive a second order polynomial equation and construct contour plots to predict responses. The independent variables selected were molar ratio phosphatidylcholine:diolylphosphatidylethanolamine (X 1 ), molar concentration of cholesterylhemisuccinate (X 2 ), and amount of drug (X 3 ). Fifteen batches were prepared by thin film hydration method and evaluated for percent drug entrapment, vesicle size, and pH sensitivity. The transformed values of the independent variables and the percent drug entrapment were subjected to multiple regression to establish full model second order polynomial equation. F was calculated to confirm the omission of insignificant terms from the full model equation to derive a reduced model polynomial equation to predict the dependent variables. Contour plots were constructed to show the effects of X 1 , X 2 , and X 3 on the percent drug entrapment. A model was validated for accurate prediction of the percent drug entrapment by performing checkpoint analysis. The computer optimization process and contour plots predicted the levels of independent variables X 1 , X 2 , and X 3 (0.99, -0.06, 0, respectively), for maximized response of percent drug entrapment with constraints on vesicle size and pH sensitivity.
Keywords
Box-Behnken design, pH-sensitive, liposomes, optimization, paclitaxel
Paclitaxel, the first of a new class of microtubule stabilizing agents, has been hailed by National Cancer Institute as the most significant advance in chemotherapy during the past 20-25 years [1]. Paclitaxel is poorly soluble in aqueous medium, and is currently formulated in a vehicle composed of 1:1 blend of cremophor EL and ethanol which is diluted with 5-20 fold in normal saline or dextrose solution (5%) for administration [2,3]. One of the substantial problems associated with this formulation is that the ethanol:cremophor vehicle is toxic [4-7]. The primary goal of formulation development for paclitaxel is to eliminate the cremophor vehicle and also to provide the possibility of improving the efficacy of paclitaxel based anticancer therapy. One of the major obstacles in designing the formulation of novel drugs is their limited aqueous solubility. This problem can be overcome by entrapping the drug in vesicular structures like liposomes. Liposomes that can be triggered to release their contents or fuse in response to pH stimuli are of particular interest in cancer therapy as they can potentially respond to acidic environments in vivo [8].
However, successful development of these systems requires careful consideration of a number of factors influencing the performance of the formulation, including the physicochemical properties of the raw materials (both drug and excipients), the composition and the component’s relative amounts in the formulations, as well as the manufacturing process parameters. Many experiments fail in their purpose because they are not properly thought out and designed, and even the best data analysis cannot compensate for lack of planning. Experimental design is thus the preferred strategy, especially when complex formulations, such as liposomes, are to be developed [9]. In particular, the multi-varied strategy of experimental design allows simultaneous investigation of the effects of several variables, as well as their actual significance on the considered response and possible interrelationship among them, giving the maximum information with minimum number of experiments [10,11]. Traditional experiments require more effort, time, and materials when a complex formulation needs to be developed. Various experimental designs [12-15] are useful in developing a formulation requiring less experimentation and providing estimates of the relative significance of different variables. In the work reported here, Box-Behnken design was used to optimize pH-sensitive liposomes containing paclitaxel. Independent variables selected were molar ratio of phosphatidylcholine: diolylphosphatidylethanolamine (PC:DOPE) (X1), moles of cholesterylhemisuccinate (CHEMS) (X2), and the amount of drug (X3) to evaluate their separate and combined effects on percent drug entrapment (PDE), pH-sensitivity, and vesicle size expressed as the average vesicle perimeter (AVP). Liposomes are of interest from a technical viewpoint and allow a wider scope to study the influence of various formulation variables, hence liposomes need to be optimized for desired response. In the present study thin film hydration method was used for the preparation and optimization of paclitaxel liposomes as this method is simple and capable of producing small vesicles.
Materials and Methods
Paclitaxel was received as a gift sample from Naprod life sciences, Mumbai. Phosphatidylcholine (PC) was received as a gift sample from Phospholipid GmbH, Nattermannalle, Germany. Cholesteryl hemisuccinate (CHEMS) was received as a generous gift from Merk Eprova AG Switzerland. Dioleoyl phosphatidylethanolamime (DOPE) was received as a gift sample from Lipoid GmbH, Germany. HPLC grade solvents and other chemicals were purchased from local supplier.
Box–Behnken experimental design
A Box–Behnken optimization design with three variables was applied to find the optimum conditions and to analyze how sensitive the responses were to variations in the settings of the experimental variables [16]. This design is a factorial design with three levels, using middle points instead of corner points and is useful for estimating the coefficients in a second degree polynomial. A total of 15 experiments were performed including triplicates of the center point. The center points improve the assessment of the response surface curvature and simplify the estimation of the model error. The traditional approach to develop a formulation is to change one variable at a time. It is difficult to develop an optimized formulation, as the method reveals nothing about the interactions among the variables. Hence, a Box–Behnken statistical design with three factors, three levels was selected for the optimization study. The dependent and independent variables are listed in Table 1. The polynomial equation generated by this experimental design (Instat + software) is as follows:
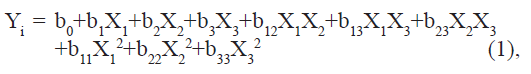
Where Yi is the dependent variable; b0 is the intercept; b1 to b33 are regression coefficients: and X1, X2 and X3 are the independent variable selected from the preliminary experiments.
| Levels | |||
|---|---|---|---|
| Low | Medium | High | |
| Independent variables | |||
| X1=Molar ratio of PC: DOPE | 8:2 | 6:4 | 4:6 |
| X2=Molar concentration of CHEMS | 2 | 4 | 6 |
| X3=Amount of drug | 2.8 mg | 5.6 mg | 8.4 mg |
| Transformed values | –1 | 0 | 1 |
| Dependent variables | |||
| Y1=Percent drug entrapment | |||
| Y2=Vesicle size | |||
| Y3=pH‑sensitivity |
DOPE=Dioleoyl phosphatidylethanolamime
Table 1: Variables And Their Levels In Box-Behnken Design
Preparation of liposomes
Liposomes were prepared by the thin film hydration method. Paclitaxel and the required quantities of CHEMS, Phospholipon 90G, and DOPE were dissolved in chloroform. All the batches were prepared according to the experimental design in Table 2. Chloroform was evaporated using rotary vacuum evaporator and kept overnight under vacuum. Nitrogen gas was passed over the thin film. Then it was hydrated with 5% dextrose solution, above the phase transition temperature of lipids, using glass beads. The suspension of liposomes was sonicated to reduce the size of liposomes. This was transferred to vials and stored at 4° [17].
| Batch no. | X1 | X2 | X3 | Y1 (PDE±SD)* | Y2(µm) | Y3 (%) |
|---|---|---|---|---|---|---|
| 1 | 0 | –1 | –1 | 84.1±0.68 | 6.4 | 70.69 |
| 2 | 0 | –1 | 1 | 80.31±1.17 | 6.9 | 73.27 |
| 3 | 0 | 1 | –1 | 82.26±1.54 | 2.6 | 81.00 |
| 4 | 0 | 1 | 1 | 79.7±1.23 | 2.7 | 79.56 |
| 5 | –1 | 0 | –1 | 85.52±1.92 | 6.2 | 60.43 |
| 6 | –1 | 0 | 1 | 78.22±0.86 | 3.8 | 65.30 |
| 7 | 1 | 0 | –1 | 92±1.41 | 4.4 | 83.12 |
| 8 | 1 | 0 | 1 | 89.64±1.52 | 4 | 85.11 |
| 9 | –1 | –1 | 0 | 84.04±1.87 | 6.3 | 66.91 |
| 10 | –1 | 1 | 0 | 80.62±2.12 | 3.3 | 75.14 |
| 11 | 1 | –1 | 0 | 94.68±0.98 | 6.5 | 79.87 |
| 12 | 1 | 1 | 0 | 88.73±1.28 | 2.4 | 94.77 |
| 13 | 0 | 0 | 0 | 90.37±1.04 | 4 | 86.07 |
| 14 | 0 | 0 | 0 | 91.14±1.59 | 3.8 | 88.90 |
| 15 | 0 | 0 | 0 | 92.53±1.33 | 4.1 | 85.18 |
PDE=Percent drug entrapment, n=3, Y2=average vesicular size in μm, Y3=percent drug release
Table 2: Box‑Behnken Experimental Design With Measured Responses
Microscopy
The liposomes were mounted on glass slides and viewed under a microscope (Motic) for morphological observation after suitable dilution. Particle size was measured as average object perimeter.
Percent drug entrapment
The amount of paclitaxel incorporated in liposomes was determined using HPLC (Perkin Elmer). Five hundred microliter of liposomal suspension was diluted with water and acetonitrile to 1 ml. Extraction of paclitaxel was accomplished by adding 4 ml of tert-butylmethyl ether, vortex mixing for 1 min, and centrifuging the mixture for 15 min. Three milliliter of the organic layer was separated and evaporated to dryness. Residue was reconstituted with 1 ml methanol. Twenty microliter of the above solution was injected into a C18 column, 5 µm. The column was eluted with acetonitrile/water (60/40). The drug was estimated by UV absorption measurement at 227 nm (flow rate 1 ml/min) [18,19].
In vitro release from pH-sensitive liposomes
Liposomal formulations were diluted with phosphate buffer pH 5 in 1:2 ratios, and incubated at 37° for 15 min. The drug released was separated from liposomal paclitaxel, extracted, and quantified using the same procedure described above for the determination of incorporated drug.
Checkpoint analysis
A checkpoint analysis was performed to confirm the role of the derived polynomial equation and contour plots in predicting the responses. Values of independent variables were taken at three points, one from each contour plot, and the theoretical values of PDE were calculated by substituting the values in the polynomial equation. Liposomes were prepared experimentally at three checkpoints, and evaluated for the responses.
Optimum formula
After developing the polynomial equations for the responses PDE, AVP, and pH sensitivity with the independent variables, the formulation was optimized for the response PDE. Optimization was performed to find out the level of independent variables (X1, X2, and X3) that would yield a maximum value of PDE with constraints on AVP and pH sensitivity.
Results and Discussion
Liposomes were observed under a microscope to examine their morphology and were observed to be mostly spherical, with a few being slightly elongated. A Box–Behnken experimental design with three independent variables at three different levels was used to study the effects on dependent variables. All the batches of liposomes within the experimental design were evaluated for PDE, pH sensitivity, and vesicle size. A Box–Behnken experimental design has the advantage of requiring fewer experiments (15 batches) than would a full factorial design (27 batches). Transformed values of all the batches along with their results are shown in Table 2. Formulations 7, 12, 13, 14, and 15 had the highest PDE (>90%). Table 3 shows the observed and predicted values with residuals and percent error of responses for all the batches.
| Batch no. | Observed PDE | Predicted PDE | Residuals | %Error |
|---|---|---|---|---|
| 1 | 84.1 | 85.169 | –1.069 | 1.27 |
| 2 | 80.31 | 81.167 | –0.857 | 1.07 |
| 3 | 82.26 | 82.213 | 0.047 | 0.06 |
| 4 | 79.7 | 78.211 | 1.489 | 1.87 |
| 5 | 85.52 | 83.667 | 1.853 | 2.17 |
| 6 | 78.22 | 79.665 | –1.445 | 1.85 |
| 7 | 92 | 92.829 | –0.829 | 0.90 |
| 8 | 89.64 | 88.827 | 0.813 | 0.91 |
| 9 | 84.04 | 83.817 | 0.223 | 0.27 |
| 10 | 80.62 | 80.861 | –0.241 | 0.30 |
| 11 | 94.68 | 92.979 | 1.701 | 1.80 |
| 12 | 88.73 | 90.023 | –1.293 | 1.46 |
| 13 | 90.37 | 91.477 | –1.107 | 1.22 |
| 14 | 91.14 | 91.477 | –0.337 | 0.37 |
| 15 | 92.53 | 91.477 | 1.053 | 1.14 |
PDE=Percent drug entrapment
Table 3: Observed And Predicted Values With Residuals Of The Response Y1(Pde)*
The PDE (dependent variable) obtained at various levels of the three independent variables (X1, X2, and X3) was subjected to multiple regression to yield a second-order polynomial equation (full model):
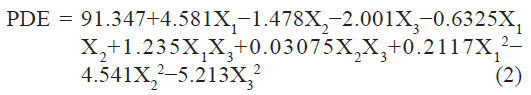
The value of the correlation coefficient (r2) of Eqn. 2 was found to be 0.9755, indicating good fit. The PDE values measured for the different batches showed wide variation (i.e., values ranged from a minimum of 79.7 to a maximum of 94.68). The results clearly indicate that the PDE value is strongly affected by the variables selected for the study. This is also reflected by the wide range of values for coefficients of the terms of Eqn 2. The main effects of X1, X2, and X3 represent the average result of changing one variable at a time from its low level to its high level. The interaction terms (X1X2, X1X3, X2X3, X12, X22, and X3 2) show how the PDE changes when two variables are simultaneously changed. Positive coefficient of X1 (molar ratio of PL 90 and DOPE) indicate favorable effect on PDE, while the negative coefficient of X2 and X3 indicate unfavorable effect on PDE. Among the three independent variables the lowest coefficient value is for X2 (b2 = –1.478) indicating that this variable is not significant in predicting PDE.
The standardized effect of the independent variables and their interaction on the dependent variable was investigated by preparing a pareto chart (fig. 1) which depicts the main effect of the independent variables and interactions with their relative significance on the PDE. The length of each bar in the chart indicates the standardized effect of that factor on the response. The fact that the bar for X1X2, X1X3, X2X3, and X12 remains inside the reference line in fig. 1 and the small coefficients for these terms in Eqn. 2 indicate that these terms contribute the least in prediction of PDE. Hence, these terms are omitted from the full model to obtain a reduced second-order polynomial equation (equation 3) by multiple regressions of the PDE and the significant terms (P<0.05) of Eqn. 2:
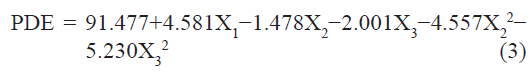
To confirm the omission of nonsignificant terms, F statistic was calculated after applying analysis of variance for the full model and the reduced model (Table 4). The F calculated value (1.04) is less than the tabled value of F (4.95) at a 0.05 confidence interval. Hence, it is concluded that the omitted terms do not significantly contribute to predicting the PDE. This implies that the main effect of the amount of drug and the molar ratio of phospholipids is significant, as is evident from their high coefficients and the fact that the bars corresponding to variables X1, X2, X3, X22, X32 extend beyond the reference line in fig. 1.
| ANOVA | Df | SS | MS | F value | P value |
|---|---|---|---|---|---|
| Regression | |||||
| A | 9 | 392.575 | 43.619 | 22.16 | 0.0016 |
| B | 5 | 384.33 | 76.866 | 38.25 | 0.0000 |
| Residuals | |||||
| A | 5 | 9.842 (C1) | 1.9685 (D1) | ||
| B | 9 | 18.087 (C2) | 2.0097 |
ANOVA indicates analysis of variance; PDE, percent drug entrapment; A, full model; B, reduced model; Df, degrees of freedom; SS, sum of squares; MS, mean of squares; F, Fischers ratio. FCAL = [(C2-C1)/NTO]/D1 = 1.040, where NTO is the number of terms omitted (having a P value more than 0.05)
Table 4: Results Of Anova of Full And Reduced Models for PDE of Paclitaxel in Liposomes

Fig. 1: Pareto chart.
Pareto chart showing the standardized effect of independent
variables and their interaction on the percent drug entrapment of
liposomes.
Vesicle size of liposome batches, measured by using microscopy (Motic), was found to be in the range of 2.4 to 6.9 µm. A polynomial equation was also developed for AVP which is given as
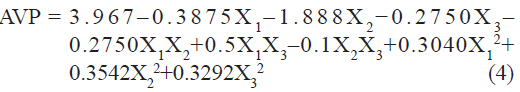
The value of correlation coefficient (r2) of Eqn. 4 was found to be 0.9499 indicating good fit. Among the independent variables selected and their interactions only X2 was found to be significant (P<0.05), indicating a major contributing effect of X2 on AVP. A negative value of the coefficient for X2 (molar concentration of CHEMS) indicates a favorable effect on AVP. Vesicles obtained at high molar concentration of CHEMS are smaller than are those obtained at low molar concentration of CHEMS. CHEMS improves the fluidity of bilayer membrane. The smaller size of vesicles may result from this property of CHEMS. The effect of CHEMS on the liposome bilayer structure can be mainly ascribed to its charge inducing properties and presumably to a minor extent to its molecular geometry, or to a combination of both.
pH sensitivity (Y3) of liposomes measured as % drug release at pH 5 was found to be in the range of 60.43 to 94.77%. A polynomial equation was developed for % drug release:
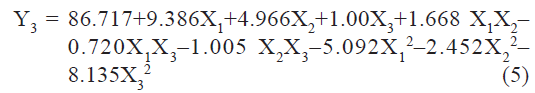
The value of correlation coefficient (r2) of Eqn. 5 was found to be 0.9799 indicating good fit. Among the independent variables selected X1, and X2, X12, and X32 were found to be significant (P<0.05), indicating a major contributing effect of molar ratio of phospholipids and CHEMS on pH sensitivity of liposomes. The positive values of coefficients for X1 and X2 indicate a favorable effect on pH sensitivity. Liposomes with high level of DOPE and CHEMS exhibit good pH sensitivity.
The three replicated center points in the Box–Behnken experimental design made it possible to assess the pure error of the experiments and enabled the model’s lack of fit to be checked. In this study, the model was checked for lack of fit for all the three responses. For lack of fit (F test) P values obtained were 0.969, 0.949, 0.909 for Y1, Y2 and Y3, respectively, and hence the current model provided a good fit to the data (P>0.05) and had no lack of fit.
The relationship between the dependent and independent variables was further elucidated by constructing contour plots. The effects of X1 and X3 with their interaction on PDE at a fixed level of X2 (medium level) are shown in fig. 2. The plots were found to be linear up to 97% PDE, indicating the linear relationship between X1 and X3. It was determined from the contour plot that a higher value of PDE (97%) could be obtained with an X1 level range from 0.8 to 1, and an X3 level range from –0.5 to -1. It is evident from the contour that the low level of X3, and the high level of X1 favors PDE of liposomes. PC is present in a lower proportion at the high level of X1, and therefore it is evident that PC decreases the entrapment efficiency. When the coefficient values of two key variables, X1 and X3, were compared, the value for variable X1 (b2=4.581) was found to be higher, indicating that it contributes the most to predict the PDE. Fig. 3 shows the contour plot drawn at 0 level of X3. The contours of all PDE values were found to be curvilinear and indicated that a high value of PDE (96%) can be obtained for a combination of two independent variables, X1 level 1 and X2 level in the range of -0.06 to -0.245, indicating that CHEMS decreases PDE. Similarly, fig. 4 shows the contour plot at 0 level of X1. The plot is found to be curvilinear up to 91% PDE, but above this value, the plots were found to be nonlinear indicating a nonlinear relationship between X2 and X3. This may be due to the interaction between X2 and X3. High value of PDE could be obtained with an X2 level range of -0.25 to 0.99 and an X3 level range of 1 to -0.14. All the contour plots for the high value of PDE were found to be nonlinear. This signifies that there is no direct linear relationship among the selected independent variables. A high value of PDE can be obtained up to a certain level of all three independent variables, but above this an increase in the level of independent variables leads to a decrease in the PDE of liposomes.

Fig. 2: Contour plot of X1 and X3. Contour plot showing the effect of molar ratio of PC: DOPE (X1), and amount of drug added (X3) on the percent drug entrapment of liposomes.

Fig. 3: Contour plot of X1 and X2. Contour plot showing the effect of molar ratio of PC: DOPE (X1), and molar concentration of CHEMS (X2) on the percent drug entrapment of liposomes.

Fig. 4: Contour plot of X2 and X3. Contour plot showing the effect of molar concentration of CHEMS (X2) and amount of drug added (X3) on the percent drug entrapment of liposomes.
Three checkpoint batches were prepared and evaluated for PDE, as shown in Table 5. Results indicate that the measured PDE values were as expected. When measured PDE values were compared with predicted PDE values using student t-test, the differences were found to be insignificant (P>0.05) indicating that the obtained mathematical equation is valid for predicting the PDE.
| Batch no. | X1 | X2 | X3 | PDE | |
|---|---|---|---|---|---|
| Measured | Predicted | ||||
| 16 | 0 | –0.5 | 0.5 | 87.92 | 88.76 |
| 17 | 0.5 | 0 | –0.5 | 91.7 | 93.46 |
| 18 | –0.5 | 0.5 | 0 | 89.15 | 87.31 |
PDE = Percent drug entrapment
Table 5: Checkpoint Batches with their Predicted and Measured Value of PDE
After studying the effect of the independent variables on the responses, the levels of these variables that give the optimum response were determined. It is evident from the polynomial equation and contour plots that CHEMS decreases the PDE within liposomes. Also CHEMS is known to abolish the gel-to-liquid phase transition of liposomes and the resulting liposomes are less leaky. Hence, medium level was selected as optimum for the molar concentration of CHEMS (X2), as up to this level high value of PDE can be obtained. The optimum formulation is one that gives a high value of PDE (=91%), high pH sensitivity and a low AVP (=4 µm) along with a high total amount of drug entrapped and low amount of carrier in the resultant liposomes. Using a computer optimization process and the contour plot shown in fig. 3, for X1 the level of 0.99, for X2 level of –0.06 which gives the theoretical values of 96.08% PDE, 90.61% release, and 3.58 µm AVP were selected. A decrease in the level of amount of drug (X3) below the selected level leads to a decrease in the total amount of entrapped drug and increase in the level above the selected level leads to low entrapment efficiency. Hence, a 0 level of the amount of drug was selected as optimum. For confirmation, a fresh formulation was prepared at the optimum levels of the independent variables, and evaluated for responses. The observed values of PDE, % release and AVP were found to be 94.37%, 89.6% and 3.24 µm, respectively, which were in close agreement with the theoretical values.
Multicomponent liposomal formulations may include more factors during their preparation, making the interpretation of the system extremely complicated. In order for all the factors to be used at their optimal level and the best responses to be achieved, a lot of experiments must be performed, including all the possible combinations between the different factors. The use of fractional factorial design as described in the present study, can decrease the number of experiments, give useful conclusions for the main effects and interactions between the examined factors, and clarify complicated interactions through graphical presentations.
Acknowledgements
Authors thank Naprod Life Sciences, Mumbai, for the gift sample of paclitaxel, Phospholipid GmbH, Nattermannalle, Germany for Phospholipon 90G, Merk Eprova AG Switzerland for CHEMS, Lipoid GmbH, Germany for DOPE.
References
- Appendino G. Taxol® (Paclitaxel): Historical and Ecological aspects. Fitoterapia 1993;45:5-27.
- Chervinsky DS, Brecher ML, Hoelcle MJ. Cremophor EL enhances taxol efficacy in a multidrug resistant C1300 nuroblastoma cell line. Anticancer Res 1993;13:93-6.
- Webster L, Linsenmeyer M, Millward M, Morton C, Bishop J, Woodcock D. Measurement of cremophor EL following taxol: Plasma levels sufficient to reverse drug exclusion mediated by the multidrug resistant phenotype. J Natl Cancer Inst 1993;85:1685-90.
- Fjallskog ML, Frii L, Bergh J. Is cremophor, solvent for paclitaxel, cytotoxic? Lancet 1993;342:873.
- Rowinsky EK, Eisenhauer EA, Chaudry V, Arbuck SG, Donehower RC, Bishop J, et al. Clinical toxicities encountered with paclitaxel (Taxol). SeminOncol 1993;20:1-15.
- Dorr RT. Pharmacology and toxicology of Cremophor EL diluent. Ann Pharmacother 1994;28:S11-4.
- Goldspiel BR. Pharmaceutical issues: Preparation, administration, stability, and compatibility with other medications. Ann Pharmacother 1994;28:S23-6.
- Karanth H, Murthy RS. pH-sensitive liposomes-principle and application in cancer therapy. J Pharm Pharmacol 2007;59:469-83.
- Lewis GA, Mathieu D, Phan-Tan-Luu R. Pharmaceutical Experimental Design. New York: Marcel Dekker; 1999.
- Sanchez-Lafuente C, Furlanetto S, Fernandez-Arevalo M, Alvarez-Fuentes J, Rabasco AM, Faucci MT, et al. Didanosine extended-release matrix tablets: Optimization of formulation variables using statistical experimental design. Int J Pharm 2002;237:107-18.
- Mura P, Furlanetto S, Cirri M, Maestrelli F, Marras AM, Pinzauti S. Optimization of glybenclamide tablet composition through the combined use of Differential Scanning Calorimetry and D-optimal mixture design. J Pharm Biomed Anal 2005;37:65-71.
- Gohel MC, Amin AF. Formulation optimization of controlled release diclofenac sodium microspheres using factorial design. J Control Release 1998;51:115-22.
- Nazzal S, Khan MA. Response surface methodology for the optimization of ubiquinone self-nanoemulsified drug delivery system. AAPS PharmSciTech 2002;3:23-31.
- Li S, Lin S, Chien YW, Daggy BP, Mirchandani HL. Statistical optimization of gastric floating system for oral controlled delivery of calcium. AAPS PharmSciTech 2001;2:11-22.
- Solanki AB, Parikh JR, Parikh RH. Formulation and optimization of piroxicamproniosomes by 3-factor, 3 level Box-Behnken Design. AAPS PharmSciTech 2007;8:43-9.
- Box GE, Behnken DW. Some new three level designs for the study of quantitative variables. Technometrics 1960;2:455-75.
- Crosasso P, Ceruti M, Brusa P, Arpicco S, Dosio F, Cattel L. Preparation, characterization and properties of sterically stabilized paclitaxel containing liposomes. J Control Release 2000;63:19-30.
- Dosio F, Brusa P, Crosasso P, Arpicco S, Cattel L. Preparation, characterization and properties in vitro and in vivo of a paclitaxel– albumin conjugate. J Control Release 1997;47:293-304.
- Sharma A, Conway WD, Straubinger RM. Reversed-phase high-performance liquid chromatographic determination of taxol in mouse plasma. J Chromatogr B Biomed Appl 1994;655:315-9.


