- *Corresponding Author:
- Jaya Dwivedi
Department of Chemistry,
Banasthali Vidyapith,
Banasthali,
Rajasthan
304022,
India
E-mail: jayadwivedi1203@gmail.com
| Date of Received | 20 June 2020 |
| Date of Revision | 03 July 2021 |
| Date of Acceptance | 01 December 2021 |
| Indian J Pharm Sci 2021;83(6):1261-1272 |
This is an open access article distributed under the terms of the Creative Commons Attribution-NonCommercial-ShareAlike 3.0 License, which allows others to remix, tweak, and build upon the work non-commercially, as long as the author is credited and the new creations are licensed under the identical terms
Abstract
The current study was designed to conduct the physicochemical, phytochemical and gas chromatography- mass spectrometry analysis of Chenopodium album and Stellaria media L. Methanolic extract of dried leaves of Chenopodium album and Stellaria media was prepared and subsequently fractionated using different solvents like hexane, chloroform, ethyl acetate. Obtained plant fractions were analyzed for the presence of different secondary metabolites using phytochemical screening methods. Further, total phenolic content, total flavonoid content and total alkaloid content in different plant fractions were also estimated employing Ultraviolet-visible spectrophotometric methods. Results of phytochemical analysis revealed the presence of different secondary metabolites including flavonoids, phenols, alkaloids, tannins, glycosides and saponin. Further, gas chromatography-mass spectrometry analysis indicated presence of total 30 and 31 phytoconstituents in hexane and ethyl acetate fractions of methanolic extract of Chenopodium album respectively whereas chloroform and ethyl acetate fractions of methanolic extract of Stellaria media showed presence of total 33 and 35 phytoconstituents respectively. Gas chromatography-mass spectrometry chromatogram showed abundance of polyphenolic compounds (85 % Phenol-2,4-bis(1,1-dimethylethyl), phosphite (3:1) in hexane fractions of Chenopodium album, long-chain fatty acids (51 % hexadecanoic acid, methyl ester in chloroform fractions of Chenopodium album), higher alkanes (66 % Octasiloxane- 1,1,3,3,5,5,7,7,9,9,11,11,13,13,15,15-hexadecamethyl in ethyl acetate fractions of Chenopodium album ). Outcome of the study would certainly assist the investigators to explore these plants and to identify and develop new leads for the treatment of different pathological conditions.
Keywords
Gas chromatography-mass spectrometry, Chenopodium album, Stellaria media, flavonoids, phenols, alkaloids, tannins, glycosides, saponins
Globally 80 % population of human utilizes herbal medicines in developing countries for addressing general health issues. Comparatively, lesser side effects with cultural acceptability, impressive efficacy, safety and better compatibility with the human body make them more beneficial for clinical usage. Ancient literatures also indicate the use of herbal medicines for almost all types of disease like diabetes, loss of memory, wounds, osteoporosis, liver problems and immune disorders etc.,[1-3].
Morphine, aspirin, digoxin, emetine and ephedrine are medicinal components derived from plants and are widely used in modern therapeutics to manage various diseases. According to Namdeo et al. about 25 % of all prescription in developed countries includes ingredients that are directly or indirectly derived from natural resources, chiefly plants [4].
Plant species belonging to the family Caryophyllaceae are utilized mainly by numerous ethical communities as traditional medicine in different regions across the globe, particularly in traditional Chinese medicine system. The ethnopharmacological reports on Caryophyllaceae, indicates that plants of this family exhibit antibacterial, antiviral, anticancer, antifungal, antioxidant and anti- inflammatory properties[5]. Similarly, plants from Chenopodiaceae family are widely utilized in the management of different diseases of blood, spleen, heart and eye, biliousness condition, abdominal pain, cough, nervous infections and pulmonary obstruction[6]. In addition, these plants have shown contraceptive efficacy with sperm-immobilizing potential in several individuals[7]
Stellaria media (S. media) Linn (Caryophyllaceae) or chickweed is a winter annual herb [8]. It is a member of the Caryophyllaceae family, categorized as an intrusive weed which can easily grows in grounds, field and gardens [9]. This plant is rich in gamma-linolenic acid, vitamin A, B1, B2, B3, C, E, rutin, mineral compounds and secondary metabolites like phenolic compounds and flavonoids phlobatannins, saponins and alkaloids [10]. Various phytoconstituents reported in the plant includes flavonoids, phenolic acids [11], C-glycosyl flavones [12], triterpenoid saponins [13], pentasaccharide [14], lipids [15]. Traditionally, the plant is utilized as tonic, laxative, demulcent, diuretic and expectorant. The medicinal value of this plant has been reported in the management of inflammations in renal, reproductive, digestive and respiratory tracts, mental tension, itchy skin conditions and in plasters for broken bones [16-18].
Chenopodium album (C. album) Linn (Chenopodiaceae) or pigweed is commonly known as Goosefoot, Bathua, pigweed or lamb-quarters. It is a member of Chenopodiaceae family, which is widely cultivated in different parts across the world. It is widely consumed by the people in the form of vegetable. This plant has been reported for the presence of alkaloids, chinoalbicin, cinnamic acid amide, flavonoids, phenols and terpenes [19]. It has been used as an anticancer, antibacterial, sperm immobilizer, antioxidant, antimicrobial and anti-inflammatory agent [20].
In the last decade, Gas Chromatography-Mass Spectrometry (GC-MS) has been acknowledged as more popular and reliable platform for profiling various secondary metabolites available in varying plant species. An exhaustive literature survey revealed that these plant species are of ethnomedicinal importance and requires immediate exploration for their scientific validation to uncover their therapeutic potential in different ailments. It is noteworthy that there is not a single report available pertaining to GC-MS profiling to recognize key bioactive constituents present in these plants. These facts aroused our interest to explore the presence of possible bioactive chemical constituents present in hexane, chloroform and ethyl acetate fractions prepared from methanolic extract of C. album and S. media through GC-MS screening. The findings of the present study indicated that the plants S. media and C. album contains several bioactive compounds that may be attributed to their therapeutic potential in the management of various diseases. Outcome of the study would certainly assist the investigators to explore these plants and to identify and develop new leads for the treatment of different pathological conditions.
Materials and Methods
Identification and collection of plant material:
Fresh S. media and C. album plants were collected from different places of Greater Noida and Agra, India, in January 2019. The plant was authenticated by Dr. Afroz Alam (botanist and herbarium curator), Department of Bioscience and Biotechnology, Banasthali Vidyapith, Rajasthan, India (voucher specimen No. BURI- 19408/2019 and BURI-190407/2019). The air-dried leaves were powdered and stored carefully in a vacuum container.
Physicochemical evaluation of plant extracts:
The standard protocols enlisted in World Health Organization (WHO) guidelines and Indian Pharmacopoeia was employed for the determination of different physicochemical parameters in plant extracts [21,22].
Estimation of loss on drying:
Approximately, 10 g of plant material was taken in a tared dish. Then, it was kept at 105° for complete drying till 3 h and then weighed again. After half an hour interval, the extract was dried and weighed till the variation between two sequential weighing corresponds should not exceed to 0.25 %.
Estimation of total ash value:
Around 2 g of crude sample was transferred in a pre- weighed silica crucible. The powder was kept in a muffle furnace (Daihan Labtech co. LTD. Korea) at temperature not more than 550° and converted into ash via incineration. After cooling, silica crucible containing ash was weighed. Repetitive sessions of the process were made until a constant weight was attained. Ash content in percentage (%) was calculated by dividing obtained ash weight to the weight of original crude sample.
Estimation of water-soluble extractive value:
The ash converted from crude sample was placed in a beaker and then boiled with approximately 25 ml water for 15 min. After boiling, insoluble matter was taken in an ashless filter paper and its washing was done by hot water. Ash containing filter paper was placed in a silica crucible and then kept in a muffle furnace for incineration at temperature not more than 450°. Further, water soluble ash kept in silica crucible was cooled and then weighed. Water soluble ash value (%) was calculated with reference to dried crude material.
Estimation of acid insoluble ash value:
Acid insoluble ash value was determined by gently boiling ash contained in the crucible with approximately 25 ml Hydrochloric Acid (HCl) solution containing mixture of 15 ml water and 10 ml HCl for 10 min. After boiling, insoluble matter was taken in an ashless filter paper and its washing was done with hot water till filtrate get neutralized. Further, filter paper with insoluble matter was kept in a crucible and then placed in a hot plate for complete drying till a constant weight was achieved. After drying, crucible containing acid insoluble ash was cooled and then weighed. Acid insoluble ash value (%) was calculated with reference to dried crude material.
Estimation of alcohol soluble extractive value:
Around 5 g of pulverized leaves were taken in 250 ml conical flask and dissolved with 90 % ethanol. Then, the flask was placed in a mechanical shaker for continuous stirring for 6 h and then allowed to keep in a still position for 18 h. After that, the solution was filtered and the obtained filtrate was kept in a pre-weighed crucible and allowed to evaporate at 100° for complete drying. Further, final weight of dried residue was recorded and total weight of residue was determined by subtracting initial weight of crucible before residue. Alcohol soluble extractive value was calculated with reference to dried crude material.
Preparation of methanolic extracts and various fractions of S. media and C. album:
Dried leaves of S. media and C. album were taken, crushed and finally powdered. An amount of 100 g leaves powder of the plants was extracted with methanol (90 %) by using a hot extraction method for 8 complete cycles. After extraction, the solvent was filtered and subsequently placed in a rotary evaporator to obtain Methanol Crude Extract of S. media (MESM) and Methanol Crude Extract of C. album (MECA). Further, Ethyl Acetate (EAFSM) and Chloroform (CFSM) fractions were prepared from methanolic extract of S. media. Similarly, Ethyl Acetate (EAFCA) and Hexane (HFCA) fractions were prepared from methanolic extract of C. album respectively. These fractions were evaporated and dried at 40° employing rotary vacuum evaporator (Heidolph Instruments GmbH & Co. KG Germany). The dried fractions were weighed and their percentage yield was calculated, later on the fractions undergo different chemical evaluations for the detection of various secondary metabolites [23].
Phytochemical analysis:
The crude methanolic extracts and various fractions of S. media (MESM, EAFSM, CFSM) and C. album (MECA, EAFCA, HFCA) were subjected to preliminary phytochemical evaluations for the presence of different secondary metabolites including alkaloids, steroids, phenols, flavonoids, steroids, terpenoids, saponins, fats, oils and saponins employing standard protocols [24]
Estimation of Total Flavonoid Content (TFC):
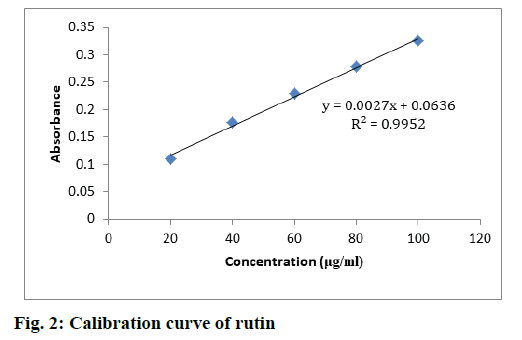
Aluminium chloride colorimetric method was used for the determination of TFC in extracts and fractions prepared from MESM and MECA. Approximately, 3 ml methanol was added in the test samples followed by the addition of 0.2 ml from 10 % aluminium chloride and 0.2 ml from 1 M potassium acetate and then final volume was make up with 5.6 ml distilled water. Further, the reaction mixture was incubated for 30 min at room temperature. After incubation, absorbance of each test sample was recorded in triplicates at 415 nm using Ultraviolet-Visible (UV-Vis) spectrophotometer (Shimadzu Scientific Instruments, Inc.). Rutin was taken as a standard and the results were evaluated as rutin equivalent (RU, mg/100 g) of extract [25,26].
Estimation of Total Phenolic Content (TPC):
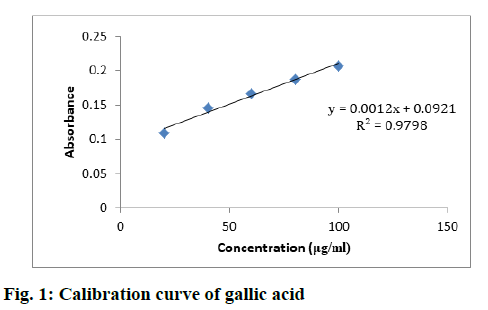
Folin Ciocalteu method was employed for the determination of TPC in extracts and fractions prepared from MESM and MECA. The reaction was initiated by mixing 1 ml test samples with 1.5 ml Folin’s reagent and then kept stored for 5 min at room temperature. To this, 4 ml from 20 % sodium carbonate solution was added followed by the addition of distilled water. The reaction was then incubated for 30 min at room temperature. After the reaction was completed, absorbance of each test sample was recorded spectrophotometrically in triplicates at 765 nm using gallic acid as a standard.
TPC was evaluated as milligrams (mg) Gallic Acid Equivalent (GAE)/100 g dry extract [27,28].
Estimation of Total Alkaloid Content (TAC):
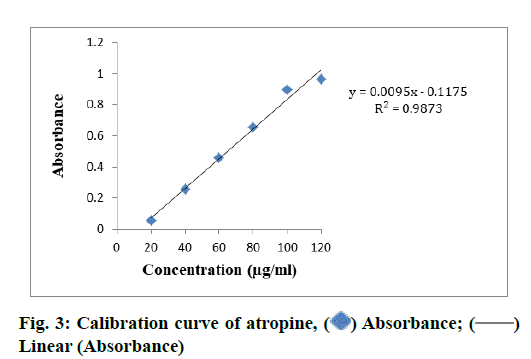
TAC in extracts and fractions prepared from MESM and MECA were determined by dissolving 1 ml test samples with 2 N HCl solution. Further, 1 ml from the reaction mixture was taken and placed in a test tube and adjusted to neutral pH with 0.1 N sodium hydroxide. To this, 5 ml solution of bromocresol green was added followed by the addition of 5 ml phosphate buffer. Serial dilutions of atropine (standard) (20, 40, 60, 80 and 100 μg/ml) were prepared and the absorbance of each test sample and standard was recorded spectrophotometrically in triplicates at 470 nm. TAC was evaluated as milligrams (mg) Atropine Equivalent (AE)/100 g dry extract [28-30].
GC-MS analysis:
GC-MS analysis of the active fraction was carried out using Thermofisher scientific, USA, Model-GC- Trace 1300 GC-MS-TXQ.8000 with triple quadrupole autosampler-AI/AS 1310 and column-TG-5 MS (silica column) and temperature 330-350° [31,32].
Results and Discussion
Physicochemical variables such as ash value, moisture content and extractive values are evaluated to identify the presence of any adulterant and improper drug handling. C. album exhibited high moisture content in the present investigation compared to S. media (Table 1). Low moisture content in S. media could prevent microbial growth in the plant. Total ash value specifies availability of earthy materials and minerals in the plant. Results of total ash value indicate that S. media was found to contain high inorganic content compared to C. album. The acid insoluble ash for S. media and C. album was found to be 9.23±0.41 and 8.25±0.33 % w/w, respectively (Table 1). Similarly, water-soluble ash content in S. media was found as 5.34±0.06 % w/w,whereas 3.81±0.14 % w/w was recorded in C. album, respectively. The extractive values indicate soluble contents available in the plant/plant part. The alcohol soluble extractive value of S. media and C. album was 16.32±1.21 % w/w and 14.20±0.78 % w/w, respectively. The results advocated that S. media contain high extractive values when compared to C. album.
| S. No | Physicochemical constants | S. media(% w/w) | C. album (% w/w) |
|---|---|---|---|
| 1 | Loss on drying | 6.80±0.59 | 9.5±0.34 |
| 2 | Total ash | 13. 48±0.36 | 9.75±0.19 |
| 3 | Acid insoluble ash | 9.23±0.41 | 8.25±0.33 |
| 4 | Water soluble ash | 5.34±0.06 | 3.81±0.14 |
| 5 | Alcohol soluble extractive | 16.32±1.21 | 14.20±0.78 |
Table 1: Physicochemical Parameters of S. media and C. album Leaves
The crude methanolic extract (MESM and MECA) were prepared by hot extraction method and MESM and was further fractionated into CFSM and EAFSM. Similarly, MECA was further fractionated into HFCA and EAFCA and their percentage yield was determined. The results exhibited maximum percentage yield in MESM and MECA, i.e., 18.75±0.46 and 16.95±0.78 % w/w, respectively (Table 2). Similarly, EAFSM exhibited a high percentage yield when compared to EAFCA. The percentage yield of chloroform fraction of S. media and hexane fraction of C. album was 5.67±0.24 and 8.36±0.67 % w/w respectively (Table 2).
| S. no. | Extract/Fraction | % Yield |
|---|---|---|
| 1 | MESM | 18.75±0.46 |
| 2 | CFSM | 5.67±0.24 |
| 3 | EAFSM | 7.45±0.31 |
| 4 | MECA | 16.95±0.78 |
| 5 | HFCA | 8.36±0.67 |
| 6 | EAFCA | 4.83±0.17 |
Table 2: % Yield of Various Extracts and Fractions Prepared from S. media and C. album Leaves
Various extracts and fractions such as MESM, CFSM, EAFSM, MECA, HFCA and EAFCA were prepared and undergo preliminary phytochemical evaluations. Findings obtained from phytochemical analysis exhibited presence of alkaloid, flavonoids, terpenoids and phenols in all the samples. Steroids were present in MECA and EAFCA, whereas saponins were present in all polar extract, as shown in Table 3.
| Phytoconstituents | MESM | CFSM | EAFSM | MECA | HFCA | EAFCA |
|---|---|---|---|---|---|---|
| Alkaloids | + | + | + | + | + | + |
| Phenols | + | + | + | + | + | + |
| Flavonoids | + | + | + | + | + | + |
| Steroids | - | - | - | + | - | + |
| Terpenoids | + | + | + | + | + | + |
| Saponins | + | - | + | + | - | + |
| Fats and oils | - | + | - | + | + | - |
Note: (+)-presence; (-) absence
Table 3: Preliminary Phytochemical Analysis of Different Extracts and Fractions of S. media and C. album
Various samples such as MESM, CFSM, EAFSM, MECA, HFCA and EAFCA were prepared and TPC was evaluated from the standard plot of gallic acid using equation, i.e., y=0.0012x–0.0921, Coefficient of Determination (R2)=0.9798 (fig. 1). TPCs in various samples of S. media and C. album were found in the range between 57.38-115.14 mg GAE/100 g and 39.32- 101.20 mg GAE/100 g. The results demonstrated maximum TPC content in EAFSM (115.14 mg) followed by EAFCA (101.20 mg), while the minimum TPC was observed in HFCA (39.32 mg) (Table 4).
| S. No. | Extract/Fraction | TPC (mg/100 g) |
|---|---|---|
| 1 | MESM | 99.21±0.29 |
| 2 | CFSM | 57.38±1.23 |
| 3 | EAFSM | 115.14±0.09 |
| 4 | MECA | 95.72±0.74 |
| 5 | HFCA | 39.32±1.58 |
| 6 | EAFCA | 101.20±0.48 |
Table 4: TPC of Different Extracts and Fractions of S. media and C. album
Various samples such as MESM, CFSM, EAFSM, MECA, HFCA and EAFCA were prepared and their
TFC was evaluated from the standard plot of rutin using equation, i.e., y=0.0027x+0.0636, R2=0.9952 (fig. 2). S. media displayed a high concentration of flavonoids when compared to C. album. TFC in S. media and C. album was found in the range between 72.13- 218.06 and 28.76-143.12 mg RU/100 g, respectively. The highest concentrations of flavonoids were found in the EAFSM (218.06 mg RU/100 g) followed by the MESM (152.13 mg RU/100 g), respectively, while the minimum flavonoid concentration was found in HFCA followed by MECA and EAFCA (28.76, 68.15 and 143.12 mg RU/100 g respectively (Table 5).
| S. No. | Extract/Fraction | TFC (mg/100 g) |
|---|---|---|
| 1 | MESM | 152.13±0.32 |
| 2 | CFSM | 72.13±0.06 |
| 3 | EAFSM | 218.06±0.52 |
| 4 | MECA | 68.15±0.29 |
| 5 | HFCA | 28.76±0.68 |
| 6 | EAFCA | 143.12±0.19 |
Table 5: TFC of Different Extracts and Fractions of S. media and C. album
TAC in different samples of S. media (MESM, CFSM, EAFSM) and C. album (MECA, HFCA, EAFCA) and TAC was evaluated from standard plot of atropine using equation, i.e., y=0.0095x–0.1175, R2=0.9873 (fig. 3). The highest TAC was found in MECA (82.35 mg AE/100 g) and followed by MESM (71.04 mg AE/100 g), while lowest TAC was recorded in CFSM (34.59 mg AE/100 g) and followed by HFCA 52.10 mg AE/100 g). The TAC was measured in EAFSM and it was found to be 67.28 mg AE/100 g (Table 6).
| S. No. | Extract/Fraction | TAC (mg/100 g) |
|---|---|---|
| 1 | MESM | 71.04±0.10 |
| 2 | CFSM | 34.59±0.26 |
| 3 | EAFSM | 54.38±0.19 |
| 4 | MECA | 82.35±0.12 |
| 5 | HFCA | 52.10±0.08 |
| 6 | EAFCA | 67.28±0.03 |
Table 6: TAC of Different Extracts and Fractions of S. media and C. album
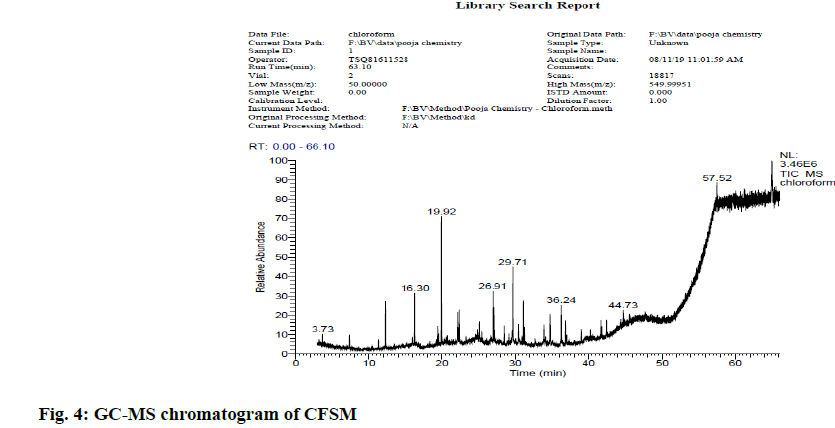
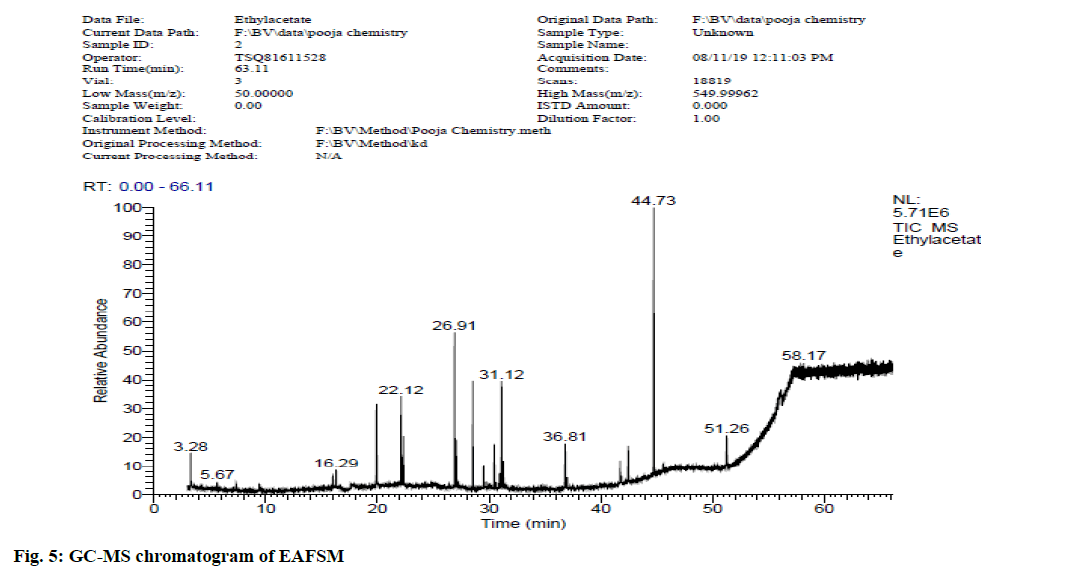
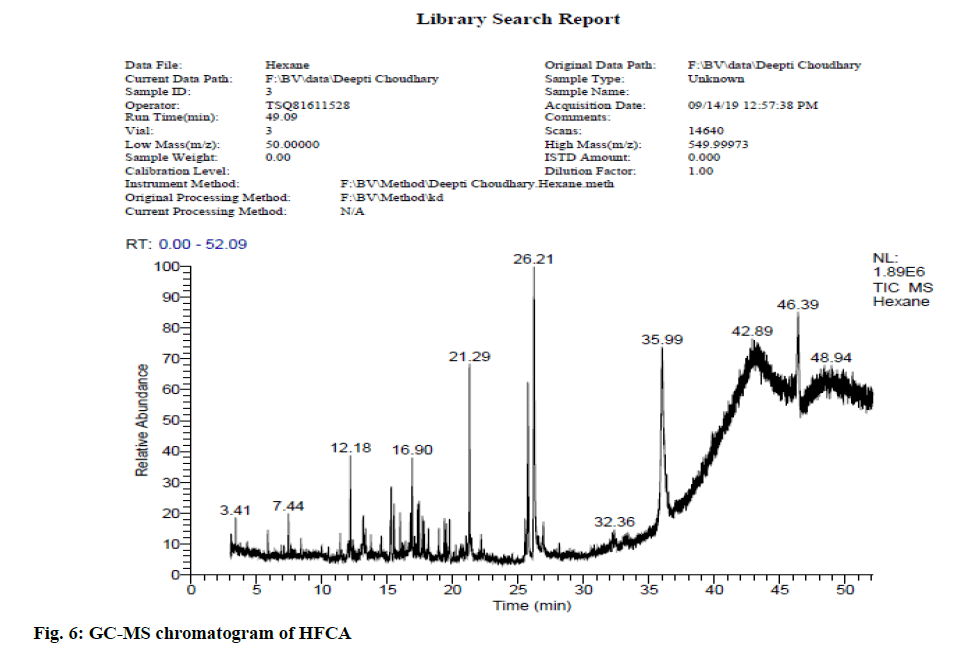
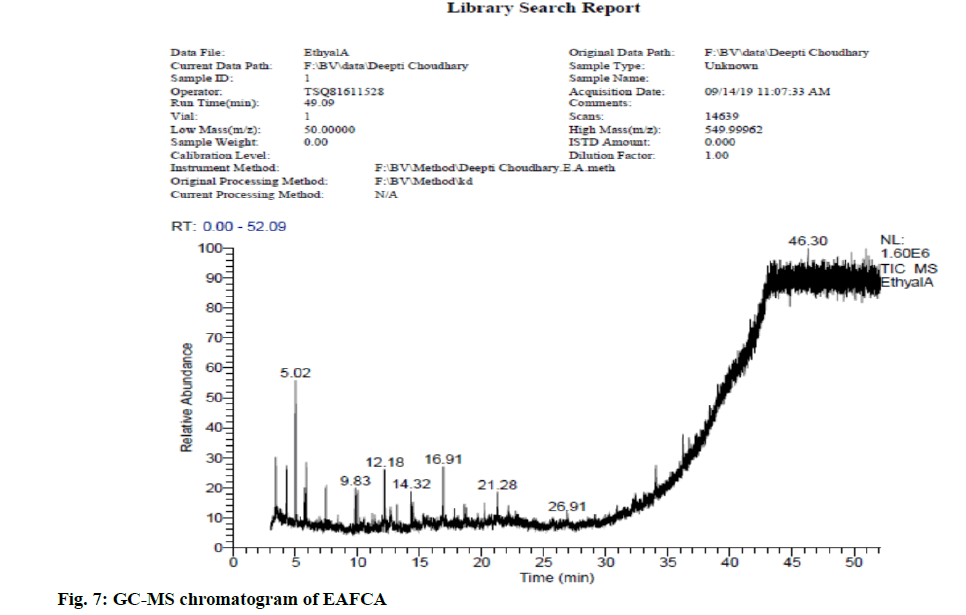
In view of high phenolic, alkaloid and flavonoid content, three different solvents viz. hexane, chloroform and ethyl acetate were used to achieve a different fraction of each plant viz. CFSM, EAFSM and HFCA, EAFCA respectively for GC-MS evaluation. GC-MS screening of CFSM, EAFSM demonstrated presence of total 33 phytoconstituents in CFSM and 35 phytoconstituents in EAFSM respectively. Similarly, 30 compounds were present in HFCA and 31 compounds were recorded in EAFCA as shown in Table 7-Table 10. GC-MS chromatogram of different phytoconstituents present in CFSM, EAFSM and HFCA, and EAFCA is depicted in fig. 4-fig. 7, respectively. Hexadecanoic acid was present in abundant concentration (51.81 %) in CFSM whereas Diisooctyl phthalate was recorded highest in EAFSM (38.03 %).
| Retention time (RT) | % of probability | Name of bioactive compound | Molecular formula |
| 12.24 | 20.09 | Tridecane | C13H28 |
| 12.24 | 16.19 | Tetradecane | C14H30 |
| 16.30 | 7.42 | Hexadecane | C16H34 |
| 19.92 | 48.86 | 2,4-Di-tert-butylphenol | C14H22O |
| 19.92 | 14.64 | Phenol-2,6-bis(1,1-dimethylethyl)- | C14H22O |
| 19.92 | 10.92 | Phenol-3,5-bis(1,1-dimethylethyl)- | C14H22O |
| 22.32 | 7.34 | Nonadecane | C19H40 |
| 22.32 | 7.05 | Heptadecane | C17H36 |
| 22.32 | 3.63 | Pentadecane | C15H32 |
| 22.32 | 3.07 | Dodecane-2,6,10-trimethyl- | C15H32 |
| 26.91 | 3.20 | Nonacos-1-ene | C29H58 |
| 26.91 | 3.08 | 1-Eicosene | C20H40 |
| 26.91 | 2.48 | 1-Hexadecanol | C16H34O |
| 26.91 | 2.19 | 9-Eicosene, (E)- | C20H40 |
| 26.91 | 2.02 | n-Nonadecanol-1 | C19H40O |
| 29.71 | 51.81 | Hexadecanoic acid, methyl ester | C17H34O2 |
| 31.11 | 5.40 | 1-Nonadecene | C19H38 |
| 31.11 | 3.49 | 1-Docosene | C22H44 |
| 31.11 | 3.35 | 1-Eicosanol | C20H42O |
| 31.11 | 2.70 | 10-Heneicosene | C21H42 |
| 31.11 | 2.49 | 2-Hexadecanol | C16H34O |
| 34.73 | 36.59 | Heptadecanoic acid, 16-methyl-, methyl ester | C19H38O2 |
| 34.73 | 22.17 | Methyl stearate | C19H38O2 |
| 36.23 | 51.14 | Dodecanoic acid, n-octyl ester | C20H40O2 |
| 36.23 | 8.23 | Dodecanoic acid, nonyl ester | C21H42O2 |
| 36.23 | 7.91 | Dodecanoic acid, tetradecyl ester | C26H52O2 |
| 36.23 | 4.31 | Dodecanoic acid, decyl ester | C22H44O2 |
| 36.23 | 3.48 | n-Butyl laurate | C16H32O2 |
| 57.51 | 40.67 | Octasiloxane | H18O7Si8 |
| 57.51 | 29.53 | Hexasiloxane | H14O5Si6 |
| 57.51 | 17.89 | Heptasiloxane | H16O6Si7 |
| 57.51 | 1.75 | Pentasiloxane | H12O4Si5 |
| 57.51 | 1.27 | Heptasiloxane | H16O6Si7 |
Table 7: Bioactive Analysis of CFSM by GC-MS
| RT | % of probability | Name of bioactive compound | Molecular formula |
|---|---|---|---|
| 19.92 | 44.12 | 2,4-Di-tert-butylphenol | C14H22O |
| 19.92 | 16.11 | Phenol-2,6-bis(1,1-dimethylethyl)- | C14H22O |
| 19.92 | 14.23 | Phenol-3,5-bis(1,1-dimethylethyl)- | C14H22O |
| 22.12 | 5.40 | 1-Hexadecanol | C16H34O |
| 22.12 | 5.40 | 5-Octadecene, (E)- | C18H36 |
| 22.12 | 4.02 | Hexadecen-1-ol, trans-9 | C16H32O |
| 31.11 | 6.89 | 1-Nonadecene | C19H38 |
| 22.32 | 13.04 | Hexadecane | C16H34 |
| 22.32 | 11.52 | Nonadecane | C19H40 |
| 22.32 | 5.24 | Tetradecane | C14H30 |
| 22.32 | 5.24 | Heptadecane | C17H36 |
| 22.32 | 5.04 | Octadecane | C18H38 |
| 26.91 | 4.52 | 1-Docosene | C22Has |
| 26.91 | 3.67 | 3-Octadecene, (E)- | C18H36 |
| 28.53 | 8.04 | 1,2 -Benzenedicarboxylic acid, bis(2-methylpropyl) ester | C16H22O4 |
| 28.53 | 7.41 | 1,2-Benzenedicarboxylic acid, butyl 2-methylpropyl ester | C16H22O4 |
| 28.53 | 6.55 | Phthalic acid, hept-4-yl isobutyl ester | C19H28O4 |
| 28.53 | 6.04 | Phthalic acid, hex-3-yl isobutyl ester | C18H26O4 |
| 30.46 | 17.12 | Dibutyl phthalate | C16H22O4 |
| 30.46 | 7.28 | Phthalic acid, butyl isohexyl ester | C18H26O4 |
| 30.46 | 5.72 | Phthalic acid, butyl 2-ethylbutyl ester | C18H26O4 |
| 30.46 | 4.61 | Phthalic acid, butyl hept-4-yl ester | C19H28O4 |
| 31.11 | 4.17 | 10-Heneicosene | C21H42 |
| 31.11 | 4.01 | 2-Hexadecanol | C16H34O |
| 31.11 | 3.85 | 1-Docosene | C22H44 |
| 36.81 | 2.68 | Heptacos-1-ene | C27H54 |
| 36.81 | 2.58 | Nonacos-1-ene | C29H58 |
| 44.73 | 38.03 | Diisooctyl phthalate | C24H38O4 |
| 44.73 | 25.33 | Phthalic acid, di(2-propylpentyl) ester | C24H38O4 |
| 44.73 | 12.30 | Bis(2-ethylhexyl) phthalate | C24H38O4 |
| 44.73 | 7.70 | Di-n-octyl phthalate | C24H38O4 |
| 51.26 | 5.57 | Octasiloxane | H18O7Si8 |
| 51.26 | 5.14 | Phthalic acid, decyl isohexyl ester | C24H38O4 |
| 51.26 | 4.34 | Didecan-2-yl phthalate | C28H46O4 |
| 51.26 | 3.66 | Hexa-t-butylselenatrisiletane | C24H54SeSi3 |
Table 8: Bioactive Analysis of EAFSM by GC-MS
| RT | % of probability | Name of bioactive compound | Molecular formula |
|---|---|---|---|
| 12.17 | 5.02 | Heptacosane | C27H56 |
| 12.17 | 4.24 | Heneicosane | C21H44 |
| 12.17 | 3.75 | Heptadecane, 2-methyl- | C18H48 |
| 15.30 | 63.77 | Benzene,(1-butylhepty)- | C17H28 |
| 15.30 | 11.31 | Benzene, (1-hexyltetradecyl)- | C26H46 |
| 15.30 | 4.47 | Heneicosane, 11-phenyl- | C27H48 |
| 15.30 | 3.60 | Benzene, (1-butylhexadecyl)- | C26H46 |
| 15.52 | 48.51 | Benzene,(1-propyloctyl)- | C13H2O |
| 15.52 | 6.90 | Benzene, (1-propylnonyl)- | C17H28 |
| 15.52 | 4.87 | Benzene, (1-butyloctyl)- | C18H30 |
| 15.52 | 3.34 | Benzene, (1-propyldecyl)- | C17H28 |
| 16.90 | 11.22 | Eicosane, 2-methyl- | C21H44 |
| 16.90 | 4.31 | Octadecane, 2-methyl- | C19H40 |
| 16.90 | 3.98 | Heptacosane | C27H56 |
| 16.90 | 3.52 | Hexadecane-2,6,10,14-tetramethyl | C20H42 |
| 21.29 | 42.83 | Hexadecanoic acid, methyl ester | C17H34O2 |
| 25.54 | 6.32 | 6,9-Octadecadienoic acid, methyl ester | C19H34O2 |
| 25.54 | 6.07 | 9-Octadecynoic acid, methyl ester | C19H34O2 |
| 25.54 | 5.84 | 7,10-Octadecadienoic acid, methyl ester | C19H34O2 |
| 25.54 | 4.35 | Methyl 5,12-octadecadienoate | C19H34O2 |
| 25.75 | 11.85 | 9,12,15-Octadecatrienoic acid,methyl ester,(Z,Z,Z)- | C19H34O2 |
| 25.75 | 7.66 | Methyl (Z)-5,11,14,17-eicosatetraenoate | C21H34O2 |
| 25.75 | 6.47 | Methyl -8,11,14-heptadecatrienoate | C18H30O2 |
| 26.21 | 57.58 | Phytol | C20H40O |
| 36.00 | 85.63 | Phenol-2,4-bis(1,1-dimethylethyl)-, phosphite (3:1) | C42H63O3P |
| 36.00 | 2.31 | Methylenebis (2,4,6-triisopropylphenylphosphine) | C31H50P2 |
| 46.39 | 41.88 | Octasiloxane-1,1,3,3,5,5,7,7,9,9,11,11,13,13,15,15-hexadecam | C16H50O7Si8 |
| 34.73 | 22.17 | Hexasiloxane-1,1,3,3,5,5,7,7,9,9,11,11-dodecamethyl | C12H36O5Si6 |
| 46.39 | 15.88 | Heptasiloxane-1,1,3,3,5,5,7,7,9,9,11,11,13,13-tetradecamethyl | C16H48O7Si8 |
| 46.39 | 1.68 | Pentasiloxane-1,1,3,3,5,5,7,7,9,9-decamethyl- | C10H30O4Si5 |
Table 9: Bioactive Analysis of HFCA by GC-MS
| RT | % of probability | Name of bioactive compound | Molecular formula |
|---|---|---|---|
| 10.01 | 5.55 | Tetradecane | C14H30 |
| 10.01 | 3.69 | Heptadecane | C17H36 |
| 10.01 | 3.55 | Nonadecane | C19H40 |
| 10.01 | 3.27 | Hexadecane | C16H34 |
| 12.19 | 5.77 | Heneicosane | C21H44 |
| 12.19 | 3.75 | Pentadecane | C15H32 |
| 12.19 | 3.75 | Hexadecane-2,6,11,15-tetramethyl- | C20H42 |
| 12.67 | 10.99 | 3-(4-Hydroxyphenyl)-1-propanol, 2TMS | C9H12O2 |
| 12.67 | 9.28 | Phenol-3,5-bis(1,1-dimethylethyl)- | C14H22O |
| 12.67 | 8.20 | 2,4-Di-tert-butylphenol | C14H22O |
| 14.32 | 6.99 | Acetic acid, chloro, octadecyl ester | C27H45ClO3 |
| 14.32 | 5.49 | 2-Hexadecanol | C16H34O |
| 14.32 | 3.54 | 9-octadecenoic acid, 2,2,2-trifluoro ethyl ester | C20H38O2 |
| 14.32 | 3.27 | 5-Octadecenal | C18H34O |
| 14.32 | 2.24 | Bacteriochlorophyll-c-stearyl | C52H72MgN4O4-2 |
| 16.91 | 6.01 | Heptacosane | C27H56 |
| 16.91 | 4.12 | Tetratetracontane | C44H90 |
| 16.91 | 3.96 | Hentricontane | C31H64 |
| 16.91 | 3.81 | Tetradecane-2,6,10-trimethyl- | C17H36 |
| 16.91 | 3.51 | Eicosane-7-hexyl- | C26H54 |
| 18.62 | 3.78 | cis-Vaccenic acid | C18H34O2 |
| 18.62 | 3.48 | Cyclohexane, 1,1'-dodecylidenebis[4-methyl- | C26H50 |
| 18.62 | 3.48 | 17-Pentatriacontene | C35H70 |
| 18.62 | 3.21 | Oleic acid eicosyl ester | C38H74O2 |
| 21.28 | 5.23 | 7,7-Diethylheptadecane | C21H44 |
| 21.28 | 3.44 | Eicosane | C20H42 |
| 34.04 | 66.87 | Octasiloxane-1,1,3,3,5,5,7,7,9,9,11,11,13,13,15,15-hexadecamethyl | C16H50O7Si8 |
| 34.04 | 18.95 | Heptasiloxane-1,1,3,3,5,5,7,7,9,9,11,11,13,13-tetradecamethyl- | C14H44O6Si7 |
| 34.04 | 9.20 | Hexasiloxane-1,1,3,3,5,5,7,7,9,9,11,11-dodecamethyl | C12H38O5Si6 |
| 36.23 | 4.21 | Benzoic acid, 4-methyl-2-trimethylsilyloxy-, trimethylsilyl ester | C14H24O3Si2 |
| 36.23 | 1.17 | Heptasiloxane, hexadecamethyl- | C16H48O6Si7 |
Table 10: Bioactive Analysis of EAFCA by GC-MS
The major phytoconstituents present in CFSM were hexadecanoic acid (51.81 %), 2,4-di-tert-butylphenol (48.86 %), tetradecane (16.19 %), nonadecane (7.34 %), 1-eicosene (3.08 %) while the major phytoconstituents present in EAFSM were diisooctyl phthalate (38.03 %), 1,2-benzenedicarboxylic acid (28.53 %), bis (2-methylpropyl) ester (8.04 %) and hept-4-yl isobutyl ester (6.04 %) respectively.
In addition, the major phytoconstituents present in HFCA were phytol (57.58 %), hexadecanoic acid, methyl ester (42.83 %), 9,12,15-octadecatrienoic acid, methyl ester (11.85 %) and eicosane, 2-methyl (11.22 %) respectively whereas EAFCM majorly recorded the presence of tetratetracotane (4.12 %), heptadecane (3.96 %), hentricotane (3.96 %), nonadecane (3.55 %), eicosane (3.44 %) and oleic acid, eicosyl ester (3.21 %) respectively.
Identification, purification, safety and standardization of herbal drugs must follow authenticated techniques. Physicochemical analysis plays an essential role in authentication of drugs and evaluation of adulterants present in crude drugs. Findings exhibited higher moisture content in the leaves of C. album as compared to S. media, which indicates that the leaves of S. media had less chance to get affected from any microbial contamination. Likewise, studies on total ash value demonstrated presence of more inorganic content S. media leaves (13.48±0.36 % w/w) than that of C. album (9.75±0.19 % w/w.) Moreover, extractive value signifies whether a crude plant material is exhaustive or not and depends on the affinity and nature of phytocompounds towards solvent.
In addition, results of alcohol soluble extractive value exhibited that S. media was found to contain high extractive value (16.32±1.21 % w/w) than C. album (14.20±0.78 % w/w). Upon, extraction MESM demonstrated higher % yield (18.75±0.46 % w/w) accompanied by EAFSM and CFSM respectively.
Similarly, MECA exhibited higher % yield (16.95"±0.78 % w/w) accompanied by HFCA and EAFCA, respectively. It is also noticeable from extraction yields that C. album contains more nonpolar constituents than S. media. Plants are considered as the biosynthetic factory that produces several secondary metabolites including glycosides, steroids, alkaloids, carbohydrates, polysaccharides and bioflavonoids. These phytoconstituents are essential for showing diverse medicinal attributes in the management of various ailments. Phytochemical screening revealed that MESM, CFSM, EAFSM, MECA, HFCA and EAFCA are rich in alkaloid, phenols, flavonoid compounds and terpenoids. In addition to this, MECA and EAFCA are also rich in steroids. Phenolic compounds represent major class of indigenous antioxidants and are also reported to contain promising antioxidant effects. According to results of quantitative analysis, the highest TPC has been found in EAFSM followed by EAFCA, MESM, MECA, CFSM and HFCA, respectively. The results of the study revealed that S. media contained higher amounts of phenolic contents compared to C. album. Flavonoids have been reported to possess significant antioxidant property that can prevent human body from reactive oxygen species and free radicals mediated oxidative damage.
In the present study, EAFSM contains a higher concentration of flavonoid when compared to MESM and CFSM. Similar findings were recorded in different extracts and fractions of C. album. Results of TAC revealed that C. album was found to contain more alkaloidal content as compared to S. media. Among different fractions, MECA was found to contain maximum TAC followed by MESM, EAFCA, EAFSM, HFCA and CFSM, respectively. Further, GC- MS analysis of various extracts like CFSM, EAFSM and HFCA, EAFCA leads to identifying a number of compounds. In the present study, 33 compounds and 35 compounds were identified from CFSM and EAFSM of S. media respectively by GC-MS evaluation. Similarly, 30 compounds and 31 compounds were identified the possible usage of these plants in the treatment of inflammation-related ailments.
The present study has shown that the plants S. media and C. album are rich in bioactive compounds and may play a crucial role in managing various diseases. In particular, GC-MS screening indicated the presence of n-hexadecanoic acid, phthalic acid hept-4-yl isobutyl ester, phytol and oleic acid, eicosyl ester, which validates the possible ethnomedicinal importance of these plants and the treatment of inflammation related ailments. Further, these plants can be explored to identify new compounds in the treatment of different inflammatory diseases.
Acknowledgements:
Authors are highly thankful to Vice-Chancellor, Banasthali Vidyapith, Banasthali, India, for providing the necessary facilities to carry out the entire research work.
Conflict of interests:
The authors declared no conflict of interest.
References
- Wachtel-Galor S, Benzie IFF. Herbal medicine: An introduction to its history, usage, regulation, current trends, and research needs. In: Benzie IFF, Wachtel-Galor S, editors. Herbal Medicine: Biomolecular and Clinical Aspects. 2nd ed. CRC Press/Taylor & Francis: Boca Raton (FL); 2011
- Pan SY, Zhou SF, Gao SH, Yu ZL, Zhang SF, Tang MK, et al. New perspectives on how to discover drugs from herbal medicines: CAM's outstanding contribution to modern therapeutics. Evid Based Complement Alternat Med 2013;2013:1-25.
- Oyebode O, Kandala NB, Chilton PJ, Lilford RJ. Use of traditional medicine in middle-income countries: A WHO-SAGE study. Health Policy Plan 2016;31(8):984-91.
- Namdeo AG. Plant cell elicitation for production of secondary metabolites: A review. Pharmacogn Rev 2007;1(1):69-79.
- Padalia H, Moteriya P, Chanda S. Green synthesis of silver nanoparticles from marigold flower and its synergistic antimicrobial potential. Arab J Chem 2015;8(5):732-41.
- Sikarwar I, Wanjari M, Baghel SS, Vashishtha P. A review on phytopharmacological studies on Chenopodium album Linn. Indo Am J Pharm 2013;3(4):3089-98.
- Kumar S, Biswas S, Mandal D, Roy HN, Chakraborty S, Kabir SN, et al. Chenopodium album seed extract: A potent sperm-immobilizing agent both in vitro and in vivo. Contraception 2007;75(1):71-8.
- Lavanchy D. Worldwide epidemiology of HBV infection, disease burden and vaccine prevention. J Clin Virol 2005;34:S1-3.
- Shan Y, Zhou J, Zhao HG, Feng X, Dong Y, Xia B. Amino-acid and mineral composition of Stellaria media. Chem Nat Compd 2010;46(4):667-8.
- Slavokhotova AA, Shelenkov AA, Korostyleva TV, Rogozhin EA, Melnikova NV, Kudryavtseva AV, et al. Defense peptide repertoire of Stellaria media predicted by high throughput next generation sequencing. Biochimie 2017;135:15-27.
- Kitanov GM. Phenolic acids and flavanoids from Stellaria media (L.) Vill. (Caryophyllaceae). Pharmazie 1992;47(6):470-1.
- Hu YM, Ye WC, Li Q, Tian HY, Wang H, Du HY. C-glycosylflavones from Stellaria media. Pharmacog Comm 2006;4(6):420-4.
- Hodisan V, Sancraian A. Triterpenoid saponins from Stellaria media (L.) Cyr. Farmacia 1989;37(2):105-9.
- Vanhaecke M, Van den Ende W, Lescrinier E, Dyubankova N. Isolation and characterization of a pentasaccharide from Stellaria media. J Nat Prod 2008;71(11):1833-6.
- Pande A, Shukla YN, Tripathi AK. Lipid constituents from Stellaria media. Phytochemistry 1995;39(3):709-11.
- Hu Y, Wang H, Ye W, Liu G. Aqueous constituents from Stellaria media (L.) Cyr. J China Pharm Univ 2005;36(6):523-5.
- Lowry OH, Rosebrough NJ, Farr AL, Randall RJ. Protein measurement with the Folin phenol reagent. J Biol Chem 1951;193:265-75.
- Anonymous. The Wealth of India: Publication and information directorate. CSIR, Hillside, New Delhi, India; 1976.
- Agrawal MY, Agrawal YP, Shamkuwar PB. Phytochemical and biological activities of Chenopodium album. Int J Pharmtech Res 2014;6(1):383-91.
- Khoobchandani M, Ojeswi BK, Sharma B, Srivastava MM. Chenopodium album prevents progression of cell growth and enhances cell toxicity in human breast cancer cell lines. Oxid Med Cell Longev 2009;2(3):160-5.
- Indian pharmacopoeia, 1996. 4th ed. India Ministry of Health and Family Welfare; 1996.
- World Health Organization. Quality control of herbal medicine, WHO: Geneva; 1998.
- Wagner H, Bladt S, Rickl V. Plant drug analysis: A thin layer chromatography atlas. 2nd ed. New York: Springer Science & Business Media; 2001.
- Khandelwal KR. Techniques and experiments, practical Pharmacognosy, 17th ed. Pune: Nirali Prakashan; 2007.
- Jain PK, Jain S, Sharma S, Paliwal S. Pharmacognostical specification and validated high-performance thin-layer chromatographic method for the estimation of quercetin in Phoenix sylvestris root. J Planar Chromatogr 2019;32(1):31-9.
- Jain PK, Jain S, Chak P, Swarnkar SK, Sharma S, Paliwal S. High-performance thin-layer chromatographic investigation of rutin in the leaves of Phoenix sylvestris in sequence with pharmacognostical and phytochemical evaluation. J Planar Chromatogr 2020;33(2):191-201.
- Arora S, Itankar P. Extraction, isolation and identification of flavonoid from Chenopodium album aerial parts. J Tradit Complement Med 2018;8(4):476-82.
- Soni V, Jha AK, Dwivedi J, Soni P. Qualitative and quantitative determination of phytoconstituents in some antifertility herbs. Indian J Pharm Sci 2018;80(1):79-84.
- Tambe VD, Bhambar RS. Estimation of total phenol, tannin, alkaloid and flavonoid in Hibiscus tiliaceus Linn. wood extracts. J Pharmacogn Phytochem 2014;2(4):41-7.
- Ajanal M, Gundkalle MB, Nayak SU. Estimation of total alkaloid in Chitrakadivati by UV-Spectrophotometer. Anc Sci Life 2012;31(4):198-201.
- Ezhilan BP, Neelamegam R. GC-MS analysis of phytocomponents in the ethanol extract of Polygonum chinense L. Pharmacognosy Res 2012;4(1):11-4.
- Casuga FP, Castillo AL, Corpuz MJ. GC-MS analysis of bioactive compounds present in different extracts of an endemic plant Broussonetia luzonica (Blanco) (Moraceae) leaves. Asian Pac J Trop Biomed 2016;6(11):957-61.
 Linear (Absorbance)