- *Corresponding Author:
- Indiraleka Muthiah
Department of Biotechnology
Mepco Schlenk Engineering College (Autonomous)
Sivakasi, Tamil Nadu 626005, India
E-mail: indiraleka@mepcoeng.ac.in
| Date of Received | 10 May 2022 |
| Date of Revision | 02 February 2023 |
| Date of Acceptance | 25 October 2023 |
| Indian J Pharm Sci 2023;85(5):1408-1421 |
This is an open access article distributed under the terms of the Creative Commons Attribution-NonCommercial-ShareAlike 3.0 License, which allows others to remix, tweak, and build upon the work non-commercially, as long as the author is credited and the new creations are licensed under the identical terms
Abstract
Ruellia patula belongs to the family Acanthaceae. The leaves of this plant possess tremendous medicinal values like treating wounds, eyesores, gonorrhea, syphilis and renal infections. Phytochemicals extracted using four different solvents namely hexane, acetone, methanol and water by maceration technique were qualitatively analysed by chemical tests. Total phenolic content was estimated as 142.94±1.01, 104.41±7.06, 14.37 mg Gallic Acid Equivalent/g of extract in acetone, methanol, and aqueous extracts respectively. Total flavonoid content was estimated as 37.49±1.83, 26.73±10.65 mg Quercetin Equivalent/g of extract in acetone and methanol extracts respectively. The antimicrobial activity of plant extracts was determined by agar well diffusion assay and minimum inhibitory concentration test, acetone extract showed better results for both assays. The minimum inhibitory concentration of acetone extract against five different organisms were determined as, Bacillus subtilis-202 mg/ml, Escherichia coli-208 mg/ml, Staphylococcus aureus-208 mg/ml, Pseudomonas aeruginosa-203 mg/ml and for Proteus mirabilis-200 mg/ml. Antioxidant activity of extracts was evaluated by 2,2-diphenyl-1-picryl-hydrazyl-hydrate assay, and IC50 values of methanol and acetone extracts were estimated as 146.45 and 153.81 μg/ml respectively. Anti-inflammatory activity of extracts estimated using protein denaturation inhibition assay resulted in better anti-inflammatory property associated with acetone extract. Based on the results, the acetone and methanol extracts showed better activities at a lower concentration, further gas chromatography-mass spectrometry analysis of these extracts was carried out and biological activity of components were determined from literature survey.
Keywords
Ruelliapatula, phytochemical compounds, gas chromatography-mass spectrometry, antimicrobial and anti-inflammatory activity, 2,5-diphenyl-2H-tetrazolium bromide assay
Phytochemicals are produced by plants for their growth, reproduction and protection against microorganisms or predators like insects and animals[1]. Phytochemicals show drug-likeness (antimicrobial, antioxidant, anticancer, etc.), biological friendliness and as alternatives to eradicate antibiotic-resistant pathogens[2-4]. Initially it is essential to screen and study the plants which are used as folklore medicines[5] to commercialize natural compounds as drug. The present study focuses on Dipteracanthus patulus (Jacq.) Nees. Synonym Ruellia patula (Vernacular name: Vedichedi, Kiranthinayagam) belongs to the family Acanthaceae[6]. When 5-6 leaves of this plant are chewed, the phytochemicals of these leaves act as an antidote to snakebite. Leaves are also used to treat cuts, wounds, an eyesore, gonorrhea, syphilis and renal infections[7]. Ruellia patula is an erect, pubescent, taproot, 50 cm tall, much-branched shrublet. Leaves are elliptic ovate. The fruit capsule is glabrous, 1.4-1.8 cm, 8-10 seeded. Fruits have flat and orbicular seeds. The plant is widely distributed in Arabia, India, Pakistan, Africa and Sri Lanka. In India, these plants are found in Western Ghats, Tamil Nadu, Rajasthan, Andhra Pradesh, and Haryana[8,9].
As Ruellia patula is traditionally used more frequently as a wound healer, wound healing properties of the extracts from leaves are studied. Wounds are either acute or chronic types. Acute wounds heal within the expected time, chronic wound types, take more time to heal and difficult to predict the healing time[10]. Acute wounds undergo four phases in the following order hemostasis, inflammation, proliferation, and remodelling[11]. Chronic wounds on the other hand show an extended inflammatory phase, proliferative phase, or remodelling phase leading to wound ulcers[12]. Hypoxic condition is created in the wound region due to two main reasons such as vascular disruption which leads to diminished oxygen delivery[13] and the exposure of subcutaneous tissue (due to loss of skin integrity in the wound region) to microorganisms causes existing oxygen to be utilized by the aerobic microorganisms. This hypoxic condition becomes an appropriate region for the anaerobic microorganism survival[10]. Hence the wound is not only occupied by aerobic microorganisms like Staphylococcus aureus, Pseudomonas aeruginosa, etc but also by the anaerobic microorganisms during chronic stage. So, there is a need for antimicrobial activity of the compound against those microorganisms to decrease the healing time. Further the healing time also delayed by production of excess Reactive Oxygen Species (ROS) by phagocytes. ROS being oxidizing molecules when present at a low-level help in getting rid of the infection and stimulate wound healing by producing cell survival signals[14,15], but when present in excess causes oxidative stress, cell damage and pro-inflammatory condition[16]. Antioxidant molecules on the other hand help to overcome oxidative stress by donating electron or hydrogen ions to ROS and prevent ROS from taking away electrons from macromolecules such as DNA or protein[17], thus preventing host cell damage. The present study focuses on the phytochemical analysis, evaluation of antimicrobial, antioxidant, and anti-inflammatory properties[18] of four different solvent extracts of Ruellia patula leaves and determining the more effective extract among the four. Identification of phytochemicals present in effective extract using gas chromatography-mass spectrometry analysis.
Materials and Methods
Collection of plant materials:
Ruellia patula plant was collected from different regions of Virudhunagar district in Tamil Nadu, India. Plant materials were taxonomically identified and authenticated by the Botanical Survey of India, Southern Regional Centre, Coimbatore, Tamil Nadu, India.
Extraction:
Leaves of collected plants were washed, shade dried and powdered using an electric blender. One nonpolar solvent hexane, one mid polar solvent acetone, and two polar solvents methanol and water were chosen. The maceration technique was carried out to avoid the loss of thermolabile compounds and to ensure a longer exposure time of leaf powder to the solvent[19]. The leaf powder was added to solvents in the ratio of 1:20 (W/V). Maceration was carried out for 24 h. Then the contents were filtered using Whatman filter paper No.1 obtained filtrate was air-dried[20].
Phytochemical analysis:
For phytochemical analysis, crude extracts were dissolved in their respective solvents. Phlobatannins were detected by the formation of a red precipitate when a few drops of extract boiled in 1 % HCl. Terpenoids or sterols were detected by the formation of a reddish-brown ring when 1 ml of the extract was mixed with 0.5 ml of chloroform followed by the addition of a few drops of concentrated sulphuric acid. Tannins or phenolics were detected by brownish-green colour formation when 2 ml of the extract was added with a few drops of 10 % ferric chloride[21]. Alkaloids were detected by adding a few ml of extract and a few ml of diluted HCl, the mixture was then filtered, and filtrate obtained was added with drops of saturated picric acid (Hager's reagent), and the formation of a yellow precipitate indicates the presence of alkaloids. Flavonoids were detected by an alkaline reagent test where 2 ml of the extract was added with a few drops of 1 N NaOH, the formation of a yellow solution indicates the presence of flavonoids. Glycosides detection was done by following the Keller-Killiani test, in which 2 ml of extract was added with 2 ml of water, 0.5 ml of lead acetate and shaken well, mixture obtained was then filtered, filtrate then added with an equal volume of chloroform, evaporated, the obtained residue dissolved in glacial acetic acid and few drops of ferric chloride was added, the obtained mixture was then transferred to test tube containing 2 ml of concentrated sulphuric acid[19]. The formation of a reddish-brown layer at the interface which on standing turns to bluish green indicates the presence of glycosides.
Total phenolic content:
Assay carried out based on Ainsworth et al.[22] with slight modifications, 0.25 ml of each gallic acid standard aliquots of following concentrations, 10, 20, 40, 60, 80, 100 µg/ml prepared in 10 % (v/v) Dimethylsulfoxide (DMSO) was added with 1 ml of 10 % (v/v) Folin-Ciocalteu reagent and 2 ml of 7.5 % (v/v) sodium carbonate. Shaken well and kept in dark condition for 30 min. Spectrophotometric reading of absorbance taken at 765 nm. Blank was prepared by replacing gallic acid aliquot with 10 % (v/v) DMSO. Whereas extracts at two different concentrations were prepared as 0.1 and 1 mg/ml in 10 % (v/v) DMSO, 0.25 ml of extracts were added in place of gallic acid aliquot. The standard curve of gallic acid concentration versus absorbance plotted was used to determine the total phenolic content in extract and expressed as mg of Gallic Acid Equivalent (GAE) per g of extract.
Total flavonoid content:
The assay was carried out based on Correa et al.[23] with slight modifications. 0.25 ml of each Quercetin standard aliquots of concentrations, 20, 40, 60, 80, 100 µg/ml prepared in 80 % ethanol was added with 0.65 ml of 80 % ethanol, 0.05 ml of 1 M sodium acetate, and 0.05 ml of aluminium chloride (10 %) and placed in dark condition for 40 min. Absorbance was read in the spectrophotometer at 415 nm. Blank was prepared by mixing 0.95 ml of 80 % ethanol and 0.05 ml of 1 M sodium acetate. Extracts of 0.5 mg/ml (in 10 % DMSO) were prepared and 0.25 ml of extract was used in place of Quercetin. Negative control samples were prepared by replacing 0.05 ml of aluminium chloride with 0.05 ml of distilled water. The standard curve of quercetin concentration vs. absorbance plotted was used to determine the total flavonoid content in the extracts and expressed results as mg of Quercetin Equivalent (QE) per g of extract.
Antimicrobial assay:
Preparation of Inoculum: The antimicrobial activity of the extracts was tested against bacteria such as Escherichia coli, Bacillus subtilis, Pseudomonas aeruginosa, Staphylococcus aureus, and Proteus mirabilis. The bacterial strains were procured from Microbial Type Culture Collection, India. Microorganisms were cultured overnight in nutrient broth (Peptone 5 g/l, NaCl 5 g/l, Meat Extract 1.5 g/l, Yeast Extract 1.5 g/l) at 37° in a rotary shaker. Later, each strain was adjusted to a concentration of 108 cells/ml using 0.5 McFarland standard using a spectrophotometer at a wavelength of 600 nm[24].
Agar well diffusion assay: The antimicrobial activity of extracts was tested by Agar well diffusion method. The surface of the agar plate was inoculated by spreading a 100 µl volume of the microbial culture over the entire surface of the agar plate. A well was punched aseptically using a sterile cork well borer, and 100 µl of plant extract was introduced into the well. Then the agar plates were incubated at 37° in an incubator. For the diffusion of the extracts into agar, the plates were refrigerated for 30 min[25]. After 24 h of incubation, the zone of inhibition (diameter) was measured in mm. This assay was repeated twice to minimize the errors.
Minimum Inhibitory concentration (MIC): MIC was identified by the microtiter broth dilution method. The procedure involved preparing different concentrations of plant extracts in nutrient broth in a 96 well microtitration plate. Different serial dilutions were made for different organisms for each extract. Then each well was inoculated with a microbial culture which was adjusted to a 0.5 McFarland scale. After mixing, the microtiter plates were incubated at 37° for 24 h[25]. The concentration of extract at which no visible growth was observed was taken as MIC value. This experiment was repeated twice to minimize errors and to confirm the activity.
Antioxidant activity:
2,2-diphenyl-1-picryl-hydrazyl-hydrate (DPPH) free radical scavenging assay: Different concentrations of 20, 40, 60, 80 and 100 µg/ml of ascorbic acid and extracts were prepared in absolute ethanol and 10 % DMSO respectively. 0.25 ml of each standard aliquots and samples was added with 1 ml of 0.1 mM DPPH reagent freshly prepared in absolute ethanol. The reaction mixture was incubated at room temperature in dark conditions for 30 min. Spectrophotometric reading of absorbance at 517 nm for all standard and sample aliquots was determined[26]. Percentage of inhibition estimated using the formula as follows:

Asample=Absorbance of sample/standard Control is 0.25 ml of ethanol or 10 % DMSO and 1 ml of 0.1 mM DPPH for standards or samples respectively. Blank is absolute ethanol or mixture of 0.25 ml of 10 % DMSO and 1 ml of ethanol for standards or samples respectively.
Anti-inflammatory activity:
The anti-inflammatory activity of Ruellia patula extracts was studied according to the protocol of Padmanabhan et al.[27], Gunathilake et al.[28]. The activity of the extracts was evaluated using the "Albumin Denaturation Inhibition Assay”. The reaction mixture was prepared by mixing 50 μl of egg albumin (from fresh hen’s egg), 700 μl of phosphate- buffered saline of pH 7.4, and 0.5 ml of plant extract (0.6 to 1.6 mg/ml). Positive controls were prepared using 0.5 ml of diclofenac sodium (0.6 to 1.6 mg/ ml) in the place of plant extract. Negative control was prepared by mixing 50 µl of Albumin and 750 µl of phosphate-buffered saline. Controls and test samples were incubated at 37° for 15 min and again incubated at 75° for 10 min. Then the absorbance was read at 660 nm (To nullify the absorbance due to extracts at different concentrations, mixture of 0.5 ml of extract (0.6 to1.6 mg/ml) and 750 μl of 10 % DMSO was prepared and spectrophotometric reading of absorbance taken at 660 nm). The percentage of inhibition was calculated using the formula

Gas Chromatography-Mass Spectroscopy (GC- MS) analysis of Ruellia patula leaf extracts:
Plant extracts were subjected to GC-MS. The analysis was performed using Agilent GC 7890A/ MS 5975C, an inert mass spectrometer fused with the capillary column of 30 m×0.25 mm with a film thickness of 0.25 µm. Pure nitrogen gas was used as the carrier gas at a flow rate of 1 ml/min and the pressure was maintained at 7.6522 psi. The oven temperature was increased from 50° to 300° at a rate of 50°/min. A 1 µl aliquot of the crude extract of acetone and methanol leaf extracts was injected in split mode. The runtime for analysis was 23.833 min. The peak retention time, peak area (%), and mass spectral fragmentation patterns to that of the known compounds described by the National Institute of Standards and Technology (NIST) library[29].
Results and Discussion
According to some investigators, it is best to carry out initially the phytochemical analysis before evaluating the biological activity of plant extracts. Determining the phytoconstituents helps to forecast the pharmacological function of the plant extracts[30,31]. The presence of phytochemicals such as flavonoids, tannins or phenols, alkaloids, glycosides, phlobatannins, terpenoids, or sterols of each extract wasdetectedbychemicaltests. Flavonoids, glycosides, and phlobatannins were detected in acetone and methanol extracts, tannins or phenols detected in acetone, methanol and aqueous extracts, terpenoids detected in hexane and methanol extracts (Table 1).
| Solvent | Hexane | Acetone | Methanol | Aqueous |
|---|---|---|---|---|
| Flavonoids | - | + | + | - |
| Tannins or phenolic | - | + | + | + |
| Alkaloids | - | - | - | - |
| Glycoside | - | + | + | - |
| Phlobatannins | - | + | + | - |
| Terpenoids or sterols | + | - | + | - |
Note: Presence (+) and Absence (-)
Table 1: Phytochemical Analysis of the Extracts by Chemical Tests
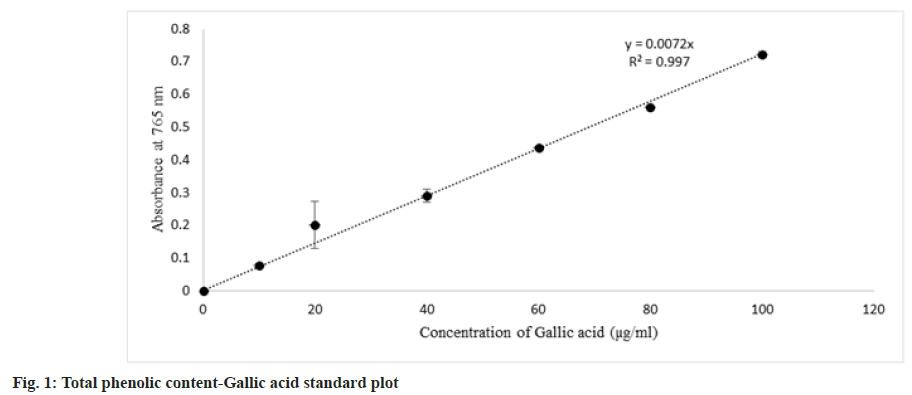
Under basic conditions (sodium carbonate) phenolic compounds lose their proton and form phenolate anions which can reduce Folin-Ciocalteu's Reagent (FCR) which results in blue color formation due to the reduction of molybdate to molybdenum oxide in the FCR. Formed molybdenum oxide shows maximum absorbance at 765 nm. Hence the intensity of blue coloration is directly proportional to the concentration of phenolics[32]. The standard curve for total phenolic content was obtained (fig. 1), and the total phenolic content of extracts was interpolated from the standard curve. Total phenolic content in extracts decreases as follows, acetone extract>methanol extract>aqueous extract, and no phenolic content was detected in hexane extract (Table 2).
| Solvent | Total phenolic content (mg GAE/g of extract) |
|---|---|
| Acetone | 142.94±1.01 |
| Methanol | 104.41±7.06 |
| Aqueous | 14.37 |
Note: Values obtained are mean values of two observations (mean±standard deviation). As phenolic compounds were absent in hexane extract, the assay showed positive outcomes for acetone, methanol and aqueous extracts
Table 2: Estimation of Total Phenolic Content of Four Extracts
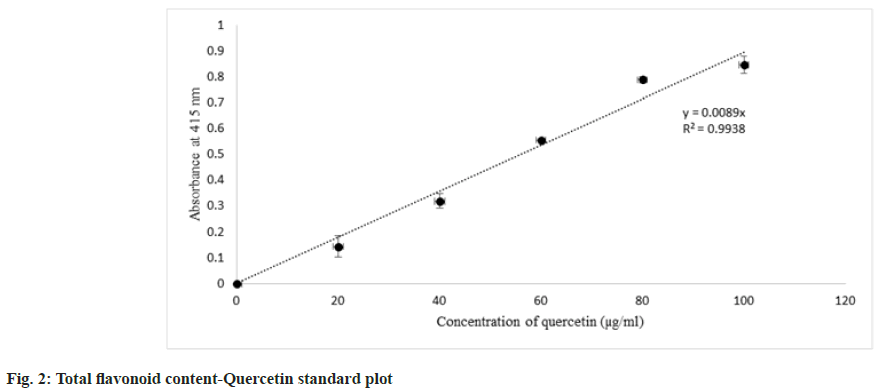
Flavonoids are estimated by the aluminium chloride colorimetric method where aluminium chloride forms the complex with either C-5 or C-3 hydroxyl, the C-4 group of flavonols, and flavones. Those mentioned complexes are said to be acid stable complexes. Additionally, aluminium chloride forms ortho-dihydroxyl groups in the B- or A- ring of flavonoids which are acid labile complexes[33]. Standard plot for total flavonoid content obtained, it was estimated that only the acetone and methanol extracts possess the flavonoid content which is correlating to the phytochemical analysis data of four different extracts. Among acetone and methanol extracts, acetone extract contains a higher content of flavonoids than methanol extract (fig. 2 and Table 3).
| Solvent | Total flavonoid content (mg QE/g of extract) |
|---|---|
| Acetone | 37.49±1.83 |
| Methanol | 26.73±10.65 |
Note: Values obtained are mean values of two observations (mean±standard deviation). As flavonoid present only in acetone and methanol extracts, aluminium flavonoid complex concentration was estimated only in those extracts from the assay
Table 3: Estimation of Total Flavonoid Content of Four Extracts
Antibiotic resistance is a challenge that continues to affect the healthcare industry in both developing and developed countries all over the world. The rise and spread of multidrug-resistant organisms have put conventional antibiotic therapy in jeopardy. This has forced a search for new antimicrobial substances, such as plants, which produce a wide range of bioactive chemicals with recognized medicinal characteristics. In this study, the antimicrobial property of extracts was studied against five microorganisms Escherichia coli, Bacillus subtilis, Staphylococcus aureus, Pseudomonas aeruginosa, and Proteus mirabilis.
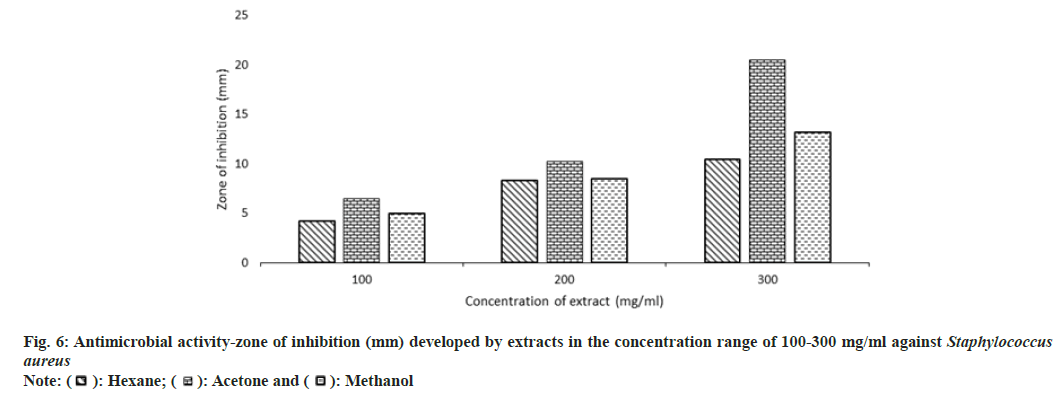
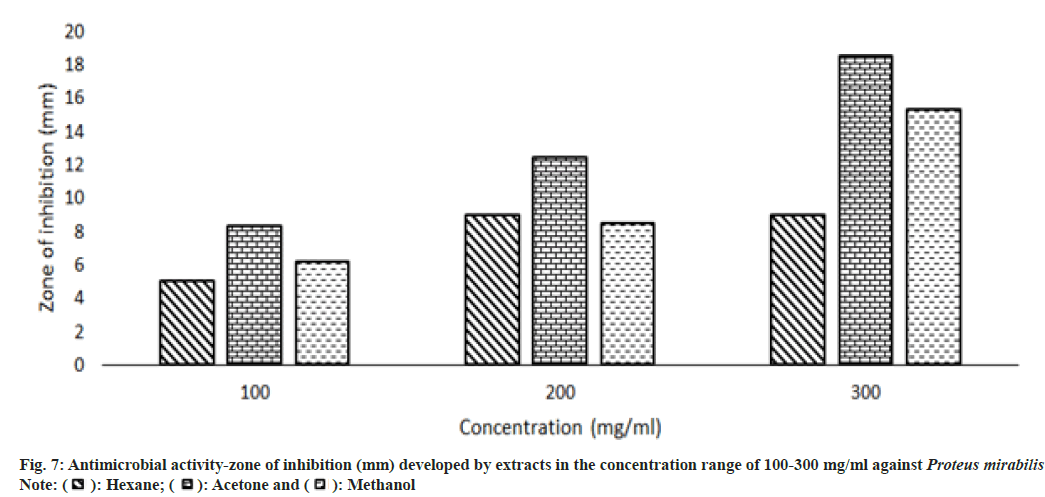
Other than the aqueous extract of leaves, all other extracts showed a significant zone of inhibition. Zone of inhibition decreased as positive control>acetone extract>methanol extract>hexane extract. Ampicillin was used as positive control against Escherichia coli, Bacillus subtilis and Proteus mirabilis. Levofloxacin and penicillin were used as positive control against Staphylococcus aureus and Pseudomonas aeruginosa respectively. Ampicillin was used in three different concentrations against Escherichia coli and Bacillus subtilis (fig. 3 and fig. 4). Disc containing 2 µg/disc of ampicillin developed zone of inhibition of 18.55 mm against Proteus mirabilis. Disc containing 2 units/disc of penicillin developed zone of inhibition of 15.2 mm against Pseudomonas aeruginosa and levofloxacin disc (5 µg/disc) developed zone of inhibition of 22.2 mm against Staphylococcus aureus. Acetone showed a better zone of inhibition from 100-300 mg/ml. Zone of inhibition of acetone extract at 300 mg/ml against microbes such as Escherichia coli-18.75 mm, Bacillus subtilis-20.5 mm, Staphylococcus aureus-20.5 mm, Pseudomonas aeruginosa-22.3 mm and Proteus mirabilis-18.5 mm (fig. 3-fig. 7).
MIC is defined as the lowest concentration of the antimicrobial agent that prevents visible microbial growth after 24 h of incubation. Extracts exhibited antimicrobial activity against all the 5 microorganisms such as Escherichia coli, Bacillus subtilis, Staphylococcus aureus, Pseudomonas aeruginosa, and Proteus mirabilis. MIC of acetone extract was lower than other extracts, Escherichia coli-208 mg/ml, Bacillus subtilis-202 mg/ml, Staphylococcus aureus-208 mg/ml, Pseudomonas aeruginosa-204 mg/ml, Proteus mirabilis-204 mg/ ml (Table 4). The aqueous extract didn't inhibit the growth of microorganisms.
| Solvent | Escherichia coli | Bacillus subtilis | Staphylococcus aureus | Pseudomonas aeruginosa | Proteus mirabilis |
|---|---|---|---|---|---|
| Hexane (mg/ml) | 288 | 264 | 289 | 313 | 315 |
| Acetone (mg/ml) | 208 | 202 | 208 | 204 | 204 |
| Methanol (mg/ml) | 215 | 210 | 210 | 208 | 207 |
Note: Aqueous extract did not show microbial growth inhibition, thus minimum inhibitory concentration was estimated only for hexane, acetone and methanol extracts
Table 4: Minimum Inhibition Concentration of Extracts against Five Microorganisms
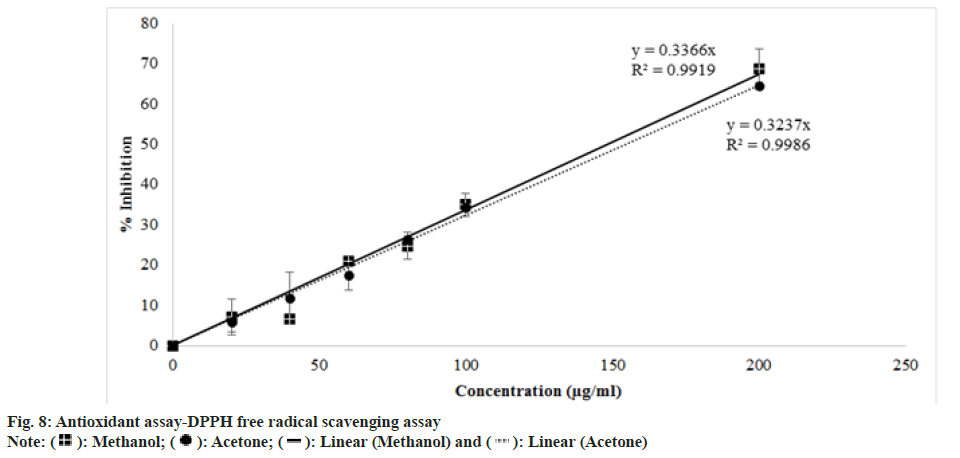
DPPH assay works on the principle of free radical scavenging. The highly sensitive and simple nature of the assay made the assay popular nowadays. DPPH free radical is purple which turns to yellow color DPPH when antioxidant provides hydrogen atom to the free radical. As the concentration of antioxidants increases, there occurs a decrease in the intensity of the purple color. DPPH free radical shows maximum absorbance at 517 nm[34]. Absorbance at 517 nm vs. concentration of extract (µg/ml) was plotted (fig. 5) and analysed that percentage of inhibition was directly proportional to the concentration of extract. The IC50 value of methanol extract in DPPH free radical scavenging was interpolated as 146.4483 µg/ml which is less than the IC50 value of acetone extract of 153.8131 µg/ml (Table 5). While other extracts did not show radical scavenging activity within a concentration range of 10-200 (µg/ml).
| Solvent | IC50 (µg/ml) |
|---|---|
| Methanol | 146.4483 |
| Acetone | 153.8131 |
Table 5: Determination of IC50 Value of Four Extracts in Scavenging DPPH Free Radicals
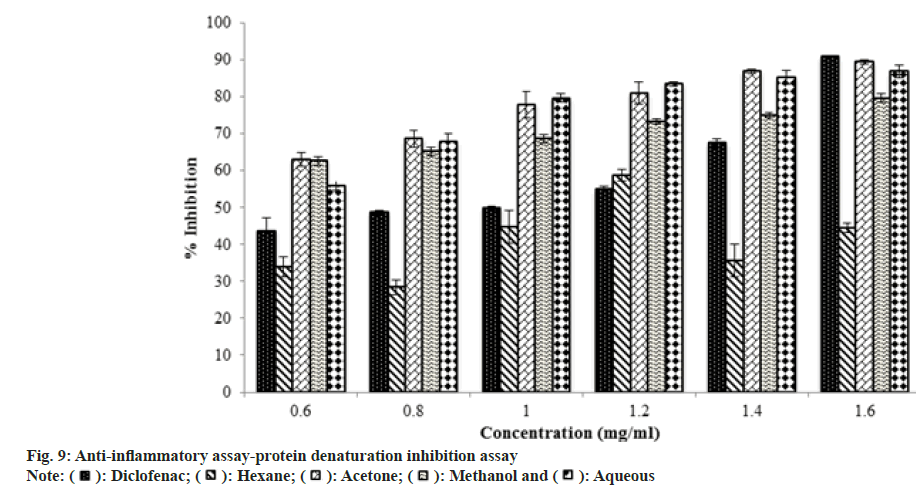
The egg albumin (protein) denaturation inhibition assay provides a cheap alternative method for testing the anti-inflammatory activity of herbal extracts. As the concentration of extract had increased, absorbance decreased, indicating that denaturation of egg albumin by the applied heat was inhibited by leaf extract. Percentage of inhibition by the extracts at 1.6 mg/ml decreased as diclofenac (90 %)>acetone extract (89 %)>aqueous extract (86 %)>methanol (79 %)>hexane (45 %) (fig. 6). The result was compared with Ruellia tuberose. Hexane extract of Ruellia tuberosa was not showed antimicrobial activity on Escherichia coli, Pseudomonas aeruginosa and Protease sp at any concentration[78]. Anti-inflammatory activity of Ruellia tuberose was studied by in vivo experiment and it showed the activity at maximum concentration 300 mg/kg[79].
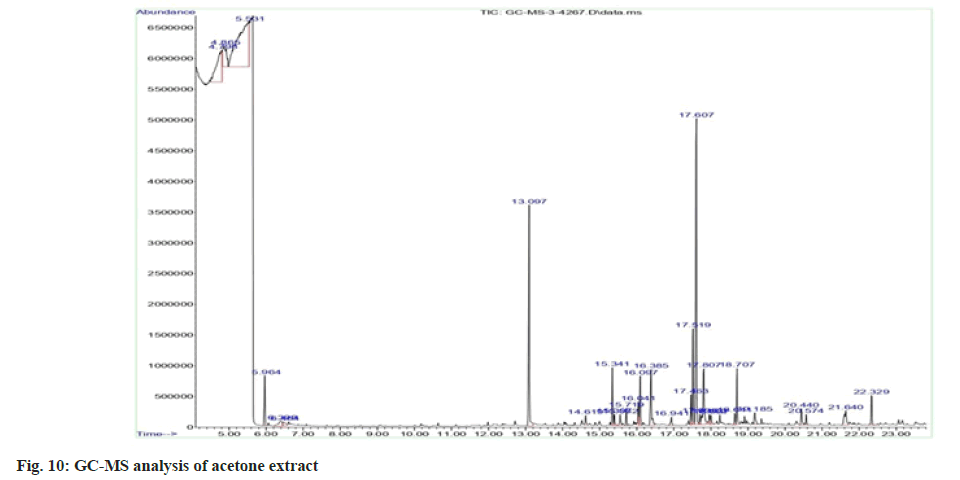
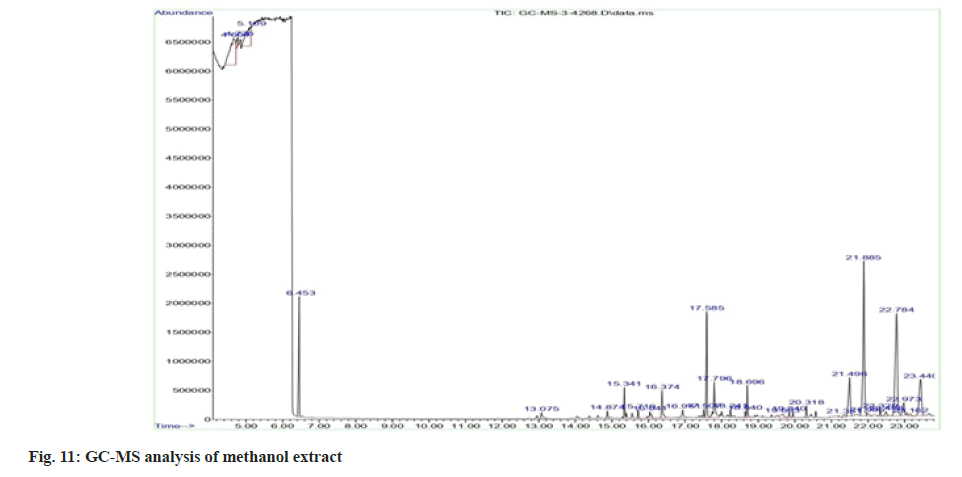
As acetone and methanol extracts showed better activities than other two extracts, acetone and methanol extracts were further analysed by GC-MS method. In the case of acetone extract, compounds with greater percentage area are phytol (14.99) and diethyl phthalate (10.05) (fig. 8 to fig. 11). Phytol possesses both anti-inflammatory and antimicrobial activities. Diethyl phthalate possesses antimicrobial activity (Table 6)[35-77]. In the case of methanol extract, compounds with greater percentage area are beta-sitosterol (17.01), dimethyl sulfone (7.53), beta-amyrin (6.51) and alpha-amyrin (6.51). Antimicrobial activity associated with dimethyl sulfone, antibacterial and antioxidant activities associated with beta-sitosterol, anti-inflammatory activity associated with beta-sitosterol, dimethyl sulfone, beta- amyrin, alpha-amyrin (Table 7)[78,79].
| Name | RT | % Area | MW | Molecular formula | Biological activity |
|---|---|---|---|---|---|
| Dimethyl sulfone | 5.964 | 2.1 | 94.14 | C2H6O2S | Antimicrobial and anti-inflammatory[35] |
| Diethyl Phthalate | 13.1 | 10.05 | 222.24 | C12H14O4 | Antimicrobial[36] |
| Tetradecanoic acid | 14.62 | 0.51 | 228.37 | C14H28O2 | Antimicrobial[37] |
| Tridecanoic acid | 14.62 | 0.51 | 214.34 | C13H26O2 | Antimicrobial, anti-inflammatory[38] |
| 2-Hexadecene, 3,7,11,15-tetramethyl | 15.4 | 0.55 | 280.5 | C20H40 | Antimicrobial and antioxidant[39] |
| 5-Nonadecen-1-ol | 15.55 | 0.59 | 282.5 | C19H38O | Antimicrobial and anti-inflammatory[40] |
| 1,4-Eicosadiene | 15.55 | 0.59 | 278.5 | C20H38 | Antimicrobial[41] |
| Cyclohexanol, 1-ethynyl | 15.72 | 0.69 | 124.18 | C8H12O | Anticancer and antioxidant[42] |
| Dodeca-1,6-dien-12-ol, 6,10-dimethyl | 15.72 | 0.69 | 210.36 | C14H26O | Antimicrobial, antioxidant, and anti-inflammatory[43] |
| Squalene | 16.04 | 1.08 | 410.7 | C30H50 | Antioxidant, antibacterial[44] |
| Hexadecanoic acid, methyl ester | 16.1 | 2.23 | 270.451 | C17H34O2 | Antibacterial and antifungal[45] |
| Pentadecanoic acid, 14-methyl-, methyl ester | 16.1 | 2.23 | 270.5 | C17H34O2 | Antimicrobial, antifungal[46] |
| n-Hexadecanoic acid | 16.39 | 3.3 | 256.42 | C16H32O2 | Antioxidant[47] |
| Nerolidol 1 | 16.94 | 0.55 | 222.37 | C15H26O | Antimicrobial, anti-biofilm, antioxidant, anti-inflammatory[48] |
| Methyl 10-trans,12-cis-octadecadienoate | 17.64 | 1.18 | 294 | C19H34O2 | Antioxidant and antimicrobial[47] |
| 9,12,15-Octadecatrienal | 17.52 | 4.13 | 262.43 | C18H30O | Antimicrobial[49] |
| Phytol | 17.61 | 14.99 | 296.5 | C20H40O | Anti-inflammatory and antimicrobial[50] |
| Octadecanoic acid, methyl ester | 17.7 | 0.44 | 294.47 | C19H34O2 | Antiviral[51] |
| Octadecanoic acid | 17.95 | 0.59 | 284.48 | C18H36O2 | Anti-inflammatory and antioxidant[47] |
| Tetradecanoic acid | 17.95 | 0.59 | 228.37 | C14H28O2 | Antimicrobial[52] |
| 3-Hydroxymyristic acid | 18.64 | 0.61 | 244.37 | C14H28O3 | Antifungal and antimicrobial[53] |
| 7-Tetradecyne | 19.19 | 0.78 | 194.36 | C14H26 | Antimicrobial[54] |
| 1,2-Benzenedicarboxylic acid, mono(2-Ethylhexyl) ester | 20.57 | 0.5 | 278.34 | C16H22O4 | Antimicrobial[46] |
| Di-n-octyl phthalate | 20.57 | 0.5 | 390.6 | C24H38O4 | Antimicrobial[55] |
| Phthalic acid, isohexylisoporpyl ester | 20.57 | 0.5 | 292.4 | C17H24O4 | Antimicrobial[56] |
| Nonanoic acid, 9-(3-hexenylidenecyclopropylidene)-, 2-hydroxy-1-(hydroxymethyl)ethyl ester | 21.64 | 1.79 | 52 | C29H36O4 | Antioxidant, antimicrobial[57] |
| i-Propyl 9,12,15-octadecatrienoate | 21.64 | 1.79 | 320.5 | C29H36O2 | Anti-inflammatory[58] |
| 2,6,10,14,18,22-Tetracosahexaene, 2,6,10,15,19,23-hexamethyl | 22.33 | 1.5 | 410.72 | C30H50 | Antioxidant[59] |
Note: RT: Retention Time and MW: Molecular Weight
Table 6: Compounds Identified from GC-MS Analysis of Acetone Extract
| Name | RT | % Area | MW | Molecular formula | Biological activity |
|---|---|---|---|---|---|
| Dimethyl sulfone | 6.453 | 7.53 | 94.13 | C2H6O2S | Anti-inflammatory and antimicrobial[35] |
| Diethyl Phthalate | 13.075 | 0.79 | 222.24 | C12H14O4 | Antimicrobial[36] |
| 2-Furanethanol, .beta.-methoxy-(S) | 14.874 | 0.58 | 142.15 | C7H10O3 | Antimicrobial[40] |
| 1-Methoxy-3-(2-hydroxyethyl) nonane | 15.341 | 1.59 | 202.33 | C12H26O2 | Antimicrobial, antioxidant activity[60] |
| 9-Nonadecyne | 15.719 | 0.51 | 264.5 | C19H36 | Antifungal, antioxidant and antimicrobial[40] |
| Squalene | 16.041 | 0.85 | 410.7 | C30H50 | Antioxidant[44] |
| n-Hexadecanoic acid | 16.374 | 2.28 | 256.42 | C16H32O2 | Antioxidant[47] |
| 5,9-Undecadien-2-one, 6,10-dimethyl | 16.941 | 1.06 | 194.31 | C13H22O | Antimicrobial[61] |
| 9,12,15-Octadecatrienoic acid, methyl ester | 17.507 | 0.49 | 292.5 | C19H32O | ALA–omega 3 fatty acid |
| Reduce blood clots[47] | |||||
| 7,10,13-Hexadecatrienoic acid, methyl ester | 17.507 | 0.49 | 264.4 | C17H28O2 | Fatty acids that reduce blood clots[62] |
| Phytol | 17.585 | 0.87 | 296.539 | C20H40O | Anti-inflammatory and antimicrobial[50] |
| Isophytol | 17.585 | 0.87 | 296.5 | C20H40O | Antimicrobial and antifungal[63] |
| 9,12,15-Octadecatrienoic acid | 17.796 | 3.85 | 278.4 | C18H30O2 | ALA – omega 3 fatty acid |
| Reduce blood clots[47] | |||||
| 2,6-Octadien-1-ol, 3,7-dimethyl | 18.241 | 0.46 | 308.5 | C20H36O2 | Antimicrobial[64] |
| Tetradecanoic acid, 2-hydroxy- | 18.64 | 0.46 | 244.37 | C14H28O3 | Antioxidant[65] |
| 17-Pentatriacontene | 18.696 | 1.97 | 490.9 | C35H70 | Antibacterial[66] |
| Vitamin E | 19.663 | 0.93 | 430.71 | C29H50O2 | Antioxidant[67] |
| Phenol, 2,4-bis(1-phenylethyl)- | 19.84 | 0.49 | 302.4 | C24H26O | Anti-inflammatory[68] |
| Xanthen-9-one, 1-hydroxy-3,5,8-trimethoxy- | 19.84 | 0.49 | 302.28 | C16H14O6 | Antimicrobial, Antioxidant, Anti-inflammatory[69] |
| Methanone, [1,4-dimethyl-7-(1-methylethyl)-2-azulenyl]phenyl- | 19.84 | 0.49 | 302.42 | C22H22O | Antimicrobial[70] |
| Phenol, 2,4-bis(1-phenylethyl)- | 20.318 | 0.8 | 302.4 | C22H22O | Antioxidant[71] |
| Xanthen-9-one, 1-hydroxy-3,5,8-trimethoxy | 20.318 | 0.8 | 302.28 | C16H14O6 | Antimicrobial, Antioxidant, Anti-inflammatory[69] |
| Ergosta-5,24-dien-3-ol, (3.beta.)- | 21.351 | 0.58 | 398.7 | C28H46O | Moderate cytotoxicity against the human foreskin fibroblast cell line (Hs27 cells)[72] |
| Ergost-5,8(14)-dien-3-ol | 21.351 | 0.58 | 398.7 | C28H46O | Immunosuppressive, anti-tumor[73] |
| Stigmasta-5,24(28)-dien-3-ol, (3.beta.,24Z) | 21.351 | 0.58 | 412.7 | C29H48O | Antioxidant, anti-inflammatory[74] |
| Pregnenolone | 21.985 | 0.5 | 316.47 | C29H32O2 | Anti-tumor[75] |
| 2,6,10,14,18,22-Tetracosahexaene, 2,6,10,15,19,23-hexamethyl-, (all-E)- | 22.329 | 0.57 | 410.71 | C30H50 | Antioxidant[59] |
| gamma.-Sitosterol | 22.784 | 17.01 | 432.7 | C29H52O2 | Anti-cancer[76] |
| Antibacterial[44] | |||||
| beta.-Sitosterol | 22.784 | 17.01 | 414.71 | C29H50O | |
| 26,26-Dimethyl-5,24(28)-ergostadien-3.beta.-ol | 22.973 | 1.94 | 426.7 | C30H50O | maintain cell membrane integrity[77] |
| beta.-Amyrin | 23.44 | 6.51 | 426.7 | C30H50O | Antimicrobial[44] |
| Alpha.-Amyrin | 23.44 | 6.51 | 426.7 | C30H50O | Antimicrobial[44] |
Note: RT: Retention Time and MW: Molecular Weight
Table 7: Compounds Analysed from GC-MS Analysis of Methanol Extract
In conclusion, the results of this study show the presence of phytochemicals such as flavonoids, tannins/phenolics, glycosides, and phlobatannins, higher phenolics and flavonoids content in both acetone and methanol extracts than in the other extracts. Higher antimicrobial, antioxidant and anti- inflammatory properties are associated with acetone and methanol extracts than the other extracts due to the presence of bioactive compounds illustrated in GC-MS analysis. Purification of most essential compound from the Ruellia patula leaves extract, investigating the wound healing properties by performing in vivo studies can be explored to bring natural product as a wound healing drug.
Acknowledgements:
Authors thank to the Department of Biotechnology, Mepco Schlenk Engineering College, Sivakasi, Tamil Nadu, India for providing facilities to conduct our experimental work.
Conflict of interests:
The authors declare that they have no competing interest.
References
- Molyneux RJ, Lee ST, Gardner DR, Panter KE, James LF. Phytochemicals: The good, the bad and the ugly? Phytochemistry 2007;68(22-24):2973-85.
[Crossref] [Google Scholar] [PubMed]
- Iwu MW, Duncan AR, Okunji CO. New antimicrobials of plant origin. In: Perspectives on New crops and New Uses. ASHS Press, Alexandr; 1999. p: 457-62.
- Koehn FE, Carter GT. The evolving role of natural products in drug discovery. Nat Rev Drug Discov 2005;4(3):206-20.
[Crossref] [Google Scholar] [PubMed]
- Kumaraswamy MV, Kavitha HU, Satish S. Antibacterial evaluation and phytochemical analysis of Betula utilis D. Don against some human pathogenic bacteria. World J Aricul Sci 2008;4(5):661-4.
- Parekh J, Chanda S. In vitro antibacterial activity of the crude methanol extract of Woodfordia fruticosa Kurz. flower (Lythraceae). Brazil J Microbiol 2007;38:204-7.
- Gnanavel R, Jose FC. Medicinal plant based antidote against snake bite by Irula tribes of Tamil Nadu, India. World J Pharm Sci 2014:1029-33.
- Akhtar MF, Rashid S, Ahmad M, Usmanghani K. Cardiovascular evaluation of Ruellia patula and Ruellia brittoniana. J Islamic Acad Sci 1992;5(1):67-71.
- Bhandari MM. Flora of the Indian desert. Jodhpur Rajasthan: MPS Reports; 1999; p. 26.
- Yadav S, Arya V, Kumar S, Yadav JP. Anti-inflammatory activity of root, leaves and stem of Dipteracanthus patulus (Jacq.) Nees (Acanthaceae). Asian Pacific J Tropical Biomed 2012;2(1):S187-91.
- Bowler PG, Duerden BI, Armstrong DG. Wound microbiology and associated approaches to wound management. Clin Microbiol Rev 2001;14(2):244-69.
- Bennett NT, Schultz GS. Growth factors and wound healing: Part II. Role in normal and chronic wound healing. Am J Surg 1993;166(1):74-81.
[Crossref] [Google Scholar] [PubMed]
- Mast BA, Schultz GS. Interactions of cytokines, growth factors, and proteases in acute and chronic wounds. Wound Repair Regen 1996;4(4):411-20.
[Crossref] [Google Scholar] [PubMed]
- Hong WX, Hu MS, Esquivel M, Liang GY, Rennert RC, McArdle A, et al. The role of hypoxia-inducible factor in wound healing. Adv Wound Care 2014;3(5):390-9.
[Crossref] [Google Scholar] [PubMed]
- Rodriguez PG, Felix FN, Woodley DT, Shim EK. The role of oxygen in wound healing: A review of the literature. Dermatol Surg 2008;34(9):1159-69.
[Crossref] [Google Scholar] [PubMed]
- Cano Sanchez M, Lancel S, Boulanger E, Neviere R. Targeting oxidative stress and mitochondrial dysfunction in the treatment of impaired wound healing: A systematic review. Antioxidants 2018;7(8):98.
[Crossref] [Google Scholar] [PubMed]
- Ponugoti B, Xu F, Zhang C, Tian C, Pacios S, Graves DT. FOXO1 promotes wound healing through the up-regulation of TGF-β1 and prevention of oxidative stress. J Cell Biol 2013;203(2):327-43.
[Crossref] [Google Scholar] [PubMed]
- Dunnill C, Patton T, Brennan J, Barrett J, Dryden M, Cooke J, et al. Reactive oxygen species (ROS) and wound healing: The functional role of ROS and emerging ROS‐modulating technologies for augmentation of the healing process. Int wound J 2017;14(1):89-96.
[Crossref] [Google Scholar] [PubMed]
- Thakur R, Jain N, Pathak R, Sandhu SS. Practices in wound healing studies of plants. Evid Based Complement Alternat Med 2011;2011.
[Crossref] [Google Scholar] [PubMed]
- Pandey A, Tripathi S. Concept of standardization, extraction and pre phytochemical screening strategies for herbal drug. J Pharmacog Phytochem 2014;2(5):115-9.
- Kannikaparameswari N, Chinnaswamy P. Identification and quantification of lupeol in Dipteracanthus patulus (Jacq.) Nees by high performance liquid chromatography-photo diode array method. Int J Pharma Bio Sci 2013;4(4).
- Kumar GS, Jayaveera KN, Kumar CK, Sanjay UP, Swamy BM, Kumar DV. Antimicrobial effects of Indian medicinal plants against acne-inducing bacteria. Tropical J Pharma Res 2007;6(2):717-23.
[Crossref] [Google Scholar] [PubMed]
- Ainsworth EA, Gillespie KM. Estimation of total phenolic content and other oxidation substrates in plant tissues using Folin–Ciocalteu reagent. Nat Protocols 2007;2(4):875-7.
[Crossref] [Google Scholar] [PubMed]
- de Souza Corrêa JG, Bianchin M, Lopes AP, Silva E, Ames FQ, Pomini AM, et al. Chemical profile, antioxidant and anti-inflammatory properties of Miconia albicans (Sw.) Triana (Melastomataceae) fruits extract. J Ethnopharmacol 2021;273:113979.
[Crossref] [Google Scholar] [PubMed]
- Bhalodia NR, Shukla VJ. Antibacterial and antifungal activities from leaf extracts of Cassia fistula l.: An ethnomedicinal plant. J Adv Pharm Technol Res 2011;2(2):104.
[Crossref] [Google Scholar] [PubMed]
- Balouiri M, Sadiki M, Ibnsouda SK. Methods for in vitro evaluating antimicrobial activity: A review. J Pharm Anal 2016;6(2):71-9.
[Crossref] [Google Scholar] [PubMed]
- Blois MS. Antioxidant determinations by the use of a stable free radical. Natur 1958;181(4617):1199-200.
- Padmanabhan P, Jangle SN. Evaluation of in vitro anti-inflammatory activity of herbal preparation, a combination of four medicinal plants. Int J Basic Appl Med Sci 2012;2(1):109-16.
- Gunathilake KD, Ranaweera KK, Rupasinghe HP. Influence of boiling, steaming and frying of selected leafy vegetables on the in vitro anti-inflammation associated biological activities. Plants 2018;7(1):22.
[Crossref] [Google Scholar] [PubMed]
- Singh G, Kumar P. Extraction, gas chromatography–mass spectrometry analysis and screening of fruits of Terminalia chebula Retz. for its antimicrobial potential. Pharmacognosy Res 2013;5(3):162.
[Crossref] [Google Scholar] [PubMed]
- Farnsworth NR. Biological and phytochemical screening of plants. J Pharm Sci 1966;55(3):225-76.
[Crossref] [Google Scholar] [PubMed]
- Emran TB, Nasir Uddin MM, Rahman A, Uddin Z, Islam M. Phytochemical, antimicrobial, cytotoxic, analgesic and anti-inflammatory properties of Azadirachta indica: A therapeutic study. J Bioanal Biomed S 2015;12:2.
- Roginsky V, Lissi EA. Review of methods to determine chain-breaking antioxidant activity in food. Food Chem 2005;92(2):235-54.
- Faheem Ahmed, Moshin Iqbal. Antioxidant activity of Ricinus Communis. Organ Med Chem IJ 2018;5(4):555667.
- Moon JK, Shibamoto T. Antioxidant assays for plant and food components. J Agric Food Chem 2009;57(5):1655-66.
[Crossref] [Google Scholar] [PubMed]
- Ahmad I. Shagufta. Sulfones: An important class of organic compounds with diverse biological activities. Int J Pharm Pharm Sci 2015;7(3):19-27.
- Premjanu N, Jaynthy C. Antimicrobial activity of diethyl phthalate: An in silico approach. Asian J Pharm Clin Res 2014;7(4):141-2.
- Belakhdar G, Benjouad A, Abdennebi EH. Determination of some bioactive chemical constituents from Thesium humile Vahl. J Mater Environ Sci 2015;6(10):2778-83.
- Chowdhury SK, Dutta T, Chattopadhyay AP, Ghosh NN, Chowdhury S, Mandal V. Isolation of antimicrobial tridecanoic acid from Bacillus sp. LBF-01 and its potentialization through silver nanoparticles synthesis: A combined experimental and theoretical studies. J Nanostruct Chem 2021;11(4):573-87.
- Mou Y, Meng J, Fu X, Wang X, Tian J, Wang M, et al. Antimicrobial and antioxidant activities and effect of 1-hexadecene addition on palmarumycin C2 and C3 yields in liquid culture of endophytic fungus Berkleasmium sp. Dzf12. Molecules 2013;18(12):15587-99.
[Crossref] [Google Scholar] [PubMed]
- Premathilaka R, Silva M. Bioactive compounds and antioxidant activity of Bunchosia armenica. World J Pharm Pharm Sci 2016;5:1237-47.
- Mahmoodi A, Roomiani L, Soltani M, Basti AA, Kamali A, Taheri S. Chemical composition and antibacterial activity of essential oils and extracts from Rosmarinus officinalis, Zataria multiflora, Anethum graveolens and Eucalyptus globulus. Global Veterinaria 2012;9(1):73-9.
- Shoaib M, Aygun AI, Ganbarov K. Cyclohexane and its functionally substituted derivatives: Important class of organic compounds with potential antimicrobial activities. J Microbiol Biotechnol Food Sci 2019;9(1):84-7.
- El-Din SM, El-Ahwany AM. Bioactivity and phytochemical constituents of marine red seaweeds (Jania rubens, Corallina mediterranea and Pterocladia capillacea). J Taibah Univ Sci 2016;10(4):471-84.
- Duke J, Bogenschutz MJ. Dr. Duke's phytochemical and ethnobotanical databases. Washington, DC: USDA, Agricultural Research Service; 1994.
- Agoramoorthy G, Chandrasekaran M, Venkatesalu V, Hsu MJ. Antibacterial and antifungal activities of fatty acid methyl esters of the blind-your-eye mangrove from India. Brazilian J Microbiol 2007;38:739-42.
- Ghazala B, Naila B, Shameel MU, Shahzad SA, Leghari SM. Phycochemistry and bioactivity of two stonewort algae (Charophyta) of Sindh. Pak J Bot 2004;36(4):733-43.
- Siswadi S, Saragih GS. Phytochemical analysis of bioactive compounds in ethanolic extract of Sterculia quadrifida R. Br. In: AIP Conference Proceedings 2021;2353(1):2-8. AIP Publishing. [Crossref] [Google Scholar] [PubMed]
- Chan WK, Tan LT, Chan KG, Lee LH, Goh BH. Nerolidol: A sesquiterpene alcohol with multi-faceted pharmacological and biological activities. Molecules 2016;21(5):529.
[Crossref] [Google Scholar] [PubMed]
- Hatami S, Sani AM, Yavarmanesh M. Chemical composition and antibacterial activity of organic extra virgin olive oil from Iran. Nutr Food Sci 2016;46(3):388-95.
- Islam MT, Ali ES, Uddin SJ, Shaw S, Islam MA, Ahmed MI, et al. Phytol: A review of biomedical activities. Food Chem Toxicol 2018;121:82-94.
- Linton RE, Jerah SL, Bin Ahmad I. The effect of combination of octadecanoic acid, methyl ester and ribavirin against measles virus. Int J Sci Tech Res 2013;2(10):181-4.
- Do TQ, Moshkani S, Castillo P, Anunta S, Pogosyan A, Cheung A, et al. Lipids including cholesteryl linoleate and cholesteryl arachidonate contribute to the inherent antibacterial activity of human nasal fluid. J Immunol 2008;181(6):4177-87.
[Crossref] [Google Scholar] [PubMed]
- Javid S, Purohit MN, Yogish Kumar H, Ramya K, Mithuna NF, Salahuddin MD, et al. Semisynthesis of myristic acid derivatives and their biological activities: A critical insight. J Biol Active Prod Nat 2020;10(6):455-72.
- Faridha Begum I, Mohankumar R, Jeevan M, Ramani K. GC–MS analysis of bio-active molecules derived from Paracoccus pantotrophus FMR19 and the antimicrobial activity against bacterial pathogens and MDROs. Indian J Microbiol 2016;56:426-32.
[Crossref] [Google Scholar] [PubMed]
- Zellagui A, Gherraf N, Ladjel S, Hameurlaine S. Chemical composition and antibacterial activity of the essential oils from Launaea resedifolia L. Organic Med Chem Lett 2012;2:1-4.
[Crossref] [Google Scholar] [PubMed]
- Huang L, Zhu X, Zhou S, Cheng Z, Shi K, Zhang C, et al. Phthalic acid esters: Natural sources and biological activities. Toxins 2021;13(7):495.
- Khan I, Javaid A. Identification of biologically important compounds in neem leaves through GC-MS analysis. Jordan J Pharm Sci 2021;14(3):359-66.
- Guerrero RV, Vargas RA, Petricevich VL. Chemical compounds and biological activity of an extract from bougainvillea x buttiana (var. rose) holttum and standl. Int J Pharm Pharm Sci 2017;9(3):42-6.
- Dhankhar S, Dhankhar S, Ruhil S, Balhara M, Malik V, K Chhillar A. Isolation and biological evaluation of novel Tetracosahexaene hexamethyl, an acyclic triterpenoids derivatives and antioxidant from Justicia adhatoda. Comb Chem High Throughput Screen 2014;17(8):723-32.
[Crossref] [Google Scholar] [PubMed]
- Ghasemi Pirbalouti A, Fatahi-Vanani M, Craker L, Shirmardi H. Chemical composition and bioactivity of essential oils of Hypericum helianthemoides. Hypericum perforatum and Hypericum scabrum. Pharm Biol 2014;52(2):175-81.
[Crossref] [Google Scholar] [PubMed]
- Jaradat N, Adwan L, K’aibni S, Zaid AN, Shtaya MJ, Shraim N, et al. Variability of chemical compositions and antimicrobial and antioxidant activities of Ruta chalepensis leaf essential oils from three Palestinian regions. BioMed Res Int 2017;2017:2672689.
[Crossref] [Google Scholar] [PubMed]
- Shaaban MT, Ghaly MF, Fahmi SM. Antibacterial activities of hexadecanoic acid methyl ester and green‐synthesized silver nanoparticles against multidrug‐resistant bacteria. J Basic Microbiol 2021;61(6):557-68.
[Crossref] [Google Scholar] [PubMed]
- Tao R, Wang CZ, Kong ZW. Antibacterial/antifungal activity and synergistic interactions between polyprenols and other lipids isolated from Ginkgo biloba L. leaves. Molecules 2013;18(2):2166-82.
[Crossref] [Google Scholar] [PubMed]
- Al-Marzoqi AH, Hameed IH, Idan SA. Analysis of bioactive chemical components of two medicinal plants (Coriandrum sativum and Melia azedarach) leaves using gas chromatography-mass spectrometry (GC-MS). Afr J Biotechnol 2015;14(40):2812-30.
- Ayad R, Akkal S. Phytochemistry and biological activities of algerian Centaurea and related genera. Studies Nat Prod Chem 2019;63:357-414.
- Albratty M, Alhazmi HA, Meraya AM, Najmi A, Alam MS, Rehman Z, et al. Spectral analysis and Antibacterial activity of the bioactive principles of Sargassum tenerrimum J. Agardh collected from the Red sea, Jazan, Kingdom of Saudi Arabia. Brazilian J Biol 2021;83.
[Crossref] [Google Scholar] [PubMed]
- Niki E. Evidence for beneficial effects of vitamin E. Korean J Intern Med 2015;30(5):571.
[Crossref] [Google Scholar] [PubMed]
- Chen JJ, Chen PH, Liao CH, Huang SY, Chen IS. New phenylpropenoids, bis (1-phenylethyl) phenols, bisquinolinone alkaloid, and anti-inflammatory constituents from Zanthoxylum integrifoliolum. J Nat Prod 2007;70(9):1444-8.
[Crossref] [Google Scholar] [PubMed]
- Shi G, Lu R, Yang Y, Li C, Yang A, Cai L. Crystal structure of 1, 5, 8-trihydroxyl-3-methoxy xanthone from Swertia chirayita. J Chem Crystallogr 2005;35(2):135-9.
[Crossref] [Google Scholar] [PubMed]
- Padmini R, Maheshwari VU, Saravanan P, Lee KW, Razia M, Alwahibi MS, et al. Identification of novel bioactive molecules from garlic bulbs: A special effort to determine the anticancer potential against lung cancer with targeted drugs. Saudi J Biol Sci 2020;27(12):3274-89.
[Crossref] [Google Scholar] [PubMed]
- Kurian GA, Suryanarayanan S, Raman A, Padikkala J. Antioxidant effects of ethyl acetate extract of Desmodium gangeticum root on myocardial ischemia reperfusion injury in rat hearts. Chin Med 2010;5(1):1-7.
[Crossref] [Google Scholar] [PubMed]
- Viegelmann C, Parker J, Ooi T, Clements C, Abbott G, Young L, et al. Isolation and identification of antitrypanosomal and antimycobacterial active steroids from the sponge Haliclona simulans. Mar Drugs 2014;12(5):2937-52.
[Crossref] [Google Scholar] [PubMed]
- Yang B, Miller PA, Möllmann U, Miller MJ. Syntheses and biological activity studies of novel sterol analogs from nitroso diels− alder reactions of ergosterol. Org Lett 2009;11(13):2828-31.
[Crossref] [Google Scholar] [PubMed]
- Kaur N, Chaudhary J, Jain A, Kishore L. Stigmasterol: A comprehensive review. Int J Pharm Sci Res 2011;2(9):2259.
- Iqbal A, Siddiqui T. A review on synthesis and biological activities of D-ring modified pregnenolone. Steroids 2021;170:108827.
- Tripathi NI, Kumar S, Singh RA, Singh CJ, Singh PR, Varshney VK. Isolation and Identification of γ-sitosterol by GC-MS from Roots of Girardinia heterophylla. Orient J Chem 2013;29(2):705-7.
- Fais A, Delogu GL, Floris S, Era B, Medda R, Pintus F. Euphorbia characias: Phytochemistry and biological activities. Plants 2021;10(7):1468.
[Crossref] [Google Scholar] [PubMed]
- Arirudran B, Saraswathy A, Krishnamurthy V. Antimicrobial activity of Ruellia tuberosa L.(whole plant). Pharmacogn J 2011;3(23):91-5.
- Alam MA, Subhan N, Awal MA, Alam MS, Sarder M, Nahar L, Sarker SD. Antinociceptive and anti-inflammatory properties of Ruellia tuberosa. Pharm Biol 2009;47(3):209-14.

 Methanol

 Methanol
 Linear (Acetone)
 Aqueous