- *Corresponding Author:
- H. L. Hong
Inner Mongolia Engineering Research Center for CO2 Capture and Utilization, Hohhot 010051, China
E-mail: honghailong_1979@163.com
| Date of Submission | 07 May 2018 |
| Date of Revision | 10 August 2018 |
| Date of Acceptance | 29 January 2019 |
| Indian J Pharm Sci 2019;81(2):249-258 |
This is an open access article distributed under the terms of the Creative Commons Attribution-NonCommercial-ShareAlike 3.0 License, which allows others to remix, tweak, and build upon the work non-commercially, as long as the author is credited and the new creations are licensed under the identical terms
Abstract
The aim of this study was to increase the water solubility of tosufloxacin tosylate by inclusion with hydroxypropyl-β-cyclodextrin. The tosufloxacin tosylate/hydroxypropyl-β-cyclodextrin inclusion complex was characterized by differential scanning calorimetry, powder X-ray diffractometry, and scanning electron microscopy. Fourier-transform infrared spectroscopy, nuclear magnetic resonance and 2D ROSEY were used to identify the interaction of tosufloxacin tosylate and hydroxypropyl-β-cyclodextrin. Results obtained confirmed the formation of tosufloxacin tosylate/ hydroxypropyl-β-cyclodextrin inclusion complex. In addition, the dissolution and stability of the complex was also evaluated, which indicated that the water solubility and stability of tosufloxacin tosylate were significantly increased in the presence of hydroxypropyl-β-cyclodextrin. Furthermore, dissolution assay showed that the dissolution of tosufloxacin tosylate/hydroxypropyl-β-cyclodextrin inclusion complex was higher than that of a physical mixture or tosufloxacin tosylate alone. These results demonstrated that hydroxypropyl-β-cyclodextrin could be potentially beneficial in the delivery of water-insoluble tosufloxacin tosylate.
Keywords
Tosufloxacin tosylate, hydroxypropyl-β-cyclodextrin, inclusion complex, solubility, dissolution
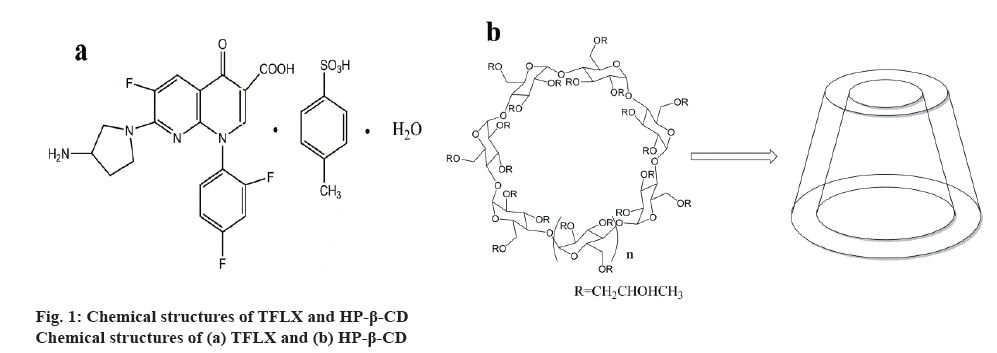
Tosufloxacin tosylate (TFLX) is a fluoroquinolone antibacterial agent developed in Japan. The first clinical study of TFLX was reported in 1986 [1], and it was commercially available in 1990[2] (fig. 1a). Compared to traditional quinolone antibiotics such as ofloxacin and ciprofloxacin, TFLX possessed strong antiinflammatory and a broader spectrum of antibacterial activity [2]. TFLX has been reported to be effective against Grampositive, Gram-negative, and anaerobic bacteria, as well as chlamydia and mycoplasma [3]. In the past twenty years, TFLX has been approved for the treatment of respiratory infections, gastrointestinal infections, urinary tract infections, hepatobiliary infections, chlamydia trachomatis, infectious diseases in the field of plastic surgery, typhoid fever, paratyphoid fever and sepsis, meningitis, endocarditis [4,5].
Human gastric acidity changes frequently due to food consumption or physiological factors. In particular, for the elderly who mostly suffer from gastric acid deficiency, the dissolved drug in the stomach would decrease leading to reduced bioavailability [5]. TFLX exhibited very low solubility in water and as the age increases, the gastric acid environment presents a decreasing trend, which leads to a further decrease in oral bioavailability of TFLX in humans [6]. Therefore, it is crucial to introduce ways to improve the solubility of TFLX. A variety of strategies have been explored to improve the solubility and bioavailability of insoluble small molecule drugs, such as preparation of nanoparticles, inclusion with cyclodextrins (CDs), amorphous solid dispersions, surface modification and micronization [7,8]. Among these methods, CDs have been widely used as a solubilizing carrier to improve the dissolution of poorly soluble drugs [9,10]. However, usage of natural CDs have some drawbacks like low aqueous solubility and nephrotoxicity, which limit its practical application [11,12].
In order to overcome these shortcomings of natural CDs, a series of CD derivatives have been synthesized. CDs consist of α-CD, β-CD and γ-CD, which contain six, seven and eight D-(+)-glucopyranose units, respectively [13,14]. β-CD, especially the hydroxypropyl- β-cyclodextrin (HP-β-CD) is frequently used to improve the water solubility of insoluble compounds [15,16] (figure 1b). Compared to β-CD, HP-β- CD has low surface activity and haemolytic activity, excellent stability, strong solubilizing power and nonirritant to muscles. It can also be used for intravenous injection [17,18]. Moreover, the HP-β-CD cavity is internally hydrophobic and externally hydrophilic [19]. This property permits the full or partial encapsulation of a drug of appropriate size and shape by hydrophobic forces and van der Waals forces without altering the hydrophilicity of HP-β-CD itself [20,21]. Thus, the inclusion complexes with HP-β-CD could increase the solubility and stability, mask unpleasant taste, reduce adverse reactions, and improve bioavailability of the drug [22,23].
To improve the water solubility and dissolution rate of TFLX, TFLX/HP-β-CD inclusion complex was prepared in this study using the solvent evaporation method. The prepared complex was extensively characterized using a variety of techniques and the mechanism of inclusion was studied by 1H nuclear magnetic resonance (NMR) and 2D ROSEY. In addition, the dissolution and stability of the complex were also investigated.
Materials and Methods
TFLX was purchased from Chifeng Wanze Pharmaceutical Co., Ltd. (Chifeng China). HP-β- CD was purchased from Shandong Binzhou Zhiyuan Biotechnology Co., Ltd. (Binzhou, China). All other reagents and solvents were of analytical grade, purchased from Tianjin Fengchuan Chemical Reagent Technology Co., Ltd. (Tianjin, China) and used without further purification. Double-distilled water was used throughout the experiments.
Preparation of inclusion complex:
HP-β-CD and TFLX were completely dissolved in distilled water and methanol, respectively. The TFLX methanol solution was added dropwise into HP-β-CD solution, and the mixed solution was stirred for 1 h at 70° on a magnetic stirrer (80 rpm). Methanol was subsequently removed on a rotary evaporator at 40- 50° under vacuum and the residual solution was frozen overnight. After filtration, the resultant clear solution was evaporated on a rotary evaporator at 70° under vacuum and the obtained solid inclusion complex was further dried in a vacuum desiccator [24].
Preparation of physical mixture:
A physical mixture consisting of TFLX and HP-β-CD in the molar ratio of 1:1 was prepared. TFLX and HP- β-CD were admixed together in a mortar and pestle for 10 min to obtain a homogeneous blend.
UV spectroscopy measurement:
UV/Vis spectrophotometer (UV-2450, Shimadzu, Japan) equipped with a 1 cm quartz cuvette was used to determine the concentration of TFLX. The wavelength range employed is 200 to 500 nm. It was first demonstrated that HP-β-CD would not interfere with the detection of TFLX on the UV-2450. TFLX (2.677 mg) was placed in a 50 ml volumetric flask and dissolved in anhydrous methanol to the mark. Then the solution was diluted into various concentrations (2.14, 4.28, 8.57, 12.85, 17.13 μg/ml) with anhydrous methanol. The accurate contents of TFLX in each solution were examined by determining the absorption at wavelength 269 nm. A good linear relationship was observed in the range of 2-17 μg/ml. The concentration of TFLX was calculated according to the standard calibration curve: y = 0.0691x–0.0023 (R2=0.9999).
Phase solubility study:
To verify the feasibility of the inclusion process, phase solubility studies were performed according to the method established by Higuchi and Connors [25]. In brief, excess amounts of TFLX were added into 50 ml aqueous HP-β-CD solutions with different concentrations (0, 2, 4, 8, 12, 16, 20 mM). The suspensions obtained were shaken on a constant temperature water bath (15 rpm) at 30, 40, 50, 60° for 24 h, respectively. After reaching equilibrium, solutions were filtered through a 0.22 μm membrane filter to remove the excess TFLX. The absorbance was measured at 269 nm using UV/Vis spectrophotometer. The phase solubility curve was obtained by plotting the concentration of TFLX (Ct) and HP-β-CD (Cc). The stability constant (KC) for inclusion complex can be calculated from the slope of the linear portion of the phase solubility diagrams, according to the following Eqn. 1 [26], KC = slope/S0(1−slope), where, S0 is the intrinsic solubility of TFLX in the absence of HP-β-CD. The change in enthalpy (ΔH) after complex formation was calculated using Van’t Hoff Eqn. 2 [27], ln KC = –ΔH/RT+ –ΔS/R. The change in Gibbs free energy (ΔG) and in entropy (ΔS) upon complex formation was calculated using the Eqns. 3 and 4 [28], ΔG = ΔH–TΔS and ΔS = (ΔH–ΔG)/T, respectively.
Solubility study:
Solubility studies were performed according to previously reported methods [29,30]. In short, excess amounts of TFLX were added into 10 ml of distilled water, and the suspensions were stirred on a magnetic stirrer at 37° for 24 h. After equilibrium was reached, samples were filtered to remove the excess TFLX. One millilitre of the supernatant was placed into a 50 ml volumetric flask, dilute to the mark with distilled water and the absorbance was measured. The concentration of TFLX was determined by the standard calibration curve of TFLX. A similar process was used to investigate the solubility of the inclusion compound.
In vitro dissolution test:
The dissolution study was conducted in phosphate buffer (pH 6.8 consisting of 0.2 M monopotassium phosphate and 0.2 M sodium hydroxide, pH 7.4 consisting of 2 M disodium hydrogen phosphate and 3 M sodium dihydrogen phosphate, 37±0.5°, V= 1000 ml) using a RCZ-8 M dissolution tester (TDTF Technology Co., Ltd., China) with a paddle rotation at 100 rpm. The samples (TFLX, physical mixture and TFLX/ HP-β-CD inclusion complex), containing an equivalent of 5 mg TFLX, were withdrawn at predetermined time intervals (2, 5, 8, 11, 15, 20, 30, 40, 55, 75 and 105 min). Each sample solution (10 ml) was passed through a 0.45 μm Millipore filter and analysed by UV- 2450 as described above to determine the dissolution rate of TFLX.
Powder X-ray diffractometry (PXRD):
The PXRD of the different samples were obtained on a Bruker X-ray diffractometer (model D8 Advance, German) with Cu Kα radiation. All samples were measured in 2θ angle range between 5° and 80°. The step scan mode was performed by a step size of 0.02° at a rate of 5°/min. The current used was 40 mA and the voltage was 40 kV.
Scanning electron microscopy (SEM):
Microscopic morphological structures of the raw materials, physical mixture and inclusion complex were investigated and photographed using scanning electron microscope (Hitachi S-4800, Japan). The samples were manually dispersed on an aluminium flake with a thin self-adhered film.
Differential scanning calorimetry (DSC):
The DSC curves of the raw materials, physical mixture and inclusion complex were recorded using DSC (Heng jiu, DSC-100, China). Analysis was performed for 4.0 mg samples at a temperature heating rate of 10°/min and a temperature range of 25-600°.
Fourier-transform infrared spectroscopy (FTIR):
FTIR spectra were obtained on the FTIR spectrometer (PerkinElmer Spectrum Two, USA) according to the potassium bromide (KBr) tablet method. KBr disks of samples were prepared using 1 mg of complex and 100 mg KBr. The spectral measurements were recorded in the scanning range of 4000-400 cm-1 at room temperature.
1H NMR and 2D rotating frame nuclear Overhauser effect spectroscopy (ROESY):
1H NMR and 2D ROESY spectra were obtained on an Inova 500 MHz NMR spectrometer (Varian, USA). HP-β-CD, TFLX/HP-β-CD inclusion complex, TFLX were dissolved in D2O, D2O and DMSO-d6, DMSO-d6, respectively. Chemical shifts were reported in ppm with tetramethylsilane (TMS) as the internal standard.
Results and Discussion
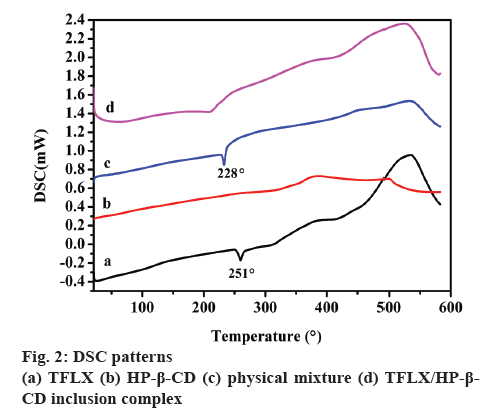
The DSC thermograms of TFLX, HP-β-CD, physical mixture and TFLX/HP-β-CD inclusion complex are shown in figure 2. The DSC thermogram of TFLX (figure 2a) displayed a sharp endothermic peak at around 251°, corresponding to the melting point of TFLX in the range of 251-252°[3]. HP-β-CD is a macromolecular mixture without a fixed absorption exothermic peak (figure 2b). The sharp endothermic peak at around 228° in the thermogram of the physical mixture of TF and HP-β-CD (figure 2c) was lower than that of TFLX alone, indicating the presence of a physical mixture, because the melting point of the mixture is always lower than that of the single substance. However, a lower melting point peak than the physical mixture was observed in the TFLX/HP-β-CD inclusion complex thermogram (figure 2d), suggesting that the interaction between TFLX and HP-β-CD may form inclusion complexes.
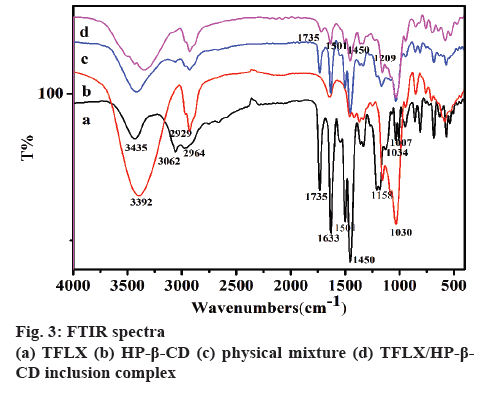
FTIR spectrum is an effective means to identify the functional groups of a compound. The FTIR spectra and data of TFLX, HP-β-CD, physical mixture and TFLX/ HP-β-CD inclusion complex are shown in figure 3. The spectrum of TFLX (figure 3a) exhibited large adsorption bands in the range of 3435-3062, 2964, 1735-1633, and 1501-1007 cm-1. The peak at 3435 cm-1 corresponds to amino (-NH2) stretching vibration and the 3062 cm-1 peak corresponds to C-H stretching vibration on benzene ring. The absorption peak at 2964 cm-1 is C-H stretching vibration on methyl or methylene groups.The sharp characteristic absorption peaks at 1501 and 1450 cm-1 represent the stretching vibration of C = C on benzene ring and the peaks in the region of 1034- 1007 cm-1 represent vibration of C-F. In the spectrum of HP-β-CD (figure 3b), the intense broad characteristic peak at 3392 cm-1 is the free stretching vibration of hydroxyl (-OH). The vibration of -CH3 and -CH could be observed at 2929 cm-1. The strong band in the region of 1158-1030 cm-1 is attributed to the C-O stretching vibration [31]. The spectrum of physical mixture (figure 3c) was equivalent to the superposition of the spectra of TFLX and HP-β-CD, indicating there is no interaction between TFLX and HP-β-CD. However, the spectrum of TFLX/HP-β-CD inclusion complexes (figure 3d) showed significant changes. The absorption peaks at 3435 and 3062 cm-1 disappeared compared with that of TFLX, which indicated the -NH2 group was entrapped in the cyclodextrin cavity. The characteristic peaks at 2964, 1735, 1501, 1450 and 1209 cm-1 of TFLX/HP- β-CD inclusion complex were obviously reduced, indicating hydrogen bond formation between TFLX and HP-β-CD. Moreover, comparison of the peaks of HP-β-CD in the inclusion complex and HP-β-CD along shows apparent differences, but the overall change is not significant, indicating that only part of the cyclodextrin interacted with TFLX.
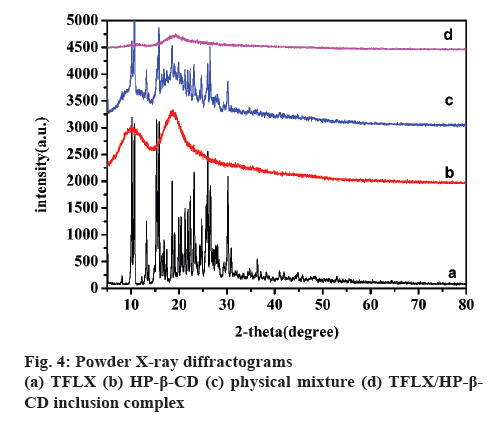
PXRD is an effective method for the detection of microcrystalline or amorphous states of inclusion complex [32]. The PXRD spectra of TFLX, HP-β- CD, physical mixture and TFLX/HP-β-CD inclusion complex are shown in figure 4. The powder diffraction pattern of TFLX (figure 4a) displayed characteristic peaks at diffraction angels (2θ) of 10.6, 15.7, 18.5, 23.4, 26.0, 30.1, 36.3, indicating that the drug is present in crystalline state. On the contrary, HP-β-CD (figure 4b) showed no characteristic diffraction peaks, indicating that cyclodextrin exists in a form of amorphous powder. The diffraction pattern of the physical mixture (figure 4c) apparently consisted of the superimposed diffraction peaks of TFLX and HP-β-CD, in which the intensity of the characteristic peaks of TFLX decreased, but the position of the characteristic peaks basically did not change, indicating that there was no interaction between TFLX and HP-β-CD in the physical mixture. Compared with the diffraction patterns of pure TFLX, the diffraction pattern of TFLX/HP-β-CD inclusion complex (figure 4d) was similar to the diffraction peaks of amorphous HP-β-CD and the obvious characteristic crystalline peaks of TFLX disappeared, suggesting that new complexes were formed and they were in amorphous state, which was in accordance with the DSC results.
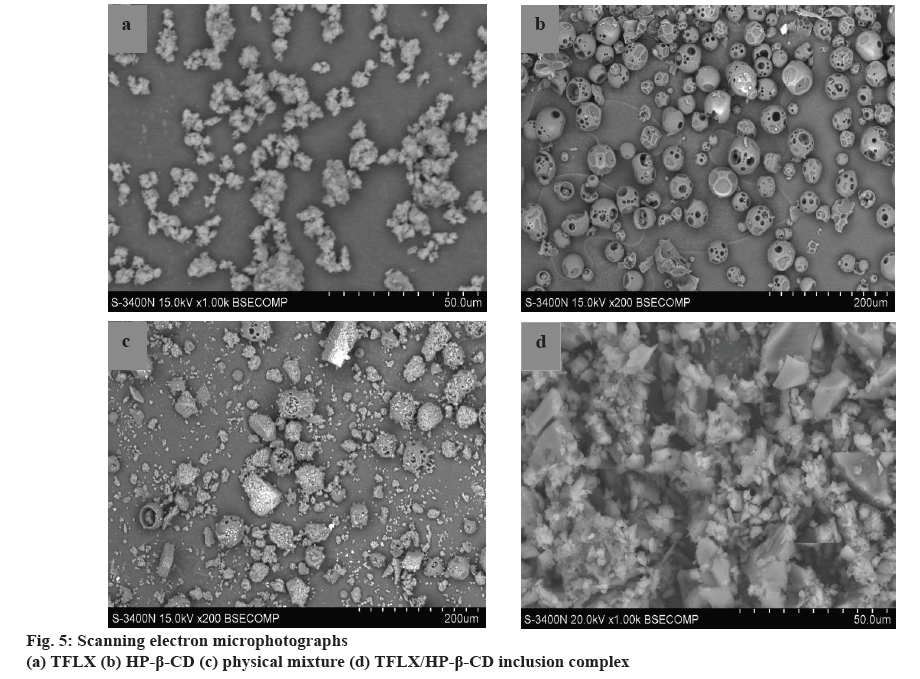
SEM is used to visualize the surface micro-morphology of complex compounds [32]. The SEM photographs of TFLX, HP-β-CD, physical mixture and TFLX/HP-β- CD inclusion complex are shown in figure 5. SEM revealed that pure TFLX presented a uniform distribution of snow flake-like crystals (figure 5a), and HP-β-CD appeared as spherical particles with cavity structures (figure 5b). SEM of the physical mixture revealed a mixture of TFLX and HP-β-CD spherical particles and the spherical cavity was filled with raw materials (figure 5c). The inclusion complex (figure 5d) consisted of compact and irregular blocky particles and exhibits shape alteration of HP-β-CD from the external, which confirmed the formation of the inclusion complex of TFLX and HP-β-CD.
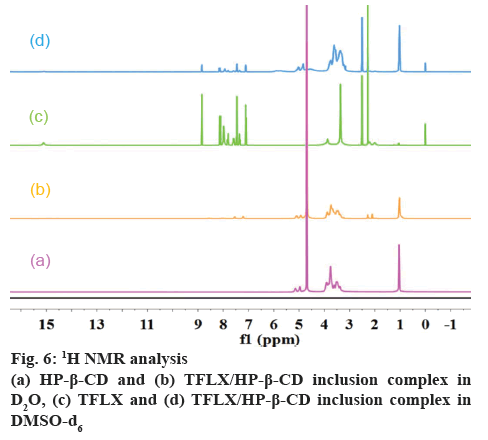
NMR spectroscopy is a powerful tool for the qualitative study of the interactions between host and guest molecules such as CDs inclusion complex by providing detailed information on molecular structure and molecular dynamics [33]. The 1H NMR spectra of HP-β- CD and TFLX/HP-β-CD inclusion complex are shown in figure 6a and b. The changes of chemical shift of HP-β- CD (in D2O) in the free and complex states are shown in Table 1, where Δδ = δ(complex)–δ(free). The positive and negative chemical shifts indicate the protons are shifted to downfield and upfield, respectively.
| HP-β-CD | δ (Free) | δ (Complex) | Δ (ppm) |
|---|---|---|---|
| H-1 | 5.151 | 5.095 | -0.056 |
| H-2 | 3.392 | 3.370 | -0.022 |
| H-3 | 3.905 | 3.730 | -0.175 |
| H-4 | 3.375 | 3.282 | -0.093 |
| H-5 | 3.610 | 3.452 | -0.158 |
| H-6 | 3.757 | 3.675 | -0.082 |
Table 1: Chemical Shift Changes of HP-β-CD in the Free and Complex States
Obvious upfield shifts (–0.175 and –0.158 ppm) were observed for the H-3 and H-5 protons located within the HP-β-CD cavity. However, there were minimal shifts for the H-1, H-2 and H-4 protons (–0.056, –0.022 and –0.093 ppm, respectively) outside the HP-β-CD cavity. These results suggested that TFLX was trapped in the cavity of HP-β-CD. It has been recognized that H-5 protons are close to the narrow side and H-3 protons are close to the wide side of the HP-β-CD cavity, as displayed in fig. 1b. Because a larger chemical shift was found for H-3 (–0.175 ppm) than H-5 (–0.158 ppm), it was deduced that TFLX was inserted from the wide side of the HP-β-CD cavity [33].
In addition, the 1H NMR spectra of TFLX alone and in complex with HP-β-CD (figure 6) were obtained and compared. Due to its poor water solubility, DMSO-d6 was used as the solvent. As shown in figure 6, some TFLX proton signals in the region of 2.0-5.1 ppm were covered by HP-β-CD signals. Furthermore, a significant change in peak shape in the region of 3.8- 8.1 ppm was observed, indicating that the aromatic rings of TFLX were incorporated within the cavity. The aromatic ring A and aromatic ring B showed the most strong interactions with the hydrophobic cavity of HP-β-CD, based on the largest downfield shift: (Δδ = 0.001–0.005 ppm and Δδ = 0.002–0.018 ppm). Also, clear chemical shift changes of pyridine ring and methyl protons (0.002-0.017 ppm and 0.108 ppm) attached to aromatic ring A was observed.
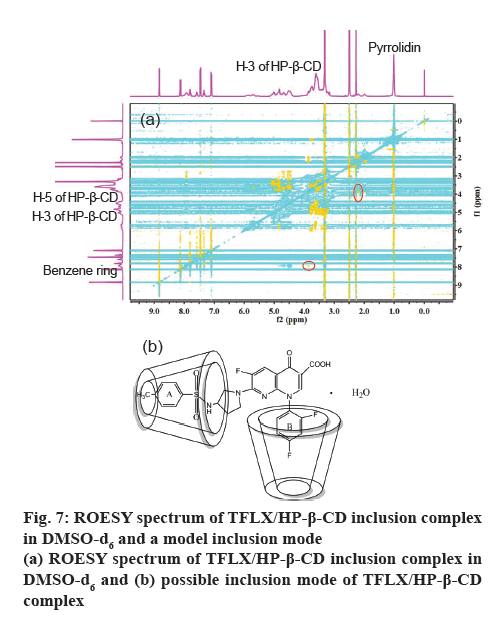
The 2D ROESY spectrum is an effective method for studying the spatial conformation of cyclodextrin inclusions. Dipole interactions less than 3.0-4.0 Å between protons are detected as cross peaks in the ROESY spectrum [34]. From figure 7a, it can be seen that the pyrrolidine/benzene ring protons of TFLX was related to the H-3 proton of HP-β-CD, while the crosspeaks with the H-5 proton of HP-β-CD was difficult to observe. This confirms the changes in the chemical shifts of the major functional groups in the NMR data. According to the 1H NMR and 2D ROESY spectral analysis demonstrated that the phenyl group A and phenyl group B of TFLX were profoundly inserted into the cavity of HP-β-CD. A proposed model for the TFLX/HP-β-CD inclusion complex is illustrated in figure 7b.
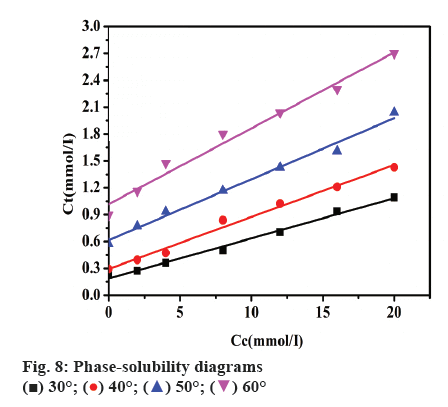
The phase solubility of TFLX in HP-β-CD solution was investigated by gently shaking the vials containing an excess amount of TFLX in 0 to 20 mM HP-β- CD solutions at 30, 40, 50, 60°, respectively. The phase solubility diagram is presented in figure 8. The concentration of TFLX (Ct) increased linearly with increasing HP-β-CD concentration (Cc) in the lower concentration range. The phase solubility curve was linear AL type as classified by Higuchi and Connors [25], which suggested that the complex was 1:1 stoichiometry within the tested concentration range of HP-β-CD (0-20 mmol/l). The stability constant K1:1 of TFLX/ HP-β-CD complex was calculated from the slope of the linear phase solubility diagram according to the Eqn. 1. Using Eqn. 2, 1/T for the abscissa, lnKC for the ordinate, a linear Eqn. was obtained, Y = 3497X- 3.675, R2=0.989. ΔH, ΔS was calculated by the slope and intercept of the linear Eqn. and ΔG was calculated using Eqn. 3. The results are shown in Table 2. As shown, as the temperature increases, the KC decreases, resulting in a decrease in the stability of the inclusion compound. At 30° KC is relatively large, indicating that the inclusion complex of TFLX with HP-β-CD at this temperature is relatively stable. Both ΔH and ΔG were negative, indicating that the inclusion reaction between TFLX and HP-β-CD was spontaneous and exothermic. ΔS was negative, indicating that the drug was inserted into the cyclodextrin cavity and the chaotic degree of the solution was reduced. Furthermore, the binding of the guest molecule with HP-β-CD restricted the free movement of the guest molecule, which improves the bioavailability of hydrophobic drugs [35].
| T(°) | Equation | R2 | Kc (l/mol-1) | ΔH (kJ·mol-1) | ΔS (J·mol-1) | ΔG (kJ·mol-1) |
|---|---|---|---|---|---|---|
| 30 | Y = 0.044X+0.187 | 0.992 | 2461.2 | -28.99 | -30.55 | -19.73 |
| 40 | Y = 0.058X+0.270 | 0.989 | 1858.4 | -19.43 | ||
| 50 | Y = 0.057X+0.648 | 0.978 | 1188.3 | -19.12 | ||
| 60 | Y = 0.084X+1.017 | 0.981 | 901.7 | -18.82 |
Table 2: The Thermodynamic Parameters at Different Temperature.
The water solubility of TFLX and inclusion complex was investigated by preparing their saturation solutions. The absorbance of TFLX and its inclusion complex was determined by UV-2450 and the absorbance value was used to calculate the concentration of TFLX with the TFLX standard calibration equation. The solubility of TFLX was only about 0.246 g/l in water, while the solubility of the inclusion complex reached 10.368 g/l in water, indicating that the water solubility of the inclusion complex was increased by 42 times. These results revealed that HP-β-CD remarkably improved the water solubility of TFLX by the formation of TFLX/HP-β-CD inclusion complex.
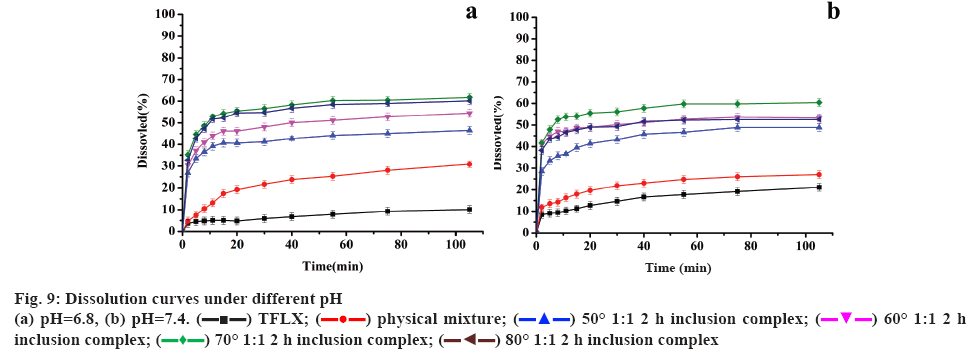
A dissolution study was used to assess the increase in the drug dissolution rate [36]. Phosphate buffer (pH 6.8, 7.4) was used as the dissolution medium to investigate the dissolution of raw TFLX, physical mixture and TFLX/ HP-β-CD inclusion complex. The molar ratio of TFLX and HP-β-CD was 1:1, the inclusion temperatures were 50°, 60°, 70° and 80°, and the inclusion time was 2 h.
As shown in figure 9a and b, at pH 6.8, the accumulative percent release of pure TFLX and the physical mixture was 8.6 and 29.5 % after 105 min, and that of the inclusion complex (70°, 1:1, 2 h) was more than 60 % in 30 min. With the rise of pH from 6.8 to 7.4, the accumulative percent release of physical mixture was 25.5 % after 105 min and that of inclusion complex reached 58.9 % in 30 min. Simultaneously, it can be seen that the inclusion compound prepared at 70° has the highest dissolution.
To explore the optimal inclusion time in pH 6.8 and 7.4 buffers, the inclusion temperature was selected to be 70°, the ratio of host to guest was 1:1, and the inclusion times were 1, 2, and 3 h. It can be observed that the dissolution of the inclusion time at 1 h is higher than other processes. This may be due to TFLX formed an inclusion complex with HP-β-CD within 1 h of stirring time, but with the increase of time, the formed inclusion complex has a little dissociation.
With the inclusion temperature of 70° and the inclusion time of 1 h, the ratios of the host and the guest were selected to be 1:3, 1:2, 1:1, 2:1, and 3:1, respectively, to explore the influence of the subject on dissolution. It can be seen that the dissolution curves are quite different. With the increase of HP-β-CD, the dissolution also increased. The dissolution was highest when the ratio of host to guest was 2:1, but increasing the amount of HP-β-CD had almost no effect on the dissolution.
Therefore, the optimal inclusion process was determined as the inclusion temperature of 70°, the inclusion time of 1 h, and the host-guest feed ratio of 2:1. All the results can be concluded that the dissolution rate of the inclusion complex is much higher than that of TFLX and physical mixture in phosphate buffers at pH 6.8 and 7.4.
The cumulative percent release of TFLX from pure TFLX was 38.4 % after 100 min in water solution, the release of TFLX from the physical mixture reached 41.2 % after 100 min, and from the inclusion complex it was more than 70 % in 10 min. The release of TFLX from the inclusion complex was more rapid with a higher dissolution rate compared to those from pure TFLX. The water solubility of TFLX was obviously increased in the presence of HP-β-CD. These results showed that the formation of a TFLX and HP-β-CD complex could be used as an effective method to increase the solubility and dissolution rate.
The purpose of the light irradiation test is to study changes in the colour, properties, hygroscopicity and other factors of the drug under the influence of light [37]. The stability of TFLX and its inclusion complex with HP-β-CD under natural sun light irradiation for 5 and 20 d was investigated. After light irradiation, the colour and content of TFLX changed significantly. In contrast, the colour of the inclusion complex did not change at all, but the content of TFLX in the inclusion complex decreased slightly. This slight decrease of TFLX content could be due to the presence of a small amount of free TFLX, which was decomposed by light irradiation. These results showed that the stability of the inclusion complex was enhanced.
The TFLX/HP-β-CD inclusion complex was prepared by solvent evaporation method and extensively characterized by DSC, XRD, FTIR, 1H NMR and 2D ROESY analysis indicated that the phenyl group A and B of TFLX were likely inserted into the HP- β-CD cavity from the wide side. The water solubility and dissolution rate of TFLX was increased markedly by forming an inclusion complex with HP-β-CD. The type of phase solubility for TFLX aqueous solution was AL, and dissolution study showed that the optimal inclusion process was a temperature of 70°, time was 1 h, and the ratio of subject to guest was 2:1. Moreover, the resulting inclusion complex showed higher stability under natural light irradiation compared with the free TFLX. The increased solubility and bioavailability of TFLX/HP-β-CD inclusion complex at higher pH could enhance its therapeutic efficacy for patients with gastric acid deficiency.
Acknowledgements
The authors gratefully acknowledge the financial supports of National Natural Science Foundation of China (Grant No. 21666026), Inner Mongolia Natural Science Foundation of China (Grant No. 2015MS0204).
Conflict of interest
Authors declared that there is no conflict of interest.
References
- Narita H, Konishi Y, Nitta J, Kitayama I, Miyazima M, Watanabe Y, et al. PyridonecarboxylicAcids as Antibacterial Agents. Synthesis and Structure-Activity Relationship of 7-Amino-1-aryl-6-fluoro-4-quinolone-3-carboxylic acids. Yakugaku Zasshi 1996;106:802-7.
- Niki Y. Pharmacokinetics and safety assessment of tosufloxacin tosilate. J Infect Chemother 2002;8(1):1-18.
- Yamaguchi K. Evaluation of in vitro and in vivo antibacterial activity of tosufloxacin tosilate. J Infect Chemother 2001;7(4):205-17.
- Kuang XH, Zhou LM, Wang YS. Study on the in vitro and in vivo antibacterial activities of sparfloxacin and tosufloxacin. Chin J Antibiot 2005;30:289-94.
- Kosugi Y, Yamamoto S, Sano N, Furuta A, Igari T, Fujioka Y, et al. Evaluation of Acid Tolerance of Drugs Using Rats and Dogs Controlled for Gastric Acid Secretion. J Pharm Sci 2015;104(9):2887-93.
- Kohno S. Clinical assessment of tosufloxacin tosilate. J Infect Chemother 2002;8(1):19-27.
- Han X, Ghoroi C, To D, Chen Y, Davé R. Simultaneous micronization and surface modification for improvement of flow and dissolution of drug particles. Int J Pharm 2011;415(1-2):185-95.
- Ajit KY, Chitresh Y, Alok S, Prevesh K. A Review on Self-Emulsifying Drug Delivery Systems: Strategy for Improving Oral Delivery of Poorly Soluble Drugs. Int J Chem Pharm Sci 2013;1:281-91.
- Hussein K, Türk M, Wahl MA. Drug loading into beta-cyclodextrin granules using a supercritical fluid process for improved drug dissolution. Eur J Pharm Sci 2008;33(3):306-12.
- Loftsson T, Duchêne D. Cyclodextrins and their pharmaceutical applications. Int J Pharm 2007;329(1-2):1-11.
- Boulmedarat L, Bochot A, Lesieur S, Fattal E. Evaluation of buccal methyl-β-cyclodextrin toxicity on human oral epithelial cell culture model. J Pharm Sci 2005;94(6):1300-9.
- Zhao B, He YY, Chignell CF, Yin JJ, Andley U, Roberts JE. Difference in phototoxicity of cyclodextrin complexed fullerene [(gamma-CyD)2/C60] and its aggregated derivatives toward human lens epithelial cells. Chem Res Toxicol 2009;22(4):660-7.
- Davis ME, Brewster ME. Cyclodextrin-based pharmaceutics: past, present and future. Nat Rev Drug Discov 2004;3(12):1023-35.
- Fraceto LF, Grillo R, Sobarzo-Sánchez E. Cyclodextrin inclusion complexes loaded in particles as drug carrier systems. Curr Top Med Chem 2014;14(4):518-25.
- Liu J, Qiu L, Gao J, Jin Y. Preparation, characterization and in vivo evaluation of formulation of baicalein with hydroxypropyl-beta-cyclodextrin. Int J Pharm 2006;312(1-2):137-43.
- Deng SX, Liu HJ, Qi CX, Yang AH, Li ZJ. Study on preparation and inclusion behavior of inclusion complexes between β-cyclodextrin derivatives with benzophenone. J Incl Phenom Macrocycl Chem 2018;90:321-9.
- Raza A, Sun H, Bano S. Preparation, characterization, and invitro, anti-inflammatory evaluation of novel water soluble kamebakaurin/hydroxypropyl-β-cyclodextrin inclusion complex. J Mol Struct 2007;1130:319-26.
- Azevedo MB, Alderete JB, Lino ACS, Loh W, Faljoni-Alario A, DurÁn N. Violacein/β-Cyclodextrin Inclusion Complex Formation Studied by Measurements of Diffusion Coefficient and Circular Dichroism. J Incl Phenom Macrocycl Chem 2000;37:67-74.
- Wei Y, Zhang J, Zhou Y, Bei W, Li Y, Yuan Q. Characterization of glabridin/hydroxypropyl-β-cyclodextrin inclusion complex with robust solubility and enhanced bioactivity. Carbohydr Polym 2017;159:152-60.
- Patel R, Bhimani D, Patel J, Patel D. Solid-state characterization and dissolution properties of ezetimibe–cyclodextrins inclusion complexes. J Incl Phenom Macrocycl Chem 2008;60:241-51.
- Zoeller T, Dressman JB, Klein S. Application of a ternary HP-β-CD-complex approach to improve the dissolution performance of a poorly soluble weak acid under biorelevant conditions. Int J Pharm 2012;430(1-2):176-83.
- Panchal JG, Patel RV, Menon SK. Preparation and physicochemical characterization of carbamazepine (CBMZ): para-sulfonated calix[n]arene inclusion complexes. J Incl Phenom Macrocycl Chem 2010;67:201-8.
- Uyar T, El-Shafei A, Wang X, Hacaloglu J, Tonelli AE. The Solid Channel Structure Inclusion Complex Formed Between Guest Styrene and Host γ-Cyclodextrin. J Incl Phenom Macrocycl Chem 2006;55:109-21.
- Semalty M, Panchpuri M, Singh D, Semalty A. Cyclodextrin inclusion complex of racecadotril: effect of drug-β-cyclodextrin ratio and the method of complexation. Curr Drug Discov Technol 2014;11:154-61.
- Higuchi TA, Connors KA. Phase-solubility techniques. Adv Anal Chem Instrum 1965;4:117-22.
- Ol’Khovich MV, Sharapova AV, Lavrenov SN. Inclusion complexes of hydroxypropyl-β-cyclodextrin with novel cytotoxic compounds: Solubility and thermodynamic properties. Fluid Phase Equilib 2014;384:68-72.
- Okimoto K, Rajewski RA, Uekama K, Jona JA, Stella VJ. The Interaction of Charged and Uncharged Drugs with Neutral (HP-β-CD) and Anionically Charged (SBE7-β-CD) β-Cyclodextrins. Pharm Res 1996;13(2):256-64.
- Qiu N, Cheng X, Wang G, Wang W, Wen J, Zhang Y, et al. Inclusion complex of barbigerone with hydroxypropyl-β-cyclodextrin: preparation and in vitro evaluation. Carbohydr Polym 2014;101:623-30.
- Zur M, Cohen N, Agbaria R, Dahan A. The biopharmaceutics of successful controlled release drug product: Segmental-dependent permeability of glipizide vs. metoprolol throughout the intestinal tract. Int J Pharm 2015;489(1-2):304-10.
- Păduraru OM, Bosînceanu A, Ţântaru G, Vasile C. Effect of Hydroxypropyl-β-Cyclodextrin on the Solubility of an Antiarrhythmic Agent. Ind Eng Chem Res 2013;52:2174-81.
- Li Y, Li F, Cai H, Chen X, Sun W, Shen W. Structural characterization of inclusion complex of arbutin and hydroxypropyl-β-cyclodextrin. Trop J Pharm Res 2016;15:2227-33.
- Pralhad T, Rajendrakumar K. Study of freeze-dried quercetin-cyclodextrin binary systems by DSC, FT-IR, X-ray diffraction and SEM analysis. J Pharm Biomed Anal 2004;34(2):333-9.
- Butkus E, Martins JC, Berg U. 1H NMR spectroscopic study of the interaction between cyclodextrins and bicyclo[3.3.1]nonanes. J Inclusion Phenom Mol Recognit Chem 1996;26:209-18.
- Cifuentes T, Cayupi J, Celis-Barros C, Zapata-Torres G, Ballesteros R, Ballesteros-Garrido R, et al. Spectroscopic studies of the interaction of 3-(2-thienyl)-[1,2,3] triazolo [1,5-a] pyridine with 2,6-dimethyl-β-cyclodextrin and ctDNA. Org Biomol Chem 2016;14(41):9760-7.
- Nie S, Fan X, Peng Y, Yang X, Wang C, Pan W. In vitro and in vivo studies on the complexes of vinpocetine with hydroxypropyl-beta-cyclodextrin. Arch Pharm Res 2007;30:991-1001.
- Mandić Z, Gabelica V. Ionization, lipophilicity and solubility properties of repaglinide. J Pharm Biomed Anal 2006;41:866-71.
- Coronado JM, Sanchez B, Fresno F, Suárez S, Portela R. Influence of Catalyst Properties and Reactor Configuration on the Photocatalytic Degradation of Trichloroethylene Under Sunlight Irradiation. J Sol Energy Eng 2008;130:32-42.

 TFLX;
TFLX;  physical mixture;
  50° 1:1 2 h inclusion complex;
  60° 1:1 2 h inclusion complex;
  70° 1:1 2 h inclusion complex;
  80° 1:1 2 h inclusion complex


