- *Corresponding Author:
- N. N. Dhanasekar Industrial Chemistry Laboratory, Central Leather Research Institute (CSIR–CLRI), Chennai-600 020, India
E-mail: nareshnila@gmail.com
| Date of Submission | 02 July 2019 |
| Date of Revision | 14 September 2019 |
| Date of Acceptance | 29 November 2019 |
| Indian J Pharm Sci 2020;82(1):88-96 |
This is an open access article distributed under the terms of the Creative Commons Attribution-NonCommercial-ShareAlike 3.0 License, which allows others to remix, tweak, and build upon the work non-commercially, as long as the author is credited and the new creations are licensed under the identical terms
Abstract
In the present investigation, a controlled release system for ibuprofen was prepared using a newly synthesized nanodrug carrier. The nanodrug carrier was made by blending montmorillonite and chitosan by forming an intimate mixture of geomaterial of montmorillonite clay and chitosan. Ibuprofen was then loaded into the montmorillonite-chitosan nanohybrid and the resulting montmorillonite-chitosan/ibuprofen nanoparticles were characterized using Fourier-transform infrared spectroscopy, X-ray diffraction, thermogravimetric analysis and transmission electron microscopy. The in vitro release profiles of ibuprofen from montmorillonite-chitosan/ibuprofen was studied at 37º±0.5º under simulated gastric and intestinal media at pH 1.2 and pH 7.4, respectively. Controlled drug release was observed at both pH conditions. Kinetic of the release of ibuprofen at pH 1.2 and 7.4 was studied to find that the release followed Korsmeyer-Peppas and first-order kinetic models, respectively.
Keywords
Montmorillonite, ibuprofen, chitosan, release kinetics, controlled release, first-order
The need for benign, therapeutically effective and patient-compliant drug delivery systems has led researchers to design novel tools and strategies. Clays and clay minerals are naturally occurring materials of well-known scientific and technological interest and are considered as raw pharmaceutical materials. However, once evaluated and/or modified to fulfill regulatory pharmacopeial requirements, the materials could achieve the status of pharmaceutical substances suitable for use in the manufacture of medicinal products[1,2]. Among the clay minerals, montmorillonite (MMT) finds tremendous potential due to its higher cation exchange capacity, large surface area, good sorption behavior, outstanding adhesive ability and drug carrying capability compared to other pharmaceutical silicates such as talc, kaolin and fibrous clay minerals. MMT functions as both excipients and active substances in pharmaceutical products[3]. MMT is a potentially useful material, especially in the field of controlled release of drugs, where it acts as a vehicle. MMT is able to absorb dietary and bacterial toxins associated with gastrointestinal disturbances, protons in acidosis and metabolic toxins such as steroidal metabolites associated with pregnancy[4]. MMT finds moderate use in the treatments such as diarrhea and constipation through local application, it also acts on all unhealthy organs, which emit anions and is subjected to immediate elimination from the body[5-7]. MMT is used as an ideal excipient and also in the field of pharmaceutical technology and dermopharmacy clay minerals, due to its applicability in the formulation of solid dosage forms such as tablets, capsules and powders; semi-solids like ointments and creams, and liquids like suspensions and emulsions[8-10]. MMT has proven to be biologically safe and non-toxic as a drug carrier, when studied with yeast and in a Wistar rat model[11].
Chitosan (CS) is bio-degradable, biocompatible, nonimmunogenic, inexpensive and nontoxic polymer exhibiting high mechanical strength, hydrophilicity and good adhesion properties. CS, composed mainly of β-(1,4)-linked 2-deoxy-2-amino-D-glucopyranose units is a linear cationic biopolymer of high molecular weight and an important derivative of chitin. The biochemical properties of CS made it an excellent bio-adhesive polymer material, since it performed well for sub-cutaneous, oral, occular and transdermal drug delivery[12]. Recently, Li et al. showed enhanced antibacterial activity due to the combined effect of CS/MMT[13]. Chang et al. also reported the use of CS as a novel biomaterial that enhanced the growth of human fibroblast cells[14]. Benefitting from the biocompatible properties of the CS, it was modified with MMT to obtain MMT-CS nanohybrid that would enhance interlayer spaces within the clay layers in order to improve the suspension behavior of the carrier during release of the drug.
Ibuprofen (IBU), α-methyl-4-(2-methylpropyl)- benzene acetic acid, is a non-steroidal antiinflammatory drug used to treat rheumatoid arthritis and osteoarthritis[15]. Li et al. reported that IBU was used as a model drug for producing IBU-bovine serum albumin (BSA)-dextran nanoparticles, through hydrophobic and electrostatic interactions between the IBU and BSA[16,17], while sustained release behavior of IBU from IBU/ MMT particles have been observed[18]. Nevertheless, fabrication of MMT-CS nanohybrids and their use as carriers for the release of the IBU provided key insights into achieving controlled release patterns for drugs. In the present study, MMT-CS/IBU formulations were prepared in the form of capsules and the release profiles of IBU through different kinetic models.
Materials and Methods
MMT (K10), with a specific surface area of 274 m2/g and a cation exchange capacity of 1.2 mEq/g and CS from crab shells were purchased from Sigma Aldrich, USA. IBU (melting point 76°) was kindly supplied by Medrich Pharmaceuticals, India, and was used without further purification. Deionized water (resistance of 18.2 mΩ/cm) was used throughout the experiments.
Preparation of MMT dispersion:
MMT nanoclay (0.10, 0.25 or 0.5 g) was dispersed in deionized water (100 ml) and allowed to stand for 24 h at 30º for swelling. The swollen MMT was stirred mechanically and sonicated for 30 min to form a colloidal dispersion. The upper layer of the colloidal solution was collected, and the stability of the colloids was assessed visually by allowing the upper layer of the colloidal dispersion to stand for 24 h. Since all dispersions appeared to be colloidally stable for 24 h, the high concentrated dispersion of 0.5 % w/w preparatory mix was chosen for fabricating MMT-CS nanohybrids.
Preparation of MMT-CS nanodispersion:
One percent w/v CS solution was prepared by dissolving in 1 % (v/v) acetic acid. The solution was stirred continuously for 4 h to dissolve the CS completely[19]. To the acidified CS solution, 0.5 % MMT colloidal solution was blended in the ratio of 1:0.0001 (MMT:CS, w/w). The blend was sonicated for 20 min at 20° with an amplitude of 20 % and centrifuged at 4×1000 rpm for 20 min. Free CS was removed by washing the pellet with 1 % glacial acetic acid (v/v). The final solid phases of MMT-CS nanohybrids were recovered by filtration and dried at 50° for 24 h. A similar procedure was adopted for the preparation of MMT-CS nanohybrid formulations in the ratios 1:0.001 and 1:0.01, respectively.
Preparation of MMT-CS/IBU nanoparticles:
The grinding technique is a simple and facile method to prepare MMT-CS/IBU nanoparticles. The MMT-CS and IBU ratios of 1:0.5 and 1:1 was mixed (20 min) by grinding thoroughly using a mortar and pestle. The MMT-CS/IBU mixture was washed repeatedly with acetone to remove the free drug. The final MMTCS/ IBU mixture thus obtained was dried at room temperature and stored in a desiccator[20].
Formulation of capsules of IBU-loaded MMT-CS nanohybrid with excipients:
IBU-loaded MMT-CS capsules were prepared using carboxymethyl cellulose sodium salt as a disintegrating agent. MMT-CS/IBU was further blended with carboxymethyl cellulose sodium and the average weight of the capsule was adjusted to 100 mg using lactose. The capsules were then stored in a tightly closed glass container.
In vitro release of IBU from MMT-CS/IBU formulations:
In vitro drug release studies were conducted in a constant temperature bath fitted with a round bottom flask charged with 900 ml buffer solution using the dialysis bag technique. A buffer solution of pH 1.2 was prepared by mixing 0.2 M KCl (147 ml) and 0.2 M HCl (250 ml) to simulate gastric fluid. Similarly, a buffer solution of pH 7.4, to simulate intestinal fluid, was prepared by mixing 0.1 M KH2PO4 (250 ml) with 0.1 M NaOH (195.5 ml). The dialysis sacs were washed with the dissolution medium for 1 h prior to conducting the experiments. The dialysis bag containing the preweighed capsule was suspended in buffer solution that was stirred constantly at 100 rpm. At regular time intervals, 5 ml of the dissolution medium was withdrawn and analyzed for IBU content using UV/Vis spectroscopy. The withdrawn quantity of dissolution medium was replaced immediately with fresh buffer solution to maintain the initial volume. UV analysis was conducted in triplicates and the results represent the average value.
In vitro drug release kinetics:
Release profiles of IBU from the in-house prepared MMT-CS/IBU capsules were studied at pH 1.2 and 7.4 and were tested with 4 mathematical models. The relationships included zero-order i.e., cumulative percent drug released versus time, first-order i.e., logarithmic cumulative percent drug remaining versus time, Higuchi’s i.e., cumulative percent drug released versus square root of time and Korsmeyer-Peppas i.e., logarithmic cumulative percent drug released versus log time[21]. All the release kinetic studies were performed in triplicates and the results presented as average value.
Zero-order release kinetic model:
In the zero-order kinetic model, the release of the drug from a dosage form occurs in a planned, predictable and/or slower manner than the norm, and it is particularly pertinent to sustained/controlled release dosage forms[22]. On dissociation from the carrier, the drug gets release in a slow manner and the zero-order release model best represented by Eqn. 1, Qt = Q0+K0t, where, Qt is the amount of drug dissolved in time t, Q0 is the initial amount of drug in the solution (Q0=0) and K0 is the zero-order release constant expressed in units of concentration/time. The release kinetics have been studied using the data obtained from in vitro drug release studies and have been plotted as cumulative content of drug released versus time[23]. Eqn. 1 describes the zero-order rate equation wherein the drug release rate is independent of its concentration.
First-order release kinetic model:
This model describes the behavior of absorption and/ or elimination of drugs, although it is difficult to conceptualize this mechanism on a purely theoretical basis. The majority of the conventional dosage and partially modified release preparations (prolonged release formulations) usually exhibit first-order release kinetic behavior. Thus, the release of the drug, which follows first-order kinetics, can be expressed by the Eqn. 2, log C = log C0–kt/2.303, where, C0 is the initial concentration of drug, k is the first-order rate constant, and t is the time[24]. A plot of log cumulative percent drug remaining versus time would exhibit linear plot. Eqn. 2 provides the release of drug from dosage formulations where the rate of release is dependent on the concentration of the dissolution.
Higuchi’s model:
The Higuchi model describes the release of drug from an insoluble matrix and is only dependent on the square root of time (Eqn. 3)[25]. Hence, the data obtained were plotted as cumulative percent drug release versus square root of time. The model is given by the Eqn. 3, Q = KHt1/2, where, KH is the constant that reflects the proposed variable of the Higuchi release kinetic model and is called the Higuchi dissolution constant and ‘t’ is the time. A plot of cumulative percent drug released versus square root of time would give a linear plot.
Korsmeyer-Peppas model:
Korsmeyer et al. derived a simple relationship as shown in Eqn.4 dealing with drug release from polymeric matrices. The model is best satisfied for the release of the first 60 % of the formulation[26]. Eqn. 4, Mt/M∞= Ktn, where Mt/M∞ is a fraction of drug released at time ‘t’, k is the release rate constant and ‘n’ is the release exponent. The release kinetics were studied by plotting the data as log cumulative percent drug release versus log time to yield a linear plot, for the initial portion of the graph.
Characterization:
X-ray diffraction (XRD) patterns were recorded using a Siemens D-500 diffractometer using CuKα radiation (λ=1.5305 Å). Diffraction angle patterns were recorded from 3 to 30º. Fourier-transform infrared (FTIR) spectral analysis for the samples was carried out using KBr pellet on a Perkin-Elmer spectrophotometer (Spectrum RX1, FTIR V.200). Thermogravimetric analysis (TGA) was carried out in a platinum crucible with 10 mg sample size from room temperature to 800° on TGA Q50, TA instruments, under nitrogen (flow rate: 10°/min) atmosphere at a heating rate of 10 K/ min. The transmission electron micrographs (TEM) were taken for morphological analysis using Jeol 3010 field emission electron microscope with an accelerating voltage of 300 kV. UV/Vis absorbance of IBU solutions were measured using UV/Vis spectrophotometer (Shimadzu UV-240) equipped with a quartz cell having a path length of 1 cm in the acetone medium (99.0 %).
Results and Discussion
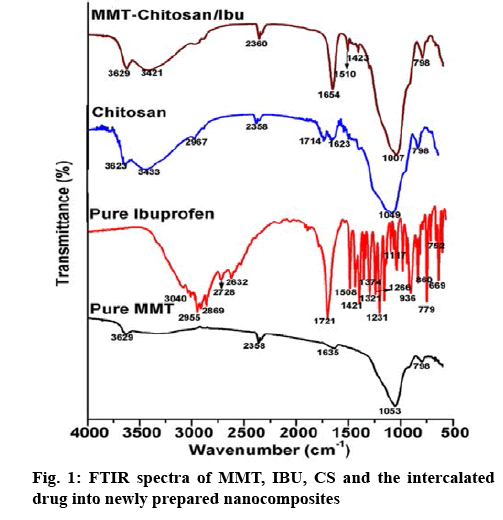
Figure 1 presented the FTIR spectra of MMT, CS, IBU and MMT-CS/IBU. The spectrum of MMT was characterized by the stretching vibration of the –OH group at 3626 cm-1 due to the increased level of aluminium present in the octahedral sheets[27]. The presence of Si moiety in the two tetrahedral sheets of the MMT was accessed through a sharp and broad stretching vibration of Si–O–Si corresponding to 1053 cm-1. On the other hand, the peak at 1639 cm-1 represents the deformation vibration of the OH group[28]. In the case of CS, a sharp narrow peak at 1049 cm-1 corresponds to the C-N stretching vibrations of aliphatic amine. The peaks at 1041 and 3629 cm-1 were attributed to the C-N and O-H stretch, respectively, confirmed the intercalation of CS with MMT. In the spectrum of pure IBU the CH3 asymmetric stretch, the C=O stretch and the C–C stretch were observed at 2955, 1721 and 1231 cm-1, respectively. In addition, the strong peak at 779 cm-1 was dominant due to the rocking vibration of CH2. It was noted that these four bands at 2955, 1721, 1231 and 779 cm-1 were considered as the fingerprints of IBU[29]. Other stretching vibrations such as the C=C stretch (1508 and 752 cm-1), O-H…O valence stretch (2728 and 2632-1), CH3 stretch (936 cm-1), CH3 asymmetric (1421 cm-1) and CH2 asymmetric stretch (3040 cm-1 and 2869 cm-1) were also observed for IBU. The absorption bands due to OH in plane deformation (1321 cm-1), =C-H in plane deformation (1266, 1117 cm-1), C-H out of plane deformation (860, 669 cm-1) were also recorded[30]. Although the spectra of MMT-CS/IBU complex was dominated by the MMT-CS, there was a considerable variation in the shape and intensity profiles of the observed individual spectral peaks. The peak at 1654 cm-1, which is absent in the spectrum of MMT and CS but configures strongly in IBU is interpreted as solid evidence for the interacalation of the drug IBU into the MMT-CS complex.
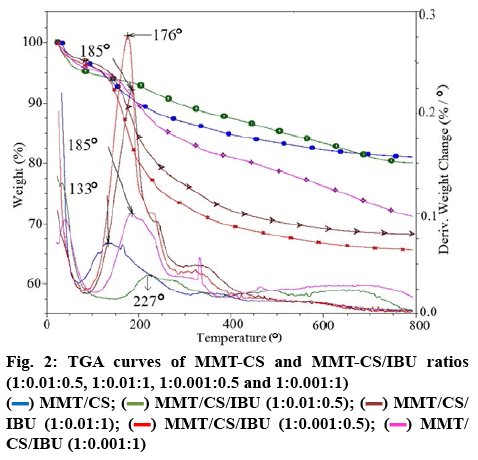
Figure 2 shows the TGA curves of MMT-CS nanocomposites, MMT-CS/IBU (1:0.01:0.5), MMTCS/ IBU (1:0.01:1), MMT-CS/IBU (1:0.001:0.5) and MMT-CS/IBU (1:0.001:1), respectively. For MMTCS/ IBU (1:0.001:0.5) and MMT-CS/IBU (1:0.001:1), the rate of degradation was decreased compared to IBU alone. This characteristic could be attributed to the presence of the MMT moiety. The thermogram of MMT-CS nanohybrid initially exhibited 5 % mass loss at a heating rate of 10°/min over the temperature range of 10-60°. This mass loss was due to the desorption of water molecules from MMT. Further gradual loss in the mass could be explained by the corresponding dehydration behavior contributed from the CS molecules. This was also consistent with the MMTCS/ IBU, which could have arised due to the partial decomposition of IBU. The MMT crystal lattice was arranged parallel to the surface which resulted in the hindrance of oxygen and thus enhanced the transfer of the decomposed products. Nevertheless, the amount of drug/g of MMT-CS/IBU (1:0.001:1), MMT-CS/IBU (1:0.001:0.5), MMT-CS/IBU (1:0.01:0.5) and MMTCS/ IBU (1:0.01:1) systems were found to be 277, 343, 199 and 317 mg, respectively and the temperatures for the onset of degradation at 184, 176, 218 and 184°, repectively (Table 1). The presence of clay platelets restricted the decomposition of MMT-CS nanohybrid as apparent from the MMT-CS/IBU curves. The weight loss was found to vary with increasing quantity of IBU added to the nanohybrids.
Table 1: Estimated Amount of IBU Loaded Into MMT-CS Nanohybrids
| Different compositions of MMT-CS (mg) | Total decomposition under the scanned temperature | Decomposition rate (°) | IBU in mg/g of hybrids | ||
|---|---|---|---|---|---|
| (%) | (mg) | Initial decomposition | Final decomposition | ||
| IBU | 95.70 | 14.65 | 221 | – | – |
| MMT | 14.69 | 1.29 | 46 | – | – |
| MMT-CS | 17.66 | 2.24 | 154 | 377 | – |
| MMT-CS/IBU (1:0.01:0.5) | 19.93 | 0.96 | 218 | 277 | 199.30 |
| MMT-CS/IBU (1:0.01:1) | 31.78 | 1.84 | 184 | 242 | 317.80 |
| MMT-CS/IBU (1:0.001:0.5) | 34.33 | 1.21 | 176 | 232 | 343.30 |
| MMT-CS/IBU (1:0.001:1) | 28.74 | 3.07 | 184 | 210 | 277.40 |
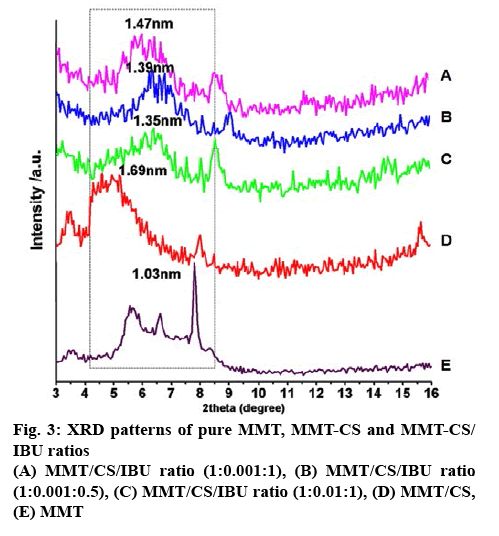
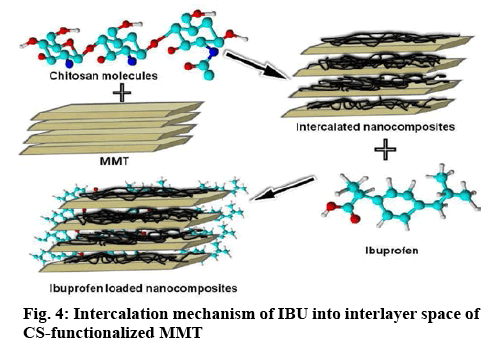
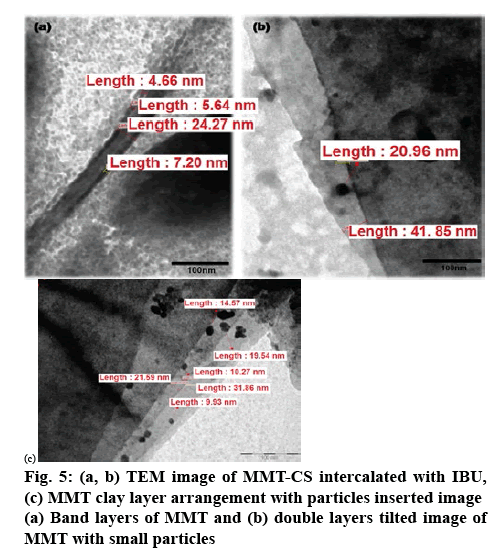
Figure 3 represents the XRD patterns of MMT, MMTCS nanohybrid and MMT-CS/IBU ratios (1:0.001:1, 1:0.001:0.5 and 1:0.01:1). The XRD pattern of MMT exhibited a diffraction angle of 8.57º (2θ), but the MMT-CS nanohybrid revealed a strong signal at 5.22º. According to Bragg’s law (nλ=2dsinθ), the peak shifting from higher diffraction angle to lower diffraction angle was interpreted as the increase in d-spacings[31,32]. Thus, compared with MMT, the basal space for CS at 1.69 nm (Table 2), suggested the intercalation of CS into the MMT layers. The interlayer distances of 1:0.001:1, 1:0.001:0.5 and 1:0.01:1 was characterized by respective basal spacing values of 1.35, 1.39 and 1.47 nm, respectively. The increase in the basal spacing during the formation of MMT-CS/IBU nanohybrid offered direct evidence of the intercalation of IBU into the MMT-CS nanohybrid. Increased breadth and reduced intensity of the basal reflections were further recorded in all the three systems including the MMTCS nanohybrid. Captivatingly, the grinding technologybased formulation caused the successful intercalation of IBU into the MMT-CS nanohybrid as depicted in the schematic (figure 4). Figure 5 shows the successful intercalation of IBU into the MMT interlayers. The layered pattern of MMT with the insertion of CS and IBU nanoparticles was also noted. The size of the integrated particle ranged between 20 and 30 nm whose interlayer distance was in the range of 4-8 nm.
Table 2: Basal Spacings of Pure MMT, MMT-CS and Different Ratios of MMT-CS/IBU as Determined by XRD
| Various nanohybrid systems | θ | 2θ | d (nm) |
|---|---|---|---|
| IBU | 4.29 | 8.57 | 1.03 |
| MMT | 2.61 | 5.22 | 1.69 |
| MMT-CS | 3.26 | 6.52 | 1.35 |
| MMT-CS/IBU (1:0.01:0.5) | 3.17 | 6.33 | 1.39 |
| MMT-CS/IBU (1:0.01:1) | 3 | 6 | 1.47 |
The nanohybrid (MMT-CS) and lactose played the role of a diluent. The carboxymethyl cellulose sodium salt was used as a disintegrant due to its macerating properties (5-10 %). The powder mixtures were prepared by mixing IBU (22.29 %), MMT-CS (27.81 %), lactose (49.60 %) and carboxymethyl cellulose sodium salt (0.40 %) using a mortar and pestle. The prepared mixtures (100 mg) were introduced into empty white capsule shells manually (Table 3). Twenty capsules were weighed individually and the average weight was determined. Following the IP standards, no more than 2 of the individual weights should deviate from the average weight by more than the percentage as shown in the Table 4 and none deviated by more than twice that percentage. The average weight of content present in the capsule was found to be 1943.40/20 = 97.17 mg and the minimum weight deviation was calculated as: (93.8/97.17×100)–100 = –3.47.
Table 3: Master Formulae for Capsule Formulation Filling Process
| Components | Fill weight of sample capsule (%) | Fill weight of sample/50 capsules (g) |
|---|---|---|
| IBU | 22.29 | 1.10 |
| MMT-CS hybrid | 27.81 | 1.39 |
| Lactose (diluent) | 49.60 | 2.48 |
| Carboxy methyl cellulose sodium (disintegrants) | 0.40 | 0.02 |
Table 4: Physico-Chemical Parameters for the Most Satisfactory Formulation
| Intact weight of loaded capsules (mg) | Weight of empty capsules (mg) | Actual amount of content (mg) | Individual weight in % (not >90/<110) | Average % of deviation |
|---|---|---|---|---|
| 142.3 | 48.2 | 94.1 | 97.29 | -2.71 |
| 144.1 | 48.3 | 95.8 | 99.04 | -0.96 |
| 145.8 | 49.1 | 96.7 | 99.97 | -0.03 |
| 146.9 | 48.3 | 98.6 | 101.94 | 1.94 |
| 145.4 | 49.8 | 95.6 | 98.84 | -1.16 |
| 145.8 | 49.1 | 96.7 | 99.97 | -0.03 |
| 147.9 | 49.4 | 98.5 | 101.84 | 1.84 |
| 144.7 | 48.9 | 95.8 | 99.04 | -0.96 |
| 147.3 | 49.3 | 98.0 | 101.32 | 1.32 |
| 147.1 | 48.6 | 98.5 | 101.84 | 1.84 |
| 144.7 | 50.2 | 94.5 | 97.7 | -2.3 |
| 146.5 | 48.5 | 98.0 | 101.32 | -1.32 |
| 146.6 | 49.0 | 97.6 | 100.90 | 0.90 |
| 143.5 | 46.9 | 96.6 | 99.87 | -0.13 |
| 145.8 | 49.2 | 96.6 | 99.87 | -0.13 |
| 142.8 | 49.0 | 93.8 | 96.98 | -3.02 |
| 146.4 | 49.6 | 96.8 | 100.08 | 0.08 |
| 146.5 | 49.4 | 97.1 | 100.39 | 0.39 |
| 147.7 | 49.8 | 96.9 | 100.18 | 0.18 |
| 146.4 | 48.2 | 98.2 | 101.53 | 1.53 |
| Average weight of content present in the capsule | 1943.40/20=96.72 | |||
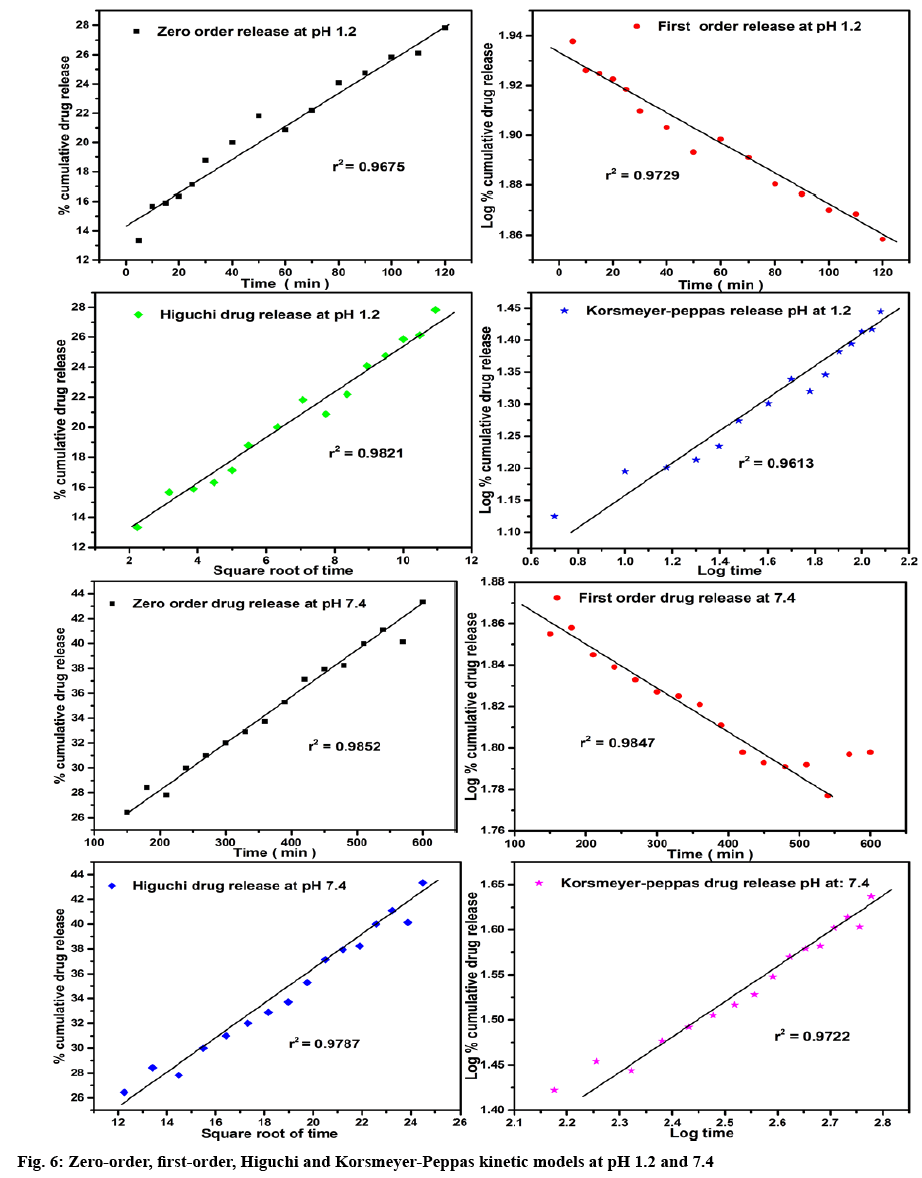
The results of the in vitro drug release studies were fitted with various kinetic Eqns such as zero-order, first-order, Higuchi and Korsmeyer-Peppas to examine the release mechanism of the drug (Table 5, figure 6). The regression co-efficient (r2) values obtained from these models were evaluated by comparing their best fit values. In case of pH 1.2, the Higuchi model (r2=0.9821) showed the highest r2 values compared with other models. While, in the case of pH 7.4, the zero and first-order models showed higher r2 values when compared with Higuchi and Korsmeyer-Peppas models. The r2 of 0.9852 and 0.9847 for zero- and first-order models exhibits a mixed release mechanism. However, the dissolved drug for the first-order kinetics should not aggregate near the membrane and likely to undergo concentrationdependent release. On the other hand, the release profiles exhibited by the zero-order reaction does not depend on drug concentration[33]. The diffusion exponential ‘n’ values obtained from Korsmeyer-Peppas model help to identify the mechanism of transport of a drug. Thus, the ‘n’ values showing less than 0.5. i.e., 0.228 for pH 1.2 and 0.352 for pH 7.4 was due to the behavior of non- Fickian diffusion mechanism[34].
Table 5: Release Parameters of MMT-CS/IBU Capsules at PH 1.2 and 7.4
| R2 | ||||||
|---|---|---|---|---|---|---|
| pH methods | Zero-order | First-order | Higuchi model | Korsmeyer-Peppas | ‘n’ value | Mechanism |
| 1.2, Grinding | 0.9675 | 0.9729 | 0.9821 | 0.9613 | 0.228 | Controlled release |
| 7.4, Grinding | 0.9852 | 0.9847 | 0.9787 | 0.9722 | 0.352 | Controlled release |
MMT-CS nanohybrids were successfully synthesized and IBU was intercalated into these materials by grinding technique. The intercalation was confirmed by FTIR and XRD analyses and the amount of IBU loaded was determined by the TGA method. The release of IBU from the MMT-CS matrix was observed to be pHdependent and the release rate was higher in the case of pH 1.2 when compared to pH 7.4. The drug release patterns appeared to display first-order release kinetics at pH 7.4, whereas the release pattern at pH 1.2 obeyed the Koresmeyer-Peppas. Further, in all the 4 cases the lower value (n<0.5) suggested that the diffusion profile of the drug might be classical, non-Fickian release, which could be the significance of the MMT swelling[35]. The application of kinetic model system was also consistent with the suitability of the MMT-CS nanocomplex to act as an orally administered vehicle for the controlled release of IBU.
Acknowledgements
The authors would like to thank the technical staffs of CSIF facility of Central Leather Research Institute (CSIR-CLRI).
Conflict of interest
The authors declare no conflict of interest.
Financial assistance
This part of the research did not receive any specific grant from funding agencies in the public, commercial, or not-for-profit sectors.
References
- Pacula A, Bielańska E, Gawel A, Bahranowskic K, Serwickaa EM. Textural effects in powdered montmorillonite induced by freeze-drying and ultrasound pretreatment. Appl Clay Sci 2006;32:64-72.
- López-Galindo A, Viseras C, Cerezo P. Compositional, technical and safety specifications of clays to be used as pharmaceutical and cosmetic products. Appl Clay Sci 2007;36:51-63.
- Joshi GV, Kevadiya BD, Patel HA, Bajaj HC, Jasra RV. Montmorillonite as a drug delivery system: intercalation and in vitro release of timolol maleate. Int J Pharm 2009;374:53-57.
- Dong Y, Feng SS. Poly(d,l-lactide-co-glycolide)/montmorillonite nanoparticles for oral delivery of anticancer drugs. Biomaterials 2005;26:6068-76.
- Lee WF, Fu YT. Effect of montmorillonite on the swelling behavior and drug-release behavior of nanocomposite hydrogels. J Appl Polym Sci 2003;89:3652-60.
- Lin FH, Lee YH, Jian CH, Wong JM, Shieh MJ, Wang CY. A study of purified montmorillonite intercalated with 5-fluorouracil as drug carrier. Biomaterials 2002;23:1981-87.
- Sekine T, Yoshida K, Matsuzaki F, Yanaki T, Yamaguchi M. A novel method for preparing oil-in-water-in-oil type multiple emulsions using organophilic montmorillonite clay mineral. J Surfactants Deterg 1999;2:309-15.
- Camargo PH, Satyanarayana KG, Wypych F. Nanocomposites: synthesis, structure, properties and new application opportunities. Mater Res 2009;12:1-39.
- Carretero MI. Clay minerals and their beneficial effects upon human health: a review. Appl Clay Sci 2002;21:155-63.
- Viseras C, Aguzzi C, Cerezo P, Lopez-Galindo A. Uses of clay minerals in semisolid health care and therapeutic products. Appl Clay Sci 2007;36:37-50.
- Lee YH, Kuo TF, Chen BY, Feng Y, Wen Y, Lin WC, et al. Toxicity assessment of montmorillonite as a drug carrier for pharmaceutical applications: yeast and rats model. Biomed Eng Appl Basis Commun 2005;17:72-78.
- Muzzarelli R, Muzzarelli C. Chitosan chemistry: relevance to the biomedical sciences. Adv Polym Sci 2005;186;151-209.
- Li T, Zhang Y, Song Z, Wu H. Preparation and characterization of antibacterial chitosan/Ag–montmorillonite with improved dynamic mechanic properties. Polym Compos 2014;35:1980-88.
- Chang J, Liu W, Han B, Liu B. The evaluation on biological properties of carboxymethyl-chitosan and carboxymethyl-chitin. J Ocean Univ China 2008;7:404-10.
- Rainsford KD. Discovery, mechanisms of action and safety of ibuprofen. Int J Clin Pract Suppl 2003;135:3-8.
- Li J, Yao P. Self-assembly of ibuprofen and bovine serum albumin-dextran conjugates leading to effective loading of the drug. Langmuir 2009;25:6385-91.
- Arida AI, Amro B, Jaghbir M, ElAlem M, Sabri R, AbuZeid R. Development of sustained-release ibuprofen microspheres using solvent evaporation technique. Arch Pharm 1999;332:405.
- Zheng JP, Luan L, Wang HY, Xi LF, Yao KD. Study on ibuprofen/montmorillonite intercalation composites as drug release system. Appl Clay Sci 2007;36:297-301.
- Darder M, Colilla M, Ruiz-Hitzky E. Biopolymer-clay nanocomposites based on chitosan intercalated in montmorillonite. Chem Mater 2003;15:3774-80.
- Lakshmi MS, Sriranjani M, Bakrudeen HB, Kannan AS, Mandal AB, Reddy BS. Carvedilol/montmorillonite: processing, characterization and release studies. Appl Clay Sci 2010;48:589-93.
- Costa P, Sousa Lobo JM. Evaluation of mathematical models describing drug release from estradiol transdermal systems. Drug Dev Ind Pharm 2003;29;89-97.
- Ulla SN, Roy AK, Kulkarni M, Vinod K. Formulation and evaluation of sustained release matrix tablets of lornoxicam. Int J Drug Dev Res 2011;3:31-44.
- Narasimhan B, Mallapragada SK, Peppas NA. Encyclopedia of controlled drug delivery. New York: John Wiley; 1999. p. 921-35.
- Florence AT. Pharmaceutical aspects of nanotechnology. New York: CRC Press; 2009. p. 453.
- Higuchi T. Mechanism of sustained‐action medication. Theoretical analysis of rate of release of solid drugs dispersed in solid matrices. J Pharm Sci 1963;52:1145.
- Korsmeyer RW, Gurny R, Doelker E, Buri P, Peppas NA. Mechanism of solute release from porous hydrophilic polymers. Int J Pharm 1983;15:25-35.
- , Seki Y, Murat Kuşoğlu I, Yurdakoç K. Equilibrium and kinetics for the sorption of promethazine hydrochloride onto K10 montmorillonite. J Colloid Interface Sci 2006;299:155-62.
- Xu SW, Zheng JP, Tong L, Yao KD. Interaction of functional groups of gelatin and montmorillonite in nanocomposite. J Appl Polym Sci 2006;101:1556-61.
- Matkovic SR, Valle GM, Briand LE. Quantitative analysis of ibuprofen in pharmaceutical formulations through FTIR spectroscopy. Lat Am Appl Res 2005;35:189-95.
- Ramukutty S, Ramachandran E. Growth, spectral and thermal studies of ibuprofen crystals. Cryst Res Technol 2011;47:31-38.
- Kevadiya BD, Patel HA, Joshi GV, Abdi SH, Bajaj HC. Montmorillonite-alginate composites as a drug delivery system: intercalation and in vitro release of diclofenac sodium. Indian J Pharm Sci 2010;72:732-37.
- Reed-Hill RE, Abbaschian R. Physical metallurgy principles. Boston: PWS; 1994. p. 944.
- Fu Y, Kao WJ. Drug release kinetics and transport mechanisms of non-degradable and degradable polymeric delivery systems. Expert Opin Drug Deliv 2010;7:429-444.
- Peppas NA. Analysis of Fickian and non-Fickian drug release from polymers. Pharm Acta Helv 1985;60:110-11.
- Madurai SL, Joseph SW, Mandal AB, Tsibouklis J, Reddy BS. Intestine-specific, oral delivery of captopril/montmorillonite: formulation and release kinetics. Nanoscale Res Lett 2011;6:15-22.
 MMT/CS;
  MMT/CS/IBU (1:0.01:0.5);
  MMT/CS/IBU (1:0.01:1);
  MMT/CS/IBU (1:0.001:0.5);
  MMT/CS/IBU (1:0.001:1)