- *Corresponding Author:
- D. J. Pandya
Department of Quality Assurance, Shri Sarvajanik Pharmacy College, Gujarat Technological University, Ahmedabad, Gujarat 382424, India
E-mail: djpandya11998@gmail.com
| Date of Received | 23 February 2023 |
| Date of Revision | 29 July 2023 |
| Date of Acceptance | 18 March 2024 |
| Indian J Pharm Sci 2024;86(2):683-691 |
This is an open access article distributed under the terms of the Creative Commons Attribution-NonCommercial-ShareAlike 3.0 License, which allows others to remix, tweak, and build upon the work non-commercially, as long as the author is credited and the new creations are licensed under the identical terms
Abstract
The objective of this study is to develop simple, rapid and sensitive reversed-phase high performance liquid chromatography method for bilastine in tablet dosage form by quality by design approach. In reversed-phase high performance liquid chromatography method, chromatographic conditions such as mobile phase composition and flow rate were optimized with the help of Design-Expert software using central composite design. In this method, bilastine was estimated using octadecylsilane column (250×4.6 mm, 5 µm) and methanol:acetonitrile (90:10 % v/v) as mobile phase and flow rate 1 ml/ min which are optimized using Design-Expert software. Method was developed at 280 nm detection wavelength. The retention time was found to be 3.484 min. The proposed method was successfully applied to the determination of bilastine in tablet dosage form. High linearity of developed method was confirmed over concentration range of (20-120) µg/ml and correlation co-efficient is 0.9997. The percentage relative standard deviation for precision and accuracy of the method was found to be <2 %. The recovery was in the range of 98.8 %-99.7 %; limit of detection was found to be 0.1352 µg/ml and limit of quantification was found to be 0.4098 µg/ml. Bilastine was found to degrade under oxidation condition. There was no interference of excipient and degradation product in retention time, so the method was specific. Analytical parameters such as precision, accuracy, limit of detection, limit of quantification and robustness were determined according to International Conference on Harmonization guidelines.
Keywords
Bilastine, quality by design, reverse phase high performance liquid chromatography, validation, forced degradation study
The expression Quality by Design (QbD) refers to the achievement of a defined and consistent level of quality. Understanding factors and their interactions across a desired series of experiments which is called as an experimental design, is a very useful component of the QbD. QbD principles have been used to advance the product and process the quality in every industry, they have most recently been adopted by the United States Food and Drug Administration (USFDA) as a vehicle for the transformation of how drugs are discovered, developed and economically manufactured. Since, primarily initiated by the USFDA in its “pharmaceutical current Good Manufacturing Practices (cGMP) for the 21st century”, it has become an important concept for the pharmaceutical industry that is further defined in the International Council for Harmonization (ICH) guidance[1-5].
High Performance Liquid Chromatography (HPLC) is a separation method that uses a solid stationary phase and a liquid mobile phase[6]. Because of its advantages such as rapidity, specificity, accuracy, precision and ease of automation, HPLC can be used to test most drugs in multi-component dosage types. Extraction and isolation procedures are no longer necessary with the HPLC process[7].
Bilastine is a highly selected 2nd generation new oral H1 receptor antagonist for the treatment of sympathomimetic of allergic rhino-conjunctivitis and chronic urticaria in adult patients. Rhinoconjunctivitis and urticarial response to antihistamine treatment and bilastine is an antihistamine agents which acts by the inhibition of immune system reaction mediated histamine receptor[8-10].
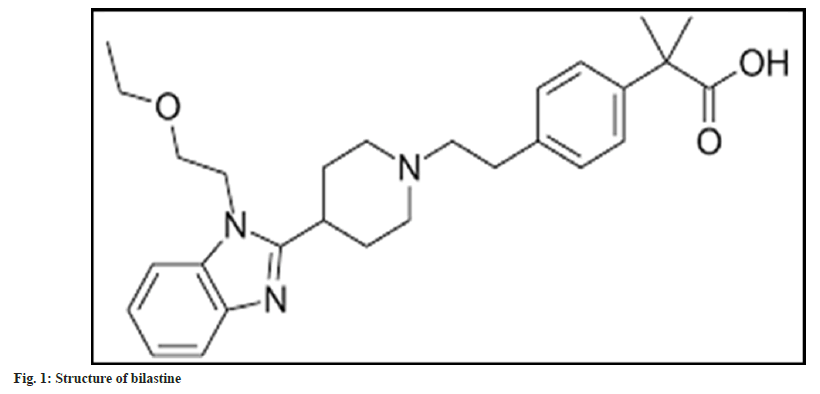
Bilastine or 2-[4-(2-(4-(1-(2-ethodyethyl)-1Hbenzimidazole- 2-yl) piperidine-1-yl) ethyl) phenyl]- 2-methyl propionic acid, is a new next-generation antihistamine (fig. 1). It is a new piperidine molecule and belongs to the same chemical group as many new antihistamines[11]. Within this group, it is chemically close to the piperidine-benzimidazole subgroup, which also includes molecules such as norastemizole and mizolastine.
The drug bilastine is Central Drugs Standard Control Organization (CDSCO) approved for symptomatic treatment of allergic rhino-conjunctivitis. On literature survey, it was found that few Ultraviolet- Visible (UV-VIS) spectrophotometry, High Performance Thin Layer Chromatography (HPTLC), Reverse Phase (RP)-HPLC methods and degradation studies are available for the determination of bilastine in tablet dosage form[12-20]. According to literature survey, method development approaches specifically focused on pharmaceutical developments which have not been discussed. It was planned to develop simple, rapid and sensitive RP-HPLC method for the estimation of bilastine in tablet dosage form. Applying more robust methods which produce consistent, reliable and quality data throughout the life cycle and in turn leads to less method incidents when used in routine environment[21-23]. Critical attributes and method attribute parameters have been determined which have developed more robust methods[24-26]. Stress study was carried out under the condition of acid and base hydrolysis, oxidation degradation, thermal degradation and photolytic degradation, as mentioned in ICH Q1A(R2) guidelines[27], and the method was validated as per ICH guideline Q2 (R1) [28]. Forced degradation study is a powerful tool for the development of stability indicating method[29-32]. These studies help to gain a better understanding of active pharmaceutical ingredients and drug product[33], thereby help to specify the specificity of the stability indication methods and provide insight into degradation pathways and degradation products of the drug substance[34].
Materials and Methods
Reagents and chemicals:
Bilastine sample was obtained from Cubic Pharmaceuticals., Ltd., while HPLC-grade methanol and acetonitrile were purchased from Merck Life Science Pvt. Ltd., Mumbai, India. Bilastine tablet (Bilagra, 20 mg) was purchased for the analytical purpose. All the other reagents and chemicals used were of Analytical Research (AR) grade which were purchased from Avantor Performance Material India, Ltd., Thane, India.
HPLC method development by QbD approach:
Chromatographic conditions and equipment: Analysis was carried out on a Shimadzu LC_2010CHT HPLC with UV detector. The output signal was monitored and processed using LC solution software. The chromatographic column used was octadecylsilane (C18) column (250 mm×4.6 mm and 5 μm). Gradient elution process was adopted throughout the analysis. We used methanol:acetonitrile as mobile phase in the ratio 90:10 % v/v. The gradient flow of mobile phase was maintained at 1.0 ml/min; the injection volume was 20 μl and the column was maintained at room temperature. Eluted sample was monitored at 280 nm whose run time was 10 min.
Factorial design: After defining the Quality Target Product Profile (QTPP) and Critical Quality Attributes (CQAs), the central composite experimental design was applied to optimization and selection of two key components, mobile phase and flow rate of HPLC method. The various interaction effects, quadratic effects of the mobile phase composition, flow rate on the Retention time (Rt) and Tailing factor (Tf) were studied using central composite statistical screening design.
A 2-factor, mobile phase composition and flow rate at 2 different levels, design was used with Design Expert® software (Version 11.0, Stat-Ease Inc.,) which was the best suited response for 2nd order polynomial exploring quadratic response.
Y=β0+β1A+β2B+β12AB+β11A2+β22B2+β21B2A+β12A2B
Where A and B are independent variables coded for levels, Y is the measured in response associated with each combination of factor level. β0 is an intercept and β1 to β22 are regression coefficients derived from experimental runs of the observed experimental values of Y. Inter-action and quadratic terms respectively represent the terms AB, A2 and B2.
Since multivariable interaction of variables and process parameters have been studied, the factors were selected based on preliminary analysis. As independent variables, mobile phase and flow rate compositions were chosen (Table 1). The dependent variables were Rt and Tf as dependent variables for proposed independent variables.
| Factor | Coded values given factor | Levels | ||
|---|---|---|---|---|
| -1 | 0 | 1 | ||
| Mobile phase | A | 85:15 | 90:10 | 95:05 |
| Flow rate | B | 0.8 | 1 | 1.2 |
Table 1: Coded Values for Independent Variables
Using the Central Composite Design (CCD) approach, these method conditions were assessed. At the 1st step, the conditions for Rt and Tf were evaluated; for bilastine, this resulted in distinct chromatographic conditions and the proven acceptable range from robust regions was depicted as the deliberate variations in the method parameters which do not affect the quality. This ensures that the method does not fail downstream during validation testing. If the modeling experiments do not have the desired response, the variable needs to be optimized at different levels until the responses are within the acceptable ranges. The best suited chromatographic conditions shall be optimized using the Design- Expert tools.
Risk assessment: The optimized final method is selected against the attributes of the method like that of the developed method which is efficient and will remain operational throughout the product’s lifetime. Risk based approach based on the QbD principles set out in ICH Q8 and ICH Q9 guidelines was applied for the evaluation of method to study the robustness and ruggedness. The parameters of the method or its performance under several circumstances such as various laboratories, chemicals, analysts, instruments, reagents and days were evaluated for robustness and ruggedness studies.
Selection of optimization design: The most important factors were further examined by use of response surface design methodology. CCD could predict the optimum condition with lowest runtime, therefore saving time and cost; thus this technique was considered for study. Number of experiments to be executed for 2-factors and two levels for different experimental design are shown using the below given formula.
2(K)+2K+C=22+2(2)+5=13
Where, K=number of factors and C=number of centre points
Preparation of standard and test solutions:
Preparation of stock solution: Stock solution for optimization experiments and method validation were prepared by accurately weighing 10 mg of bilastine and dissolving it in 100 ml of methanol by gentle stirring to yield final concentration of 100 μg/ ml.
Preparation of working standard solutions: Working standard solution was prepared by accurately transferring the (0.2, 0.4, 0.6, 0.8, 1.0 and 1.2 ml) aliquots of the standard stock solution in a series of 10 ml volumetric flask. The volume was made up to mark mobile phase to obtain concentration of 20-120 μg/ml.
Preparation of sample solution: 10 Bilagra (20 mg bilastine) tablets of marketed formulation were taken, whose average determined weight of the content is 113.4 mg. 56.7 mg weight equivalent to 10 mg bilastine was transferred to 10 ml volumetric flask and dissolved in methanol. The solution was sonicated and filtered through Whatman filter paper.
Forced degradation study: Forced degradation studies of the drug were carried out under conditions of acid hydrolysis (0.1 N Hydrochloric acid (HCl) at 60°), alkali hydrolysis (0.1 N Sodium hydroxide (NaOH) at 60°), oxidative degradation, thermal degradation and photolytic degradation.
Method validation:
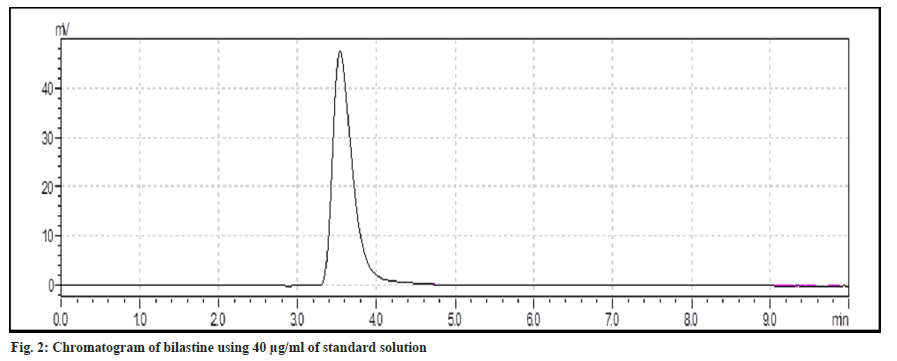
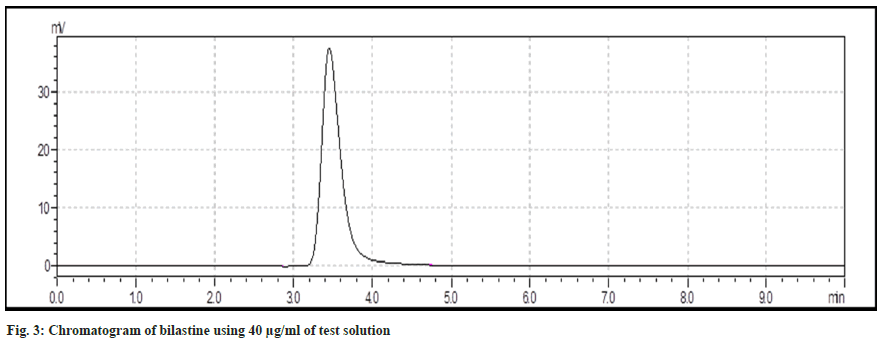
Specificity: It is the ability to assess unequivocally the analyte in the presence of components which may be expected to be a present. Specificity of the method was evaluated by comparison between chromatogram of standard and test solutions. There should be absence of any interfering peak with peak of analyte.
System suitability test parameters: System suitability tests are used to verify that the resolution and repeatability of the system were adequate for the analysis intended. The parameters used in this test were the chromatographic retention time, peak area, theoretical plate number and Tf. The repeatability of these parameters was checked by injecting the solution of bilastine six times.
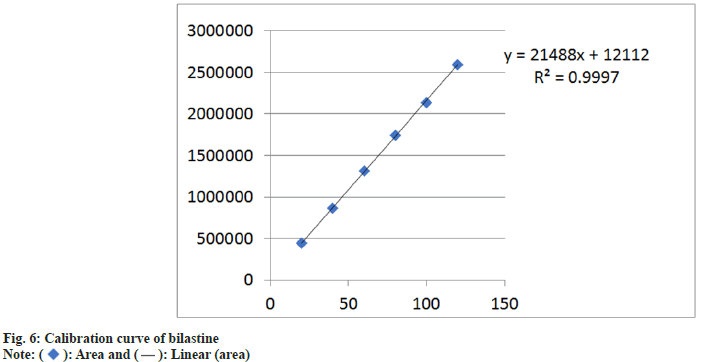
Linearity and range: Aliquots of working standard solutions (0.2, 0.4, 0.6, 0.8, 1.0 and 1.2 ml) were transferred into series of 10 ml volumetric flask and diluted up to mark with methanol. These yielded solution of 20, 40, 60, 80, 100 and 120 μg/ml of it. An aliquot of 20 μl of each solution was injected under operating chromatographic condition. Calibration curve of area vs. respective concentrations was plotted and found out correlation co-efficient and regression line equation for bilastine. Each response was average of 3 determinations.
Precision: It was categorized into two types, intra- and inter-day precision. Intra-day precision was determined by analyzing of bilastine standard solutions in the range 40, 60 and 80 μg/ml of it triplicate in a day; % Relative Standard Deviation (RSD) for bilastine was calculated. Similarly, interday precision was determined analyzing bilastine standard solutions in the range 40, 60 and 80 μg/ml on 3 different d; % RSD for bilastine was calculated.
Accuracy: Accuracy was determined by calculating recovery of bilastine by the standard addition method. The known amounts 0.32, 0.4 and 0.48 ml of working standard solutions of bilastine were added to 0.4 ml test solution of bilastine in vial. Each solution was injected in triplicate and the recovery was calculated from regression equation of calibration curve by measuring the peak areas.
Limit of Detection (LOD) and Limit of Quantification (LOQ): LOD and LOQ of the drug were calculated using following equations according to ICH guidelines. LOD was 3.3 σ/s and LOQ was 10 σ/s; where σ is the standard deviation of regression line and S is the slope of the calibration curve.
Robustness: The robustness study was performed to evaluate the influence of small but deliberate variation in the chromatographic condition. The robustness was checked by changing 4 small changes in flow rate (1±0.2 ml/min), mobile phase (90±5 ml) and injection volume (20±5 μl). Then each sample solution was injected and percentage assay with system suitability parameters were checked.
Results and Discussion
Wavelength measurement was determined. Standard spectra of bilastine were scanned between 200-400 nm. It is evident that bilastine show an absorbance at 280 nm. Chromatogram for standard and test bilastine has been depicted in fig. 2 and fig. 3.
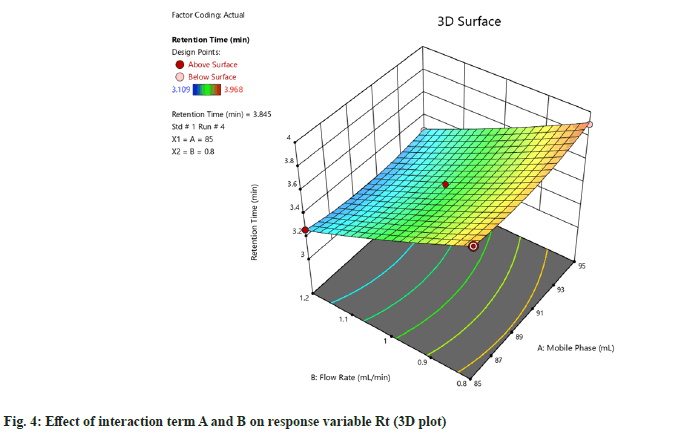
Method optimization by QbD approach execution of experimental design and responses were evaluated (Table 2). Analysis of model was carried out using Analysis of Variance (ANOVA) for Quadratic model for response of Rt of bilastine was studied (Table 3). Lack of Fit (F-value) of the model denoted 520.68, implying that the model is significant. There is only a 0.01 % chance that F-value could vary due to noise. Similarly, p<0.050 indicate are found to be significant. In this case A, B, A2, B2 are significant model terms. F-value of 0.76 implies that it is not significant relative to the pure error. There is a 57.20 % chance that F-value this large could occur due to noise. Non-significant lack of fit is good.
| Standard experiment no. | Run rate | Factor 1 A: Mobile phase composition (ml) |
Factor 2 B: Flow rate (ml/min) | Rt (min) | Tf |
|---|---|---|---|---|---|
| 5 | 1 | 82.92893 | 1 | 3.583 | 1.601 |
| 6 | 2 | 97.07107 | 1 | 3.666 | 1.607 |
| 2 | 3 | 95 | 0.8 | 3.899 | 1.836 |
| 1 | 4 | 85 | 0.8 | 3.845 | 1.849 |
| 9 | 5 | 90 | 1 | 3.484 | 1.507 |
| 8 | 6 | 90 | 1.282843 | 3.109 | 1.225 |
| 7 | 7 | 90 | 0.717157 | 3.968 | 1.932 |
| 10 | 8 | 90 | 1 | 3.485 | 1.501 |
| 4 | 9 | 95 | 1.2 | 3.269 | 1.382 |
| 3 | 10 | 85 | 1.2 | 3.268 | 1.309 |
| 12 | 11 | 90 | 1 | 3.488 | 1.503 |
| 11 | 12 | 90 | 1 | 3.491 | 1.502 |
| 13 | 13 | 90 | 1 | 3.527 | 1.549 |
Table 2: Execution of Experimental Design And Responses
| Source | Sum of squares | Rt | Mean square | F | p |
|---|---|---|---|---|---|
| Model | 0.7651 | 5 | 0.153 | 520.68 | <0.0001 |
| A-mobile phase | 0.0037 | 1 | 0.0037 | 12.64 | 0.0093 |
| B-flow rate | 0.7331 | 1 | 0.7331 | 2494.72 | <0.0001 |
Table 3: Anova Table for Response Rt
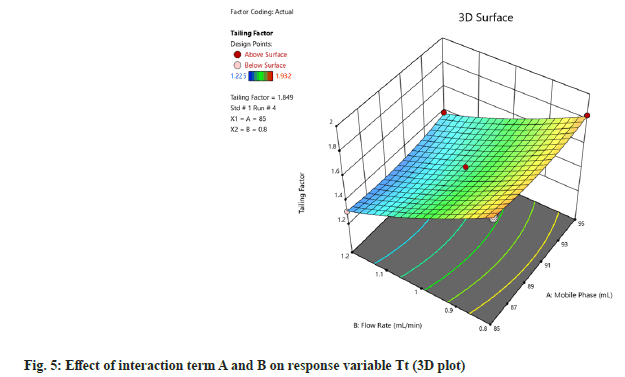
Further, ANOVA for quadratic model for response of Tf of bilastine was studied (Table 4). F-value of the model denoted 355.64, implying that the model is significant. There is only a 0.01 % chance that large F-value could occur due to noise. p<0.0500 was found to be significant. In this case B, AB, A2 and B2 are significant model terms.
| Source | Sum of squares | Tf | Mean square | F | p | |
|---|---|---|---|---|---|---|
| Model | 0.5198 | 5 | 0.104 | 355.64 | <0.0001 | significant |
| A-mobile phase | 0.0006 | 1 | 0.0006 | 2.01 | 0.1997 | |
| B-flow rate | 0.4969 | 1 | 0.4969 | 1699.88 | <0.0001 |
Table 4: Anova Table for Response Tf
F-value of 0.28 implies the value is not significant relative to the pure error. There might be 84.06 % chance of occurrence of error due to noise. Nonsignificant lack of fit is considered to be good. Then 3D plot of the effect of interaction terms A and B on response variable of Rt and Tt were determined (fig. 4 and fig. 5).
Optimization of model was carried out according to the solution suggested by design expert software, where the mobile phase composition included 10:90 and the flow rate was 1 ml/min. 20 μl injection volume was selected as optimized chromatographic condition because shorter migration distance minimizes the use of stationary phase results into economy of analysis. Forced degradation study found that bilastine was marginally degraded in acid and thermal conditions and stable in alkali oxidative and photolytic conditions. Results of forced degradation study have been presented in Table 5.
| S. no | Stress type | Condition | No. of peaks | % degradation |
|---|---|---|---|---|
| 1 | Acid hydrolysis | 0.1 N HCl at 80º for 30 min | 1 | 7.25 |
| 2 | Alkali hydrolysis | 0.1 N NaOH at 80º for 2 h | - | - |
| 3 | Oxidative degradation | 3 % (v/v) H2O2 at 80º for 30 min | 1 | 5.24 |
| 4 | Thermal degradation | At 70º for 8 h | - | - |
| 5 | Photolytic degradation | UV 280 nm for 24 h | - | - |
Table 5: Result of Forced Degradation Study of Bilastine
Specificity of the method was evaluated by comparison between chromatograph of standard and test solutions. There was no any interfering peak in the test sample of chromatogram. It reveals that developed method is specific for bilastine. Linearity and range bilastine was determined and was found to be in the range of 20-120 μg/ml (fig. 6).
Precision was calculated using % RSD; intra-day and inter-day % RSD of bilastine was found to be 0.116631 %-0.295779 % and 0.107392 %-0.491767 %, respectively. Similarly, accuracy of the method was confirmed by recovery study from marketed formulation of bilastine at three levels (80 %-120 %) of standard addition. Percentage recovery for bilastine was found to be 98.8 %-99.7 % (Table 6). LOD and LOQ was found to be 0.1352 μg/ml and 0.4098 μg/ml respectively.
| Formulation level | Amount of test solution (µg/ml) | Amount of standard added (µg/ml) | Amount recovered mean±Standard Deviation (SD)* |
% | % RSD |
|---|---|---|---|---|---|
| 80 % | 40 | 32 | 71.74±0.108 | 98.8 | 0.15 |
| 100 % | 40 | 40 | 79.76±0.122 | 99.7 | 0.153 |
| 120 % | 40 | 48 | 87.35±0.145 | 99.3 | 0.166 |
Note: *Average of three determinations
Table 6: Recovery Data for Bilastine
Robustness was determined using typical variations studied under these parameters such as flow rate, mobile phase composition and injection volume. According to data comparison the developed method was estimated to be robust. Analysis of marketed formulation was studied and tested. Applicability of the proposed method was tested by analyzing the available tablet formulation Bilagra (20 mg). All validation parameters of bilastine results have been presented in Table 7.
| S. no | Parameters | Bilastine |
|---|---|---|
| 1 | Specificity | Specific |
| 2 | Linearity range | 20-120 µg/ml |
| 3 | Regression line equation | Y=21488x+12112 |
| 4 | Correlation co-efficient | 0.9997 |
| 5 | Precision (% RSD) | |
| Repeatability | 0.116631-0.295779 | |
| Inter-day precision | 0.107392-0.491767 | |
| 6 | % assay | 99.72 % |
| 7 | LOD | 0.1352 µg/ml |
| 8 | LOQ | 0.4098 µg/ml |
Table 7: Summary of Validation Parameters for RP-HPLC Method
In conclusion, QbD approach has been successfully applied for development for RP-HPLC method for estimation of bilastine. Primarily, goals of the method have been clarified based on process understanding. The experimental design describes the investigation of the key components including mobile phase composition and flow rate. The interrelationships are studied and optimized conditions are obtained from each combination of conditions. Here, a better understanding of the factors influencing chromatographic separation and greater confidence in the ability of the method to meet their intended purpose is done. It gives symmetric peak shape and reasonable retention for it. The method was validated accordance to ICH guidelines. The developed and validated RP-HPLC method for estimation of bilastine in bulk and tablet dosage form has found to be specific, accurate and precise. Hence method can be used successfully for the routine analysis of bilastine in bulk and tablet dosage form.
Acknowledgement:
The authors are thankful to the Shri Sarvajanik Pharmacy College, Mehsana, Gujarat, India, for providing necessary infrastructure facilities. The authors are also highly grateful to the Dr. C. N. Patel sir for the generous gift sample of pure bilastine.
Conflict of interests:
The authors declare no competing interests.
References
- Bhatt DA, Rane SI. QbD approach to analytical RP-HPLC method development and its validation. Int J Pharma Pharma Sci 2011;3(10):179-87.
- Jadhav ML, Tambe SR. Implementation of QbD approach to analytical method development and validation for the estimation of propafenone hydrochloride in tablet dosage form. Chrsom Res Int 2013;4(11):120-7.
- Nadpara NP, Thumar RV, Kalola VN, Patel PB. Quality by Design (QbD): A complete review. Int J Pharma Sci Rev Res 2011;17(2):20-8.
- Roy S. Quality by design: A holistic concept of building quality in pharmaceuticals. Int J of Pharm Bio Res 2012;3(2):100-8.
- Patel VP, Shihora HD. Experimental design and patent. 1st Ed; Akshat Publication 2011. p.1-35.
- Deokar AU, Siddheshwar S, Kakad SB. Kakad. Analytical method development and validation of rivaroxaban: A review. Res J Sci Tech 2020;12(1):36-46.
- Synder LR, Kirkland JL, Glajch JL. Practical HPLC method development. 2nd Ed; Wiley Interscience 1977. p. 1-26.
- Gandhi J, Godse K, Godse G. Bilastine: A novel antihistamine. Indian J Drugs Dosage form 2010; 4(1): 3-6.
- Sarode N, Chhabra GS, Luhar S, Jadhav A. Development and validation of RP-HPLC method for the estimation of montelukast sodium in bulk and in tablet dosage form. Res J Sci Tech 2011;3(5):257-60.
- Ramesh J, Jayalakshmi B, Vijayamirtharaj R, Arul Prakasam KC. Simultaneous estimation of montelukast sodium and levocetrizine hydrochloride by RP-HPLC method. Asian J Res Chem 2010;3(4):1069-72.
- QbD approach to analytical RP-HPLC method development and its validation
- Jelena T, Igor P, Ana S, Anja T, Biljana J. Application of analytical quality by design concept for bilastine and its degradation impurities determination by hydrophilic interaction liquid chromatographic method. J Pharm Biomed Anal 2016;125:385-93.
[Crossref] [Google Scholar] [PubMed]
- Google Scholar
- Andressa TDS, Gabriela RB, Isadora DM, Lisiane B, Marcelo DM, Clesio SP. UV spectrophotometric method for quantitative determination of bilastine using experimental design for robustness. Drug Anal Res 2017;1(2):38-43.
- Chowdary V, Kota A, Syed M. Method development and validation of new RP-HPLC method for the estimation of bilastine in pharmaceutical dosage form. World J Pharma Pharm Sci 2017;6(8):2297-315.
- Ouarezki R, Guermouche S, Guermouche MHS. Degradation kinetics of bilastine determined by RP-HPLC method and identification of its degradation product in oxidative condition. Chem Pap 2020;74:1133-42.
- Chowdhury SR, Maleque M, Shihan MH. Development and validation of a simple RP-HPLC method for determination of caffeine in pharmaceutical dosage forms. Asian J Pharma Anal 2012;2(1):1-4.
- Gupta A, Rawat S, Pandey A. Method development and photolytic degradation study of doxofylline by RP-HPLC and LC-MS/MS. Asian J Pharma Anal 2011;1(2):29-33.
- Patil SD, Varpe P, Chaure S, Bhalerao SB, Kshirsagar S. Development and validation of stability indicating RP-HPLC method for piracetam. Asian J Res Pharma Sci 2017;7(4):215-21.
- Shah H, Patel KK, Chaudhary P, Patel CN. Stability indicating analytical method development and validation for estimation of zonisamide in pharmaceutical dosage form. World J Pharma Res 2020;9(5):1204-15.
- Zhou H, Fung C, Liu Q. Method for determining related substance of bilastine intermediate by using high-performance liquid chromatography. China Patent CN 103760260A; 2014.
- Method for separating and measuring bilastine raw material and preparation thereof utilizing liquid chromatography. China Patent CN 103760260A 2019.
- Tambe R, Mankar S, Dighe S. Analytical method development and validation of paliperidone: A review. Res J Sci Tech 2020;12(1):23-35.
- Sharma D, Patel K, Patel CN. Qbd: A new era of pharmaceutical drug development. Euro J Pharma Med Res 2021; 8(5):688-694.
- Shah PB, Patel K. Qbd-a novel setup for the analytical method development. World J of Pharm Pharma Sci 2021;10(5):1645-62. [Crossref]
[Google Scholar] [PubMed]
- Chauhan P, Modi D, Seemabanu M, Giri S, Rathod A, Patel KK, et al. Review on analytical quality by design and pat. World J Pharma Res 2022;11(14):244-66.
- Guideline Q1A(R2). Stability testing of new drug substances and products. In: Proceedings of the International Conference on Harmonization; 1993.
- Gupta A, Yadav JS, Rawat S, Gandhi M. Method development and hydrolytic degradation study of doxofylline by RP-HPLC and LC-MS/MS. Asian J Pharm Anal 2011;1(1):14-8.
- Haque A, Shahriar M, Parvin MN, Islam SM. Validated RP-HPLC method for estimation of ranitidine hydrochloride, domperidone and naproxen in solid dosage form. Asian J Pharm Anal 2011;1(3):59-63.
- Patel KK, Patel AM, Patel CN. A new simple RP-HPLC Method development, validation and forced degradation studies of bilastine. Asian J Pharm Anal 2021;11(3):183-7.
- Patel K, Shah UA, Joshi HV, Patel JK, Patel CN. QbD Stressed development and validation of stability-indicating RP- HPLC method for the simultaneous estimation of linagliptin and metformin HCl in pharmaceutical dosage form. Res J Pharm Tech 2022;15 (5):1917-23.
- Patel K, Shah UA, Joshi H, Patel CN. Derivative spectrophotometric method development and validation for the estimation of evogliptin tartrate in pharmaceutical dosage form. Indian J Pha Ed Res 2023;57(1):228-33.
- Vaibhavi NA, Khushbu KP, Patel KS, Parajapati LM, Patel CN. Development and validation RP-HPLC method for estimation of prucalopride succinate in pharmaceutical dosage form. World J Pharm Pharma Sci 2020;9(6):1112-22.
- Satyanarayana L, Naidu SV, Rao MN, Latha RS. The estimation of nilotinib in capsule dosage form by RP-HPLC. Asian J Pharm Ana 2011;1(3):70-8. [Crossref]
