- *Corresponding Author:
- Atamjit Singh
Department of Pharmaceutical Sciences
Guru Nanak Dev University
Amritsar, Punjab – 143 005, India
E-mail: atampanesar@gmail.com
| Date of Received | 05 December 2019 |
| Date of Revision | 20 June 2020 |
| Date of Acceptance | 25 June 2020 |
| Indian J Pharm Sci 2020;82(4):632-639 |
This is an open access article distributed under the terms of the Creative Commons Attribution-NonCommercial-ShareAlike 3.0 License, which allows others to remix, tweak, and build upon the work non-commercially, as long as the author is credited and the new creations are licensed under the identical terms
Abstract
A fast, inexpensive and direct quantitative Fourier-Transform Infrared Spectroscopic method was established for rosuvastatin calcium for analysis in bulk and solid pharmaceutical dosage forms. Content of rosuvastatin calcium was directly analysed without any solvent extraction by this method. Absorption mode was used on KBr pallets for acquisition of Fourier-Transform Infrared spectra. The method was validated against prescribed parameters as per International Council for Harmonisation guidelines. Range of linearity range was found to be 5-20% w/w in KBr pellet method. Proposed method was successfully applied for the determination of rosuvastatin in solid pharmaceutical dosage forms (tablets). The results suggest that the method is precise, accurate and reproducible. Due to its simplicity, cost effectiveness and less time taking, this method can be employed for routine estimation of rosuvastatin calcium in solid dosage forms in pharmaceutical industry.
Keywords
Fourier-Transform infrared spectroscopy; rosuvastatin; pharmaceutical analysis; quantitative analysis; green analysis
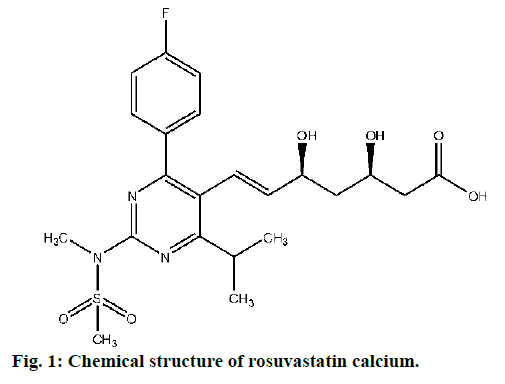
Rosuvastatin calcium (fig. 1) is a new generation β-Hydroxy β-methylglutaryl-CoA (HMG-CoA) reductase inhibitor and the most potent of the currently available statins. It is mostly prescribed to reduce the elevated levels of cholesterol, low-density lipoprotein cholesterol (LDL-C), triglycerides and to increase the levels of high-density lipoprotein cholesterol (HDL-C), apolipoprotien B: A1 ratio in the patients suffering from mixed dyslipidaemia, primary hypercholesterolemia, and homozygous familial hypercholesterolemia. It is also prescribed for acute coronary syndromes. It has low extrahepatic tissue penetration as well as lower potential for CYP3A4. Adequate clinical trial evidences are available that confirms the LDL-C lowering efficacy and safety of high-dose rosuvastatin calcium in acute coronary syndromes [1-4]. Rosuvastatin calcium is mostly prescribed drug in obesity management thus manufactured by all leading pharmaceutical firms across the globe. Its sale is estimated to elevate further due to increasing trend of obesity in peoples (https://www.transparencymarketresearch.com).
Increased consumption directly elevate the demand which end up in increased production. Meantime quality of the marketed formulations during manufacturing process totally depends upon the reliability and effectiveness of analytical methods that are able to generate consistent and interpretable data [5,6]. Various methods have been developed so far by the analysts across the globe for the assessment of rosuvastatin calcium in individual or combined dosage form based on various analytical techniques. Those established method includes spectrophotometric [7-16], High Performance Liquid Chromatography (HPLC) [17-50], Ultra Performance Liquid Chromatography (UPLC) [51,52], electrode [53], High Performance Thin Layer Chromatography (HPTLC) [54,55], Capillary zone electrophoresis [56], Voltammetry: hanging mercury drop electrode [57], Charge-transfer complex [58]. No doubt these methods are able to deliver desired analytical accuracy but came with added disadvantages too. Along with high cost, complicated procedures and long time consuming analysis, major emerging issue is the impact of these analytical methods on environment. All these established methods consume large volume of organic solvents (someone include hazardous solvents) that are toxic to the workers as well as environment that is forcing the pharmaceutical and chemical firms to look after the ways to reduce the generation of toxic waste [59]. Therefore, it is a global emergency to develop green methods of analysis especially for the analytical operations carried out in pharmaceutical and chemical industries.
Among the spectroscopic techniques, Infrared (IR) spectroscopy has its distinguished place because of analytical ability without utilization of organic solvents. IR radiation region exist between microwave and visible region which can be efficiently used for the analysis of compounds sensitive between 4000 and 400 cm-1.
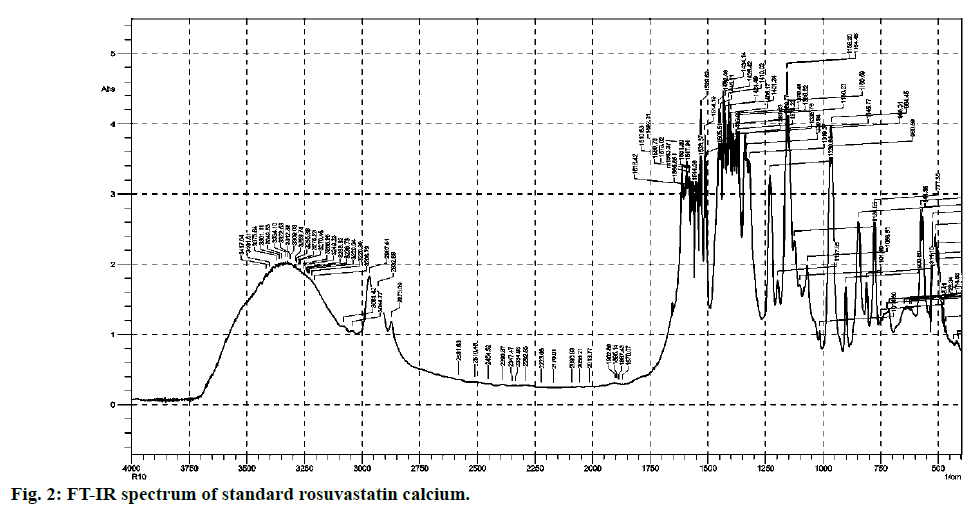
Fourier-transform infrared (FT-IR) spectroscopy is gaining much popularity in pharmaceutical industry as quality control tool due to its rapid and non-destructive nature, simple sample preparation methods, less or no solvent consumption in qualitative as well as quantitative analysis of raw materials and finished drug products. FT-IR spectroscopy is an optimum choice for minimizing the environmental hazards due to industrial chemical waste as it need very less or no solvent for analysis [60-68]. The structure of rosuvastatin calcium contains various functional groups major one includes O-H stretching of carboxylic acid, O-H stretching (intermolecular bonded), S=O stretching. The band appearing near 810 and 1197 cm-1 were selected for quantification as at that band interference from excipient’s in pharmaceutical formulation is minimal.
Objective of the present investigation was to developing an inexpensive, rapid and environmental friendly method for quantitative analysis of rosuvastatin calcium in bulk as well as solid dosage forms using FT-IR spectroscopy.
Materials and Methods
Analytical grade rosuvastatin calcium kindly gifted by Lupin Research Park was employed in the present study. IR grade KBr was purhcased from Sigma Aldrich for standard as well as sample pellets. Some solid tablet dosage forms of rosuvastatin calcium (i.e. Akroz, Arvast, Bestor, Crestor, Novostat and razel) were procured from local market of India. All IR spectra were recorded on IR Affinity-1 spectrometer of SHIMADZU with KBr accessory and DLATGS detector. The instrument was operated with IRsolution 1.50.
FT-IR calibrations:
For calibration purpose, a set of 4 rosuvastatin calcium standards ranging from 5 to 20 mg in KBr were prepared and to get uniform pellet 100 mg was weighed each time. To get homogenous pellets as well as reproducible results identical pressure was applied each time. Then standards spectra of different concentrations of rosuvastatin calcium in mentioned range were analysed and calibration curve was plotted to get straight line equation. Area under the peak for all standard spectra was computed by selecting specific region for quantification of rosuvastatin calcium in bulk as well as solid dosage forms.
Sample Preparation:
This method needs a simple sample preparation prior to FT-IR spectrum acquisition. This one step method involves grinding of the accurately weighed bulk or solid pharmaceutical samples as fine powder in agate mortar that results decrease in particle size for pellet.
Preparation of KBr pellets (with as well as without sample):
KBr pellets of 100 mg were prepared by taking specific amount of rosuvastatin calcium and oven-dried KBr to ensure no residual moisture content. The mixture was condensed in 13 mm die at a pressure of 7 tons for 5 min. Similar procedure was applied for the pharmaceutical samples also. 2 mg of sample was taken in 98 mg KBr for sample pellet. Prepared pellets were scanned in Mid-Infrared region for recording FT-IR spectra.
FT-IR Parameters for spectral acquisition:
The resolution of the instrument was optimized at 2 cm-1 by average 20 scans in Mid IR region of 4000-400 cm-1. As per beer’s law the concentration and absorbance is proportional to each other, therefore absorbance mode was selected for quantification of rosuvastatin. Fresh background spectrum was recorded from KBr pellet before each FT-IR run for sample as well as standard. All spectra were recorded in KBr pellet form using same optimized analytical conditions in absorption mode (Table 1).
| Measurement mode | Absorption |
|---|---|
| Apodization Frequency range Number of scans Resolution |
Happ-Genzel 4000-400 cm-1 20 2.0 cm-1 |
Table 1: Optimized FT-IR Conditions
Method validation [69]:
Linearity: Linearity of proposed method was established by analysing 4 separate standard rosuvastatin calcium concentrations (5-20% w/w). To get required data least square regression analysis was performed.
Accuracy: Recovery studies were performed to evaluate the accuracy of proposed method. For recover studies, different concentration levels of rosuvastatin calcium, that were prepared independently and analysed (n=9). Accuracy was determined by using percentage relative standard deviation (%RSD and from mean percentage recovery. To establish additional data for the same standard addition method was performed. In this, different concentrations of standard rosuvastatin calcium (8, 10, 12 mg) were added to known pre-analysed solid formulation sample and total concentration was determined using proposed method. Percentage recovery or added standard was calculated as: % Recovery=(Ct-Ci)/Ca
Where,
Ct = Total rosuvastatin calcium concentration measured after standard addition
Ci = Concentration of rosuvastatin calcium in formulation
Ca = Concentration of rosuvastatin calcium added to formulation
Precision:
Repeatability was determined by analysing different concentrations (n=9) of rosuvastatin calcium. Inter-day and Intra-day variations were performed to determine precision of proposed method. Different concentrations of drug in triplicates was prepared on 3 different times in single day and intra-day variation was analysed. Similarly inter-day variation was studied (n=27), %RSD was assessed.
Limit of detection (LOD) and limit of quantification (LOQ)
LOD and LOQ was determined by using calibration of standard. LOD and LOQ were assessed from 3.3σ/S and 10 σ/S. Where, σ is standard deviation and S is slope of y-intercept of regression equation.
Robustness:
Robustness of proposed method was established by analysing slight change in rosuvastatin calcium-KBr weight by ± 0.2 mg and assessed as relative standard deviation.
Result and Discussion
This novel method for analysis of rosuvastatin calcium in pharmaceutical formulations with single step sample preparation using FT-IR spectroscopy has wide range of advantages over previously available lengthy, costly as well as time consuming methods. In this method, extraction process is completely eliminated that make this method rapid, inexpensive and green. That will not only reduce the cost and time of analysis but also eliminate the potential risk of toxic chemicals to manpower as well as environment.
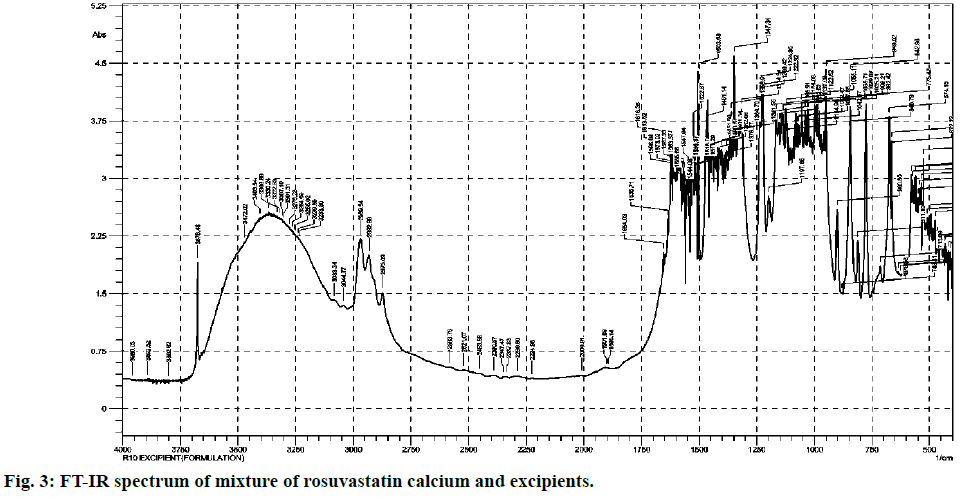
Most commonly used excipients for the solid pharmaceutical dosage forms are magnesium stearate, talcum powder, lactose, starch and avicel. They are added in various ratios that vary from product to product. From comparison of both (fig. 2 and fig. 3), it is clear that standard and excipients + standard spectra easily stretch over the surface of one another. Therefore there is no any significant interference caused by the matrix components which allows that method to practice without any extraction.
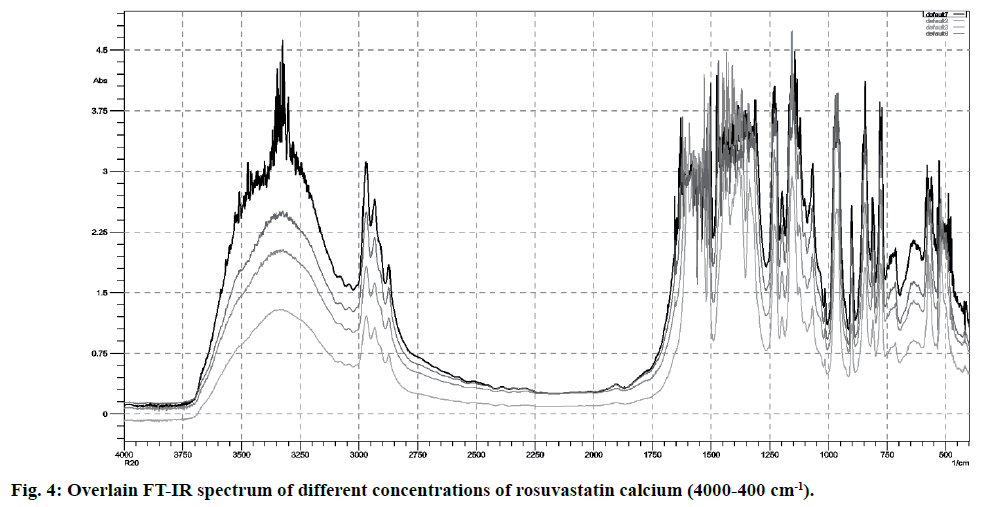
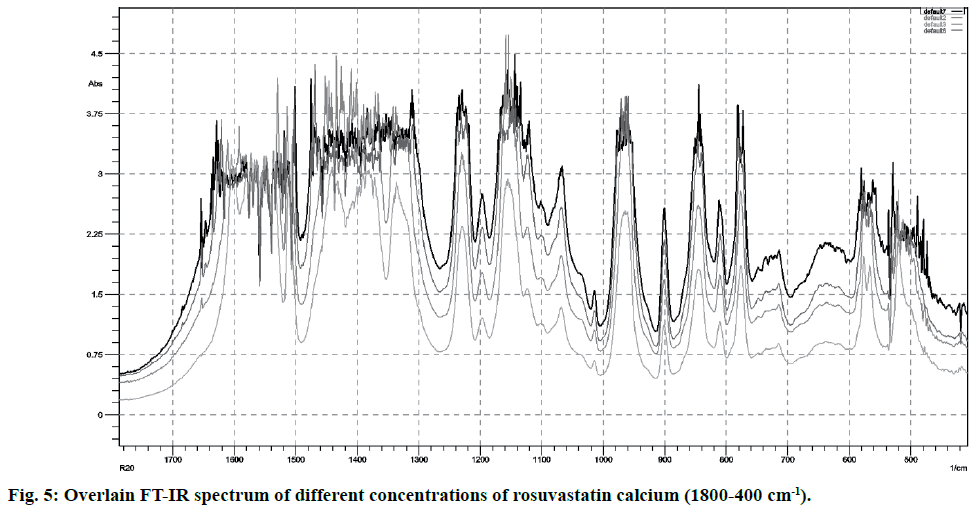
FT-IR spectra of pure rosuvastatin calcium were used for the calibration purpose. Spectra contain several prominent bands; instead of selecting single band, different regions were used for making calibration curves (5-20 % w/w) from peak intensity and peak area for more accurate results. Most linear and suitable regions (810-800 and 1210-1180 cm-1) were selected for the analytical purpose (Table 2). Beer’s law was obeyed between 5 -20 % w/w (fig. 4 and fig. 5).
| Region Selected (cm-1) | Measurement mode | Regression line | Correlation Coefficient |
Recovery (%) |
||
|---|---|---|---|---|---|---|
| 8% (w/w) | 10% (w/w) | 12% (w/w) | ||||
| 800-810 920-880 1080-1090 1210-1180 3000-2900 |
Peak Intensity Peak Area Peak Intensity Peak Area Peak Intensity Peak Area Peak Intensity Peak Area Peak Intensity Peak Area |
0.0956x + 0.700 1.669x + 11.135 0.0968x + 0.675 1.18144x + 10.72 0.1173x + 0.7825 4.9086x + 41.13 0.1038x + 0.715 2.1607x + 14.164 0.1514x + 0.1398 4.6958x + 36.98 |
0.997 0.9988 0.9958 0.9978 0.9976 0.9953 0.9958 0.9987 0.9962 0.9954 |
100.64 99.47 99.10 100.89 99.34 99.22 99.89 99.28 100.24 100.97 |
99.87 100.23 101.3 101.12 99.12 99.36 99.57 100.59 101.2 99.05 |
99.76 100.16 101.6 99.37 99.03 99.97 100.57 100.22 101.7 99.38 |
Table 2: Selection of FT-IR Region for Application of Simple Beer’s Law Calibration and Percentage Recovery
Accuracy ranges from 8 - 12 % w/w. Mean % recovery values were near to 100 % with low standard deviation values (S.D. < 2.0). The reliability of method was established from recovery studies by using standard addition method (Table 2). The mean percentage recovery for 810-800 cm-1 region was 99.47, 100.23 and 100.16 while for 1210-1180 cm-1 region was 99.28, 100.59 and 100.22, respectively.
Precision was evaluated by performing repeatability and intermediate precision data types. Results obtained from repeatability studies indicated the precision of proposed method under similar conditions over short period of time. In intermediate precision results % RSD values were not more than 2.0 % is all cases. That indicates the precision of proposed method with in laboratories (Table 3).
| Concentration (% w/w) |
Peak area | |||
|---|---|---|---|---|
| 800-810 cm-1 | 1210-1180 cm-1 | |||
| Day 1 | Day 2 | Day 1 | Day 2 | |
| 10 10 10 10 10 10 |
29.2435 29.2441 29.2427 29.2442 29.2437 29.2439 |
29.2431 29.2433 29.2436 29.2439 29.2440 29.2432 |
35.4077 35.4099 35.3982 35.4122 35.4015 35.4103 |
35.4012 35.4125 35.4215 35.4018 35.4072 35.4123 |
| Intraday Precision (n=6) | Mean peak area S.D %R.S.D |
29.2436 0.0005 0.0018 |
Mean peak area S.D %R.S.D |
35.4066 0.0055 0.015 |
| Interday Precision (n=6) |
Mean peak area S.D %R.S.D |
29.2435 0.0003 0.0012 |
Mean peak area S.D %R.S.D |
35.4094 0.0076 0.021 |
Table 3: Intermediate Precision Data
LOD as well as LOQ were also calculated and were found to be 0.044 and 0.134 % w/w for 810 -800 cm-1 region while 0.0084 and 0.069 % w/w for 810 -800 cm-1 region respectively. Suitability of the method was confirmed by analysing rosuvastatin calcium in its marketed solid dosage formulations. Assay values indicated insignificant interference of excipients matrix in analysis (Table 4).
| Commercial product | 800-810 cm-1 | 1210-1180 cm-1 | ||
|---|---|---|---|---|
| Amount found (n=5) | % Amount found | Amount found (n=5) | % Amount found | |
| Akroz tablets (10 mg) Arvast tablets(20 mg) Bestor tablets(10 mg) Crestor tablets(10 mg) Novostat tablets(10 mg) Rzel tablets(10 mg) |
10.09 ± 0.11 20.12 ± 0.24 10.03 ± 0.09 10.26 ± 0.15 10.17 ± 0.17 10.19 ± 0.06 |
100.9 ± 0.022 100.6 ± 0.015 100.3 ± 0.038 102.6 ± 0.024 101.7 ± 0.026 101.9 ± 0.017 |
10.11 ± 0.11 20.24 ± 0.24 9.97 ± 0.09 10.16 ± 0.15 10.05 ± 0.17 10.01 ± 0.06 |
101.1 ± 0.022 101.2 ± 0.015 99.7 ± 0.038 101.6 ± 0.024 100.5 ± 0.026 100.1 ± 0.017 |
Table 4: Determination of Rosuvastatin in Solid Dosage Pharmaceutical Fromulations (Tablets)
The present study represents the development of green, sensitive and rapid method for accurate quantification of rosuvastatin calcium in pure drug as well as solid pharmaceutical dosage formulations i.e. tablets using FT-IR spectroscopy. This method performed better as compare to previously reported methods. This method has made analysis simple by eliminating hazardous and complex step of extraction. This method has potential to replace the existing laborious, non-ecofriendly as well as costly methods for the analysis of rosuvastatin calcium in pharmaceutical as well as chemical industry.
Acknowledgements:
Authors are gratefully acknowledge Laureate Institute of Pharmacy, Kathog, Jawalamukhi, H.P., India for providing all the necessary facilities for doing all the research work. Authors are thankful to UGC for providing NFOBC fellowship to AS.
References
- Aggarwal RK, Showkathali R. Rosuvastatin calcium in acute coronary syndromes. Expert Opin Pharmacother 2013;14(9):1215-27
- Cheng JWM. Rosuvastatin in the management of hyperlipidemia. Clin Ther 2004;26:1368-87.
- Luvai A, Mbagaya W, Hall AS, Barth JH. Rosuvastatin: A review of pharmacology and clinical effectiveness in cardiovascular disease. Clin Med Insights Cardiol 2012;6:17-33.
- Soran H, Durrungton P. Rosuvastatin: efficacy. Safety and clinical effectiveness. Expert Opin Pharmacother 2008;9:2145-60.
- Uyar B, Celebier M, Altinoz S. Spectrophotometric determination of rosuvastatin calcium in tablets. Pharmazie 2007;62:411-13.
- Gupta A, Mishra P, Shah K. Simple UV Spectrometric determination of rosuvastatin calcium in pure form and in pharmaceutical formulations. E-J CHEM 2009;6:89-92.
- Krishna MV, Sankar DG. Extractive spectrophotometric methods for the determination of rosuvastatin calcium in pure form and in pharmaceutical formulations by using safranin O and methylene blue. E-J CHEM 2007;4:46-49.
- Ramadan AA, Mandil H, Alshelhawi N. Spectrophotometric determination of rosuvastatin calcium in pure form and pharmaceutical formulations by the oxidation using iodine and formation triiodide complex in acetonitrile. Int J Pharm Pharm Sci 2014;6:579-85.
- Lima MF, Cassella RJ, Pacheco WF. Spectrophotometric determination of rosuvastatin in pharmaceutical formulations using quinalizarin. Braz J Pharm Sci 2017;53:1-8.
- Ramadan AA, Mandil H, Ali RS. Spectrophotometric determination of rosuvastatin in pure form and pharmaceutical formulations through ion-pair complex formation using bromocresol green. Int J Pharm Pharm Sci 2015;7:191-98.
- Prajapati PB, Bodiwala KB, Marolia BP, Shah SA. Development and Validation of extractive spectrophotometric method for determination of rosuvastatin calcium in pharmaceutical dosage forms. J Pharm Res 2010;3:2036-38.
- Sevda RR, Ravetkar AS, Shirote PJ. UV spectrophotometric estimation of rosuvastatin calcium and fenofibrate in bulk drug and dosage form using simultaneous equation method. Int J Chemtech Res 2011;3:629-35.
- El-Bagary RI, El-Kady EF, Kadry AM. Spectrofluorometric determination of certain antihyperlipidemic agents in bulk and pharmaceutical preperations. Spectroscopy 2012;27:83-92.
- Patel B, Jadav A, Solanki H, Parmar S, Parmar V, Captain A. Development and validation of derivative spectroscopic method for simultaneous estimation of rosuvastatin calcium and fenofibrate in tablet. Int J Pharm Sci Rev Res 2013;2:1-6.
- Ambole SR, Shirote PJ, Kondawar MS. Simultaneous estimation of rosuvastatin calcium and aspirinfrom capsule dosage forms by first order derivative spectroscopic method. Int J Chemtech Res 2012;4:966-70.
- Karunakaran A, Subjash V, Chinthala R, Muthuvijayan J. Simultaneous estimation of rosuvastatin calcium and fenofibrate in bulk and tablet dosage form by UV-Spectrophotometry and RP-HPLC. Stamford J Pharm Sci 2011;4:58-63.
- Sharma S, Bhandari P. Simultaneous estimation of rosuvastatin calcium and fenofibrate in bulk and in tablet dosage form by UV-spectrophotometry and RP-HPLC. J Pharm Res 2012;5:2311-14.
- Afroz A, Haque T, Talukder MU, Islam SMA. Spectrophotometric estimation of rosuvastatin calcium and glimepiride in tablet dosage form. AJPAna 2011;1:74-78.
- Parmar V, Solanki H, Prajapati L. Derivative spectrophotometric determination of rosuvastatin calcium and fenofibrate in tablet dosage form. Inventi Rapid-Pharm Analysis and Quality Assurance 2013;2:1-5.
- Beludari MI, Prakash KV, Mohan GK. RP-HPLC method for simultaneous estimation of rosuvastatin and ezetimibe from their combination tablet dosage form. Int J Chem Anal Sci. 2013;4:205-09.
- Eswarudu MM, Mounica P, Venkatesh D, Nagalakshmi B. Method development and validation for simultaneous estimation of rosuvastatin calcium and ezetimibe in pharmaceutical dosage form by RP-HPLC. Int Res J Pharm Appl Sci 2012;2:24-36.
- Rao AL, Suneetha D. Development and validation of RP-HPLC method for the estimation of rosuvastatin in bulk and pharmaceutical dosage form. Int J Chem Sci 2010;8:1308-14.
- Haq N, Shakeel F, Alanazi F, Alshora DH, Ibrahim MA. Development and validation of a green RP-HPLC method for the analysis of rosuvastatin: a step towards making liquid chromatography environmentally benign. Green Process Synth 2017;6:1-10.
- Mostafa NM, Badawey AM, Lamie NT, El-Aleem AEBA. Selective chromatographic methods for the determination of rosuvastatin calcium in the presence of its acid degradation products. J Liq Chromatogr Relat Technol 2014;37:2182-96.
- Kaila HO, Ambasana MA, Thakkar RS, Saravaia HT, Shah AK. A new improved RP-HPLC method for assay of rossuvastatin calciumin tablets. Indian J Pharm Sci 2010;72:592-98.
- Janardhanan VS, Manavalan R, Valliappan K. Chemometric technique for the optimization of chromatographic system: Simultaneous HPLC determination of rosuvastatin, Telmisartan, Ezetimibe and Atorvastatin used in combined cardiovascular therapy. Arab J Chem 2016;9:1378-87.
- Kishore CRP, Mohan GVK. Structural identification and estimation of rosuvastatin calcium related impurities in rosuvastatin calcium tablet dosage form. Anal Chem Res 2017;12:17-27.
- Gomes FP, Gracia PL, Alves JMP, Singh AK, Kedor-Hackmann ERM, Santoro MIRM. Development and validation of stability indicating HPLC methods for quantitative determination of Pravastatin, Fluvastatin, Atorvastatin and Rosuvastatin in parmaceuticals. Anal Lett 2009;42:1784-04.
- Sri DS, Kumar TH, Rao KVP, Rao YS. Validated RP-HPLC method for simultaneous determination of rosuvastatin calcium and ezetimibe in pharmaceutical dosage form. Int J Pharm Pharm Sci 2015;7:209-13.
- Sultana N, Arayne MS, Shah SN, Shafi N, Naveed S. Simultaneous determination of prazocin, atorvastatin, rosuvastatin and simvastatin in API, dosage formulations and human serum by RP-HPLC. J Chin Chem Soc 2010;57:1286-92.
- Sultana N, Arayne MS, Shahzad W. Siimultaneous determination of ceftriaxone sodium and statin drugs in pharmaceutical formulations and human serum by RP-HPLC. J Chil Chem Soc 2010;55:193-98.
- Arayne MS, Sultana N, Mirza AZ, Shamshad H. High-Performance Liquid Chromatographic analysis of pioglitazone, gliquidone, rosuvastatin and simvastatin in formulations and human serum. Chin J Chem 2010;28:1998-2002.
- Gajjar AK, Shah VD. Development and validation of a stability-indicating reversed-phase HPLC method for simultaneous estimation of rosuvastatin and ezetimibe from their combination dosage forms. Eurasian J Anal Chem 2010;5:280-98.
- Sultana N, Arayne MS, Ali SN. An ultra-sensitive LC method for simultaneous determination of rosuvastatin, alprazolam and diclofenac sodium in API, pharmaceutical formulations and human serum by programming the deterctor. J Anal Bioanal Tech 2012;3:1-6.
- Tabassum A, Arayne MS, Sultana N. Quantitation and monitoring of gemifloxacin and rosuvastatin by liquid chromatography with UV-Detection. Int J Adv Res 2014;2:842-51.
- Pasha K, Muzeeb S, Basha SJS, Shashikumar D, Mullangi R, Srinivas NR. Analysis of five HMG-CoA reductase inhibitors atorvastatin, lovastatin, pravastatin, rosuvastatin and simvastatin: pharmacological, pharmacokinetic and analytical overview and development of a new method for use in pharmaceutical formulation analysis and in vitro metabolism studies. Biomed Chromatogr 2006;20:282-93.
- Shamshad H, Sultana N, Arayne MS. Simultaneous determination of cetirizine, atorvastatin, simvastatin, rosuvastatin or pravastatin in formulations and human serum by RP-HPLC. Anal Chem Lett 2015;5:109-16.
- Ustun Z, Talay A, Dermiralay EC. Optimization of RPLC conditions for quantitative analysis of atorvastatin and rosuvastatnin in pharmaceutical dosage form. SDU J Sci 2016;11:72-81.
- Nasir F, Iqbala Z, Khana A, Ahmada L, Shaha Y, Khana AZ, Khana JA, Khanb S. Simultaneus determination of timolol maleate, rosuvastatin calcium and diclofenac sodium in pharmaceuticals and physiological fluids using HPLC-UV. J Chromatogr B 2011;879:3434-43.
- Ashfaq M, Akhtar T, Mustafa G, Danish M, Razzaq SN. Nazar MF. Simultaneous estimation of rosuvastatin and amlodipine in pharmaceutical formulations using stability indicating HPLC method. Braz J Pharm Sci 2014;50:629-38.
- Tajane D, Raurale AM, Bharande PD, Mali AN, Gadkari AV, Bhosale VR. Development and validation of a RP-HPLC-PDA method for simultaneous determination of rosuvastatin calcium and amlodipine besylate in pharmaceutical dosage form. J Chem Pharm Res 2012;4:2789-94.
- Sharma S, Bhandari P. Simultaneous estimation of rosuvastatin calcium and fenofibrate in bulk and in tablet dosage form by UV – Spectroscopy and RP-HPLC. J Pharm Res 2014;5:2311-14.
- Gaikwad S, Kawale LA, Ahire K, Yadav S, Bodile S. Development and validation of stability indicating RP-HPLC method for simultaneous estimation of rosuvastatin calcium and fenofibrate in bulk and pharmaceutical dosage form. Indo Am J Pharm Res 2016;6:5521-30.
- Khivasara A, Kawale LA, Shirode L, Badhe N, Ahire P, Lale S. Development and validation of stability indicating RP-HPLC method for simultaneous estimation of rosuvastatin calcium and aspirin in bulk and pharmaceutical dosage form. Indo Am J Pharm Res 2016;6:4417-26.
- Sumanlatha M, Pavani KH. Analytical method development and validation for the simultaneous estimation of rosuvastatin and fenofibrate in tablet dosage form by reverse phase high performance liquid chromatography. Ind J Res Pharm Biotechnol 2013;1:850-56.
- Murthy TGK, Geethanjali J. Development of a validated RP-HPLC method for simultaneous estimation of metformin hydrochloride and rosuvastatin calcium in bulk and in house formulation. J Chromatogr Sep Tech 2014;5:1-7.
- Mukthinuthalapati MA, Bakkapatanam V, Bandaru SPK. Stability indicating liquid chromatographic method for the simultaneous determination of rosuvastatin and ezetimibe in pharmaceutical formulations. Adv Pharm Bull 2014;4:405-11.
- Savita MN, Promod HS, Chandrashekhar LB, Pramod LI. Development and validation of RP-HPLC method for the estimation of rosuvastatin calcium and niacin in combined tablet dosage form. Int. J Pharm Sci Rev Res 2015;4:44-50.
- Sagar GV, Parameswari SA, Chetty CM, Kumar AVS. Development and validation of RP-HPLC method for simultaneous determination of rosuvastatin calcium and clopidogrel in capsule dosage form. J Pharm Res 2012;5:4881-83.
- Devika GS, Sudhakar M, Venkateshwara RJ. A new improved RP-HPLC method for simultaneous estimation of rosuvastatin calcium and fenofibrate in tablets. Int J Pharm Pharm Sci 2011;3:311-15.
- Trivedi HK, Patel MC. Development and validation of a stability-indicating RP-UPLC method for determination of rosuvastatin and related substances in pharmaceutical dosage form. Sci Pharm 2012;80:393-06.
- Reddy GVR, Reddy BV, Haque SW, Gautam HD, Kumar P. Development and validation of a stability-indicating UPLC method for rosuvastatin and its related impurities in pharmaceutical dosage forms. Quim Nova 2011;34:250-55.
- Silva TA, Zaninb H, Vicentinia FC, Coratc EJ, Orlando FF. Electrochemical determination of rosuvastatin calcium in pharmaceutical and human body fluid samples using a composite of vertically aligned carbon nanotubes and grapheme oxide as the electrode material. Sens Actuators B Chem 2015;218:51-59.
- Purkar AJ, Balap AR, Sathiyanarayanan L, Mahadik KR. Development and validation of HPTLC method for simultaneous determination of rosuvastatin calcium and aspirin in its pure and pharmaceutical dosage form. Int J Pharm Pharm Sci 2014;6:704-06.
- Sane R, Kamat S, Menon S, Inamdar S, Mote M. Determination of rosuvastatin calcium in its bulk drug and pharmaceutical preperations by High-Performace Thin-Layer Chromatography. JPC-J Planer Chromat 2005;18:194-98.
- Suslu I, Celebier M, Altinoz S. Determination of rosuvastatin in pharmaceutical formulations by capillary zone electrophoresis. Chromatographia 2007;66:65-72.
- Altinoz S, Uyara B. Electrochemical behaviour and voltametric determination of rosuvastatin calcium in pharmaceutical preparations using a square-wave voltametric method. Anal Methods 2013;5:5709-16.
- Alzoman NZ, Sultan MA, Maher HM, Alshehri MM, Wani TA, Darwish IA. Analytical study for the charge-transfer complexes of rosuvastatin calcium with π-acceptors. Molecules 2013;19:7711-25.
- Wani TA, Darwish IA, Khalil NY. Novel microwell-based spectrophotometric assay for the determination of rosuvastatin calcium in its pharmaceutical formulations. Curr Pharm Anal 2013;9:54-60.
- Rodionova OY, Houmøller LP, Pomerantsev AL, Geladi P, Burger J, Dorofeyev VL, Arzamastsev AP. NIR spectrometry for counterfeit drug detection: A feasibility study. Anal Chim Acta 2005;549:151-58.
- Blanco M, Valdes D, Bayod MS, Fernandez-Mari F, Llorente I. Characterization and analysis of polymorphs by near-infrared spectrometry. Anal Chim Acta 2004;502:221-27.
- Kondepati VR, Keese, H. Michael Heise HM, Backhaus J. Detection of structural disorders in pancreatic tumour DNA with Fourier-transform infrared spectroscopy. Vib Spectrosc 2006;40:33-39.
- Anzanello MJ, Fogliatto FS, Ortiz RS, Limberger R, Mariotti K. Selecting relevant Fourier transform infrared spectroscopy wavenumbers for clustering authentic and counterfeit drug samples. SCI Justice 2014;54:363-68.
- Ortiz RS, Mariotti KDC, Fank B, Limberger RP, Anzanello MJ, Mayorga P. Counterfeit Cialis and Viagra fingerprinting by ATR-FTIR spectroscopy with chemometry: Can the same pharmaceutical powder mixture be used to falsify two medicines? Forensic Sci Int 2013;226:282-89.
- Hu Y, Erxleben A, Ryder AG, McArdle P. Quantitative analysis of sulfathiazole polymorphs in ternary mixtures by attenuated total reflectance infrared, near-infrared and Raman spectroscopy. J Pharm Biomed Anal 2010;53:412-20.
- Salari A, Young RE. Application of attenuated total reflectance –FTIR spectroscopy to the analysis of mixtures of pharmaceutical polymorphs. Int J Pharm 1998;163:157-66.
- Kumar SA, Tang CF, Chen SM. Electroanalytical determination of acetaminophen using nano-TiO2/polymer coated electrode in the presence of dopamine. Talanta 2008;76:997-1005.
- Sherazi STH, Ali M, Mahesar SA. Application of Fourier-transform infrared (FT-IR) transmission spectroscopy for the estimation of roxithromycin in pharmaceutical formulations. Vib Spectrosc 2011;55:115-18.
- ICH Guidance on Analytical Method Validation, in: Proceedings of the International Convention on Quality for the Pharmaceutical Industry, Toronto, Canada, and September, 2002.
