- Corresponding Author:
- S. N. Umathe
Department of Pharmaceutical Sciences, Rashtrasant Tukadoji Maharaj Nagpur University, Mahatma Jyotiba Fuley Shaikshanik Parisar, Amravati Road, Nagpur?440 033, India
E-mail: umathesn@hotmail.com
| Date of Submission | 19 May 2006 |
| Date of Revision | 25 January 2008 |
| Date of Acceptance | 20 March 2008 |
| Indian J. Pharm Sci. 2008, 70 (2): 198-202 |
Abstract
A simple reverse phase high-performance liquid chromatographic method has been developed for determining the concentration of metformin in rat plasma. The method employs C18 column (300 mm × 2.4 mm i.d.), ammonium acetate (0.15 M) and acetonitrile (90:10; pH-5.5; 1.0 ml/min) as mobile phase and ultraviolet detection at 236 nm. Acetonitrile was used to simultaneously deproteinize rat plasma and extract metformin. The assay was linear in the concentration range of 0.33 μg-16.6 μg/ml with co-efficient of correlation 0.994. The retention time was 4.7 min. The method was found to be precise (% CV < 15%), accurate and suitable for pharmacokinetic study of orally administered metformin in rats.
Keywords
Acetonitrile, pharmacokinetics, diabetes, metformin
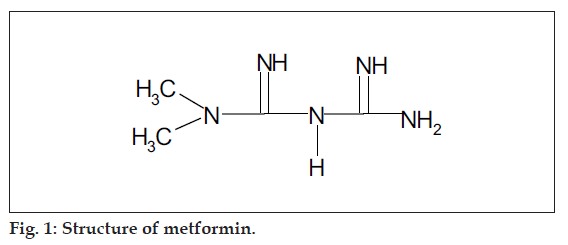
Metformin is a widely used oral antidiabetic agent and chemically it is 1,1-dimethyl biguanide (fig. 1) [1]. As its hypoglycemic effect depends upon its blood level, attempts have been made earlier to develop a precise method to estimate its concentration in biological matrix. These methods mostly employ ultraviolet or mass spectrometric detectors coupled to high-performance liquid chromatography (HPLC) using silica, cyano, cation-exchange and C18 columns [2-10]. As metformin is a highly polar compound, previous investigators either used ion-pair solid phase extraction method or acidified the plasma before its extraction by an organic solvent or used capillary electrophoresis technique for its chromatographic separation11,12. Most of these reported methods are precise and accurate, however employ such specific columns or techniques which are not normally available in common laboratories. In view of this, a simple reverse phase HPLC method has been developed and validated as per USFDA guidelines [13] to accurately and precisely estimate metformin in rat plasma using commonly available C18 column, ultraviolet detector, and acetonitrile for fundamental processes such as deproteinization of plasma and extraction of metformin.
Materials and Methods
Metformin was a generous gift by Zim Laboratories Ltd., Nagpur, India. Acetonitrile (HPLC grade) and ammonium acetate (AR grade), were purchased from Ranbaxy Chemicals, India (Rankem). Freshly double distilled, deionised water filtered through 0.45 µ nylon (47 mm, Pall Life Sciences, Mumbai, India) filter in Millipore unit (USA) was used throughout the experiments. Standard solution of metformin (1 mg/ ml) was prepared in mobile phase and kept at 4-8º. Fresh stock solutions were prepared every week. The serial dilutions of stock solution were made to obtain working standard solutions of 0.5, 1.0, 2.0, 5.0, 10.0, 15.0, 20.0, 50.0 µg/ml strength. These solutions were freshly prepared every week and stored at 4-8°.
Deproteinization of plasma and analyte extraction
Sprague-Dawley rats (220-250 g) of either sex housed under the controlled conditions of temperature and humidity (25±2°, 55±2%) with dark/light (12/12 h) cycle and received a standard pelleted diet (Goldmohar brand, Lipton India Ltd.) and water ad libitum. The Institutional Animal Ethics Committee (IAEC) approved the use of animals. Whenever required, blood (1.0 ml) was withdrawn by micro-capillary technique from retro-orbital plexus [14] under light ether anesthesia. It was collected in heparinized eppendorf tubes and centrifuged at 3000 × g to separate plasma. In order to deproteinize plasma, and subsequently extract metformin acetonitrile (1.0 ml) was added to plasma (0.5 ml) and the mixture was vortex-mixed for 30 s. After standing for 10 min, the mixture was centrifuged at 5000 × g for 10 min. The upper layer (about 100 µl) was separated and filtered through nylon membrane filters (0.22 µ, 13 mm). About 20 µl of filtrate was used for estimating metformin by HPLC method.
Chromatography
The chromatographic study was carried out using Shimadzu 10AT/Vp HPLC system, having in-built degasser unit (DGU 14A), mixer unit (FCV 10AL) attached to solvent delivery module with low-pressure gradient pump (LC 10AT), Rheodyne injector port (2E, 7725i, 20µl loop) and UV/Vis detector (SPD 10A). The mobile phase was prepared by mixing 0.15 M ammonium acetate (pH 5.5) and acetonitrile in the ratio of 90:10; it was filtered through 0.45 µ membrane filter. The elution was carried out on C18 column (300 mm × 2.4 mm, Microbondapack) at a rate of 1 ml/min. Detection of metformin was carried out at 236 nm at ambient temperature. The data were interpreted using CSW (chromatographic work station) data acquisition software.
Linearity and limit of quantitation
Calibration curve was established by spiking rat plasma (500 µl) with known amount of metformin to obtain 0.33, 1.66, 3.33, 5.0, 6.66, 16.60 µg/ml. The lowest concentration of the analyte that gives at least 5 times the response as compared with blank was considered as the limit of quantitation (LOQ). Quantitation of metformin in rat plasma was done by reading the analyte response against the calibration curve.
Accuracy and precision
In order to determine the intra-day and inter-day accuracy and precision, the concentration of metformin present in five replicates of plasma spiked with 3.33, 5.00, 6.66 µg/ml metformin was estimated by HPLC within a day or on three consecutive days. 85-115% accuracy and coefficient of variation values <15% except at LLOQ (accuracy 80-120% and CV =20%) were considered acceptable.
Recovery
Recovery of metformin from plasma was estimated at 3.33, 5.00, 6.66 µg/ml concentrations by comparing peak area of spiked plasma standards with those of corresponding plain standards containing the corresponding concentration in mobile phase that represent 100% recovery.
Stability
Analyte stability in plasma was tested at 3.33, 5.00, 6.66 µg/ml concentrations in replicates of three for one freeze-thaw cycle, long term (30 days), and short term (24 h) stabilities. Initially, a plasma standard containing above concentrations were prepared and divided into four fractions. One fraction was analyzed immediately and its area was noted. The other three fractions were stored, two at -20°, and remaining at room temperature. The sample kept at room temperature was analyzed after 24 h. One of the samples kept at -20° was analyzed after one freeze-thaw cycle and the other was analyzed after one month storage. The peak area at the end of the study was compared with that of the standard and stability was calculated.
Pharmacokinetic study
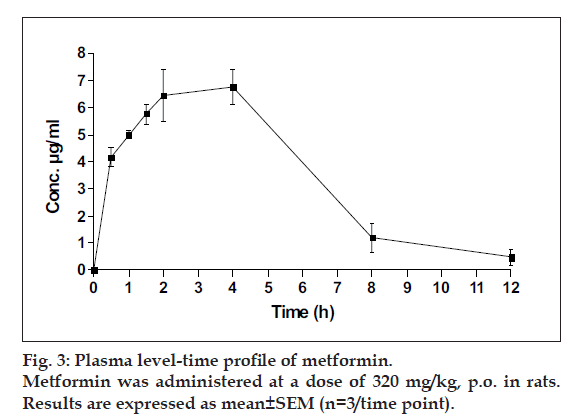
For studying the pharmacokinetics of metformin by using the above developed method, metformin (320 mg/kg) was administered orally15 and the blood was withdrawn at 0.5, 1, 1.5, 2, 4, 8, 12 h time intervals. The study was carried out by sparse sampling design using 3 rats for each time point. Plasma obtained from each rat was stored at -20° until analyzed.
Results and Discussion
In the present method, acetonitrile was used to deproteinize plasma and simultaneously extract metformin. The recovery studies (Table 1) indicates that this solvent was effective to extract metformin from the spiked plasma. In the earlier attempts the investigators deproteinized the plasma by adding acid and subsequently extracted the analyte by using acetonitrile [6]. In fact, acetonitrile is a polar solvent and the present studies indicated that it has effectively deproteinized the plasma and hence, there is no necessity of separately using acid for this purpose. Since acetonitrile could also extract metformin, the present method appears comparatively simple for plasma preparation process.
| Known | Concentration found | Accuracy | Precision |
|---|---|---|---|
| concentration | (Mean ± S.D.; | (%) | (% CV) |
| (µg/ml) | µg/ml) | ||
| Intra-day (n = 5) | |||
| 3.33 | 2.83±0.11 | 85.00 | 4.58 |
| 5.00 | 4.99±0.54 | 99.80 | 2.99 |
| 6.66 | 6.62±0.65 | 99.40 | 4.20 |
| Inter-day (n =15) | |||
| 3.33 | 3.32 ±0.09 | 99.88 | 6.89 |
| 5.00 | 5.35±0.11 | 107.08 | 3.33 |
| 6.66 | 7.23±0.103 | 108.61 | 3.50 |
Each value is mean of 5 replicates; SD - Standard deviation; CV - Coefficient of variation
Table 1: Accuracy and Precision of the Method for Estimating Metformin Concentration in Plasma
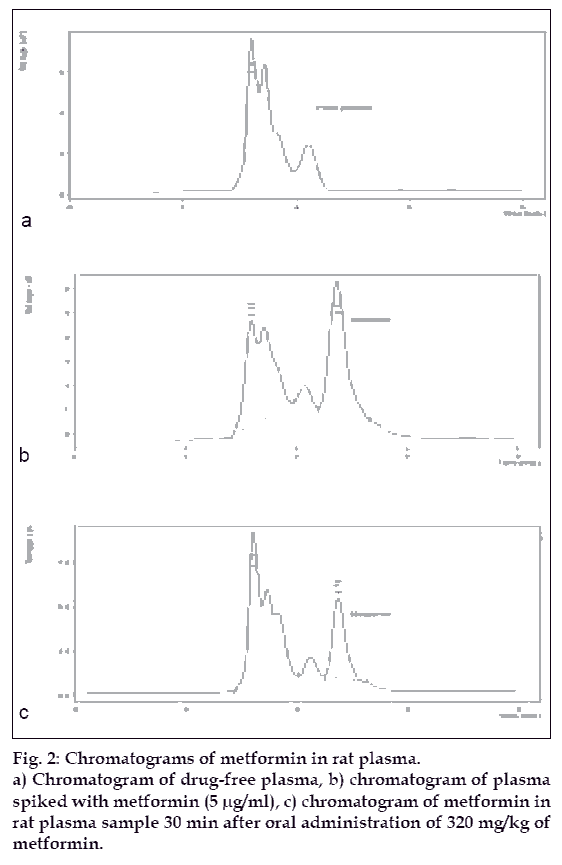
When metformin extracted by acetonitrile from plasma was injected onto C18 column using 0.15 M ammonium acetate (pH 5.5) and acetonitrile in the ratio of 90:10 as mobile phase, hled to a distinct curve for metformin at 4.7 min with good linearity indicating the preciseness and accuracy of the developed method. Most of the methods used potassium dihydrogen phosphate and acetonitrile in the mobile phase and used cyano or C8 column. However, our preliminary attempts revealed that use of ammonium acetate instead of potassium hydrogen phosphate in the mobile phase gives better resolution of metformin. This may be because metformin is a biguanide and possess amino groups and hence amino group possessing component in the mobile phase may be responsible for giving better resolution.
It was further noted that concentration of acetonitrile in mobile phase played a major role in the resolution of peak. At 10% concentration, the peak for metformin was optimally resolved with asymmetry of 0.9-1.4 and theoretical plates 18000-22000 tp/m. At higher concentration (>20%), the peak was broad whereas at lower concentration (<10%), there was a tailing of peak which could be reduced by changing the pH of ammonium acetate buffer to 2.5. However, such acidic pH is not suitable for the life of the column. Therefore, 10% acetonitrile in the mobile phase was found more appropriate. In another experiment, methanol was used instead of acetonitrile for plasma preparation as well as in mobile phase. However, the ultimate peak height for metformin was very small and hence methanol was considered unsuitable.
For validation purpose, a concentration range of 0.33 µg/ml to 16.60 µg/ml was selected, as the plasmalevel of 6-12 µg/ml of metformin was expected after an oral dose of 320 mg/kg to rats. A standard calibration curve was constructed by using linear regression analysis and it was found to be linear over the employed concentration range. The lower limit of quantitation was found to be 0.33 µg/ml at which percent co-efficient of variation of five replicates was 6.2. The linear regression equation was y = 22.46x?7.15 (r2 = 0.994). The inter-day and intra-day estimations of metformin revealed the reproducibility of the results irrespective of time and day. The calculated values of accuracy and precision (Table 1), recovery (Table 2) and stability (Table 3) of the method were well in accordance with the USFDA guideline for bioanalytical method validation [13].
| Concentration of metformin | Absolute Recovery % | % CV |
|---|---|---|
| (µg/ml) (n=5) | (Mean ± SD) | |
| 3.33 | 99.1±5.3 | 5.3 |
| 5.00 | 106.1±3.6 | 3.4 |
| 6.66 | 94.33±3.1 | 3.2 |
Table 2: Absolute Recovery of Metformin from the Plasma Samples
The plasma level-time study of metformin in rats indicated highest metformin concentration in plasma to be 7.2±0.09 µg/ml (Cmax) at 2.5±0.115 h (Tmax) and AUC as 46.52±0.21 µg.h.ml-1 (fig. 3). Secondary pharmacokinetic parameters calculated are shown in Table 4.
| Parameters | Mean±SD (n=3) | ||
|---|---|---|---|
| Tmax | (h) | 2.50±0.12 | |
| Cmax | (µg/ml) | 7.20±0.09 | |
| AUC | 0-8 | (µg.h.ml-1) | 46.52±0.21 |
| Ka (h-1) | 0.30±0.057 | ||
| T1/2 (h) | 2.30±0.06 | ||
Table 4: Pharmacokinetic Parameters of Metformin in Male Rats
| Stability (n=3) | Concentration (mean±SD; µg/ml) | ||||
|---|---|---|---|---|---|
| 3.33 | 5.00 | 6.66 | |||
| Freeze-thaw stability | |||||
| Initial | 3.41±0.2 | 5.10±0.3 | 6.81±0.2 | ||
| Final | 3.28±0.3 | 5.00±0.4 | 6.52±0.1 | ||
| Deviation (%) | -3.80 | -1.96 | -4.41 | ||
| Short-term stability | |||||
| Initial | 3.41±0.2 | 5.10±0.3 | 6.81±0.2 | ||
| Final | 3.32±0.1 | 4.89±0.4 | 6.78±0.4 | ||
| Deviation (%) | -2.63 | -4.11 | -0.44 | ||
| Long term stability | |||||
| Initial | 3.41±0.2 | 5.10±0.3 | 6.81±0.2 | ||
| Final | 3.12±0.4 | 5.52±0.4 | 7.02±0.2 | ||
| Deviation (%) | -8.50 | +8.25 | +3.08 | ||
Table 3: Stability of Metformin in Rat Plasma
Acknowledgements
The financial help from UGC [F.10-16/2002 (SA - II)] is gratefully acknowledged.
References
- Bailey CJ, Turner RC. Metformin. N Engl J Med 1996;334:574-9.
- Charles BG, Jacobsen NW, Ravenscroft PJ. Rapid liquid-chromatographic determination of metformin in plasma and urine. Clin Chem 1981;27:434-6.
- Yuen KH, Peh KK. Simple high-performance liquid chromatographic method for the determination of metformin in human plasma. J Chromatogr B Biomed Sci Appl 1998;710:243-6.
- AbuRuz S, Millership J, McElnay J. The development and validation of liquid chromatography method for the simultaneous determination of metformin and glipizide, gliclazide, glibenclamide or glimperide in plasma. J Chromatogr B Analyt Technol Biomed Life Sci 2005;187:277-86.
- AbuRuz S, Millership J, McElnay J. Determination of metformin in plasma using a new ion pair solid phase extraction technique and ion pair liquid chromatography. J Chromatogr B Anal Technol Biomed Life Sci 2003;798:203-9.
- Zhang M, Moore GA, Lever M, Gardiner SJ, Kirkpatrick CM, Begg EJ. Rapid and simple high-performance liquid chromatographic assay for the determination of metformin in human plasma and breast milk. J Chromatogr B Anal Technol Biomed Life Sci 2002;766:175-9.
- Vesterqvist O, Nabbie F, Swanson B. Determination of metformin in plasma by high-performance liquid chromatography after ultrafiltration. J Chromatogr B Biomed Sci Appl 1998;716:299-304.
- Cheng CL, Chou CH. Determination of metformin in human plasma by high-performance liquid chromatography with spectrophotometric detection. J Chromatogr B Biomed Sci Appl 2001;762:51-8.
- Marques MA, Soares AS, Pinto OW, Tupinamb P, Barroso W, Pinto DP, et al. Simple and rapid method determination for metformin in human plasma using high performance liquid chromatography tandem mass spectrometry: Application to pharmacokinetic studies. J Chromatogr B Anal Technol Biomed Life Sci 2007;852:308-16.
- Amini H, Ahmadiani A, Gazerani P. Determination of metformin in human plasma by high-performance liquid chromatography J Chromatogr B Analyt Technol Biomed Life Sci 2005;824:319-22.
- Song JZ, Chen HF, Tian SJ, Sun ZP. Determination of metformin in plasma by capillary electrophoresis using field-amplified sample stacking technique. J Chromatogr B Biomed Sci Appli 1998;708:277-83.
- Lai EP, Feng SY. Solid phase extraction Non-aqueous capillary electrophoresis for determination of metformin, phenformin and glyburide in human plasma. J Chromatogr B Analyt Technol Biomed Life Sci 2006;843:94-9.
- USFDA. Guidance for industry: Bioanalytical method validation. New York, 2001. Available from: http://www.fda.gov/cder/guidance/index. htm. [cited on 2007 Jan 12].
- Sorg DA, Buckner B. A simple method of obtaining venous blood from small laboratory animals. Proc Soc Exp Biol Med 1964;115:1131-2.
- Huupponen R, Ojala-Karlsson P, Rouru J, Koulu M. Determination of metformin in plasma by high-performance liquid chromatography. J Chromatogr 1992;583:270-3.


