- *Corresponding Author:
- M. Aghaeepoor
Gene Transfer Pioneers (GTP) Research Group, Shahid Beheshti University of Medical Sciences, Tehran, Iran
E-mail: aghaeepoor77@yahoo.com
| Date of Submission | 20 February 2017 |
| Date of Revision | 09 August 2017 |
| Date of Acceptance | 25 March 2018 |
| Indian J Pharm Sci 2018;80(3):470-479 |
This is an open access article distributed under the terms of the Creative Commons Attribution-NonCommercial-ShareAlike 3.0 License, which allows others to remix, tweak, and build upon the work non-commercially, as long as the author is credited and the new creations are licensed under the identical terms
Abstract
Recombinant human interferon alpha-2b is an FDA-approved drug for monotherapy or in combination therapy with other drugs for hepatitis and cancers. It belongs to a family of homologous proteins involved in antiviral, antiproliferative, and immunoregulatory processes. A different expression system has been used for overexpression of this protein. Escherichia coli expression system is a highly characterized host and various expression settings have been developed based on its properties. However, finding the best conditions for the overexpression of recombinant human interferon alpha-2b remains to be addressed. In this study, the expression of synthetic human interferon alpha-2b gene in E. coli was greatly improved by adjusting the expression condition. In this regard, a recombinant gene was designed and codon optimized for the periplasmic expression of this protein. Then, gene subcloning was employed to insert the synthesized gene into the pET22b expression vector. Thereafter, the response surface methodology method was employed to design 20 experiments to find out the optimum points for isopropyl β-D-1-thiogalactopyranoside concentration, post-induction period, and the cell density of induction (OD600). The expression fluctuations were assessed by using the real time polymerase chain reaction method. Our results indicated that the synthetic human interferon alpha-2b gene was successfully codon optimized and subcloned into the expression vector. The real time polymerase chain reaction results revealed that the optimum levels of the selected parameters are 0.27 mM for isopropyl β-D-1-thiogalactopyranoside concentration, 7.98 H for the post-induction period, and 3.93 for cell density (OD600). These optimized conditions led to a 3.5-fold increase in the rhIFNα2b expression, which is highly promising for large scale rhIFNα2b overexpression.
Keywords
Recombinant human interferon α-2b, response surface methodology, protein overexpression, codon optimization
Cancer is the first cause of death in developed countries and the second cause of death in the developing countries [1]. About 12.7 million cancer cases, with an approximate mortality rate of 7.6 million, occur worldwide. It is estimated that about 64 % of these deaths occur in the developing countries. The main cause of death in women and men are breast cancer (23 % of the total cancer cases and 14 % of the cancer deaths) and lung cancer (17 % of the total new cancer cases and 23 % of the total cancer deaths), respectively, followed by stomach, liver, cervix, prostate, and brain cancers [2]. Cancer is a disease caused by uncontrolled cell growth. Spreading of these cells to the surrounding tissues, via blood or lymphatic circulation, cause tissue damage [2].
There are various ways of treating cancer, including surgery, chemotherapy, radiotherapy, immunotherapy, gene therapy, or protein therapy. Recombinant therapeutic proteins that have been widely used in cancer are enzymes (Elspar, Oncaspar, and Elitek), toxins (denileukin diftitox or Ontak), monoclonal antibodies (Zevalin, Mylotarg, Bexxar, Herceptin, Avastin, Erbitux, Rituxan, Vectibix, and Campath), and cytokines (interleukin-2, interferon-αn3, interferon-β1 and interferon-α2b) [3].
Recombinant human interferon α-2b (rhIFNα2b) was first approved by the United States Food and Drug Administration in 1986 for the treatment of hairy cell leukaemia [4]. Currently, rhIFNα2b is applied as monotherapy or in combination therapy with other drugs for hepatitis and cancers. This protein belongs to a family of homologous proteins involved in antiviral, antiproliferative, and immunoregulatory processes. These glycoproteins have been classified into three major types, alpha (leucocytes), beta (fibroblasts), and gamma (immune), which are produced in response to stimulation by certain bacteria, viruses, antigens, and mitogens [5].
There are 13 human interferon alpha genes that are located on the short arms of chromosome 9. A total of 28 different sequence variants have been demonstrated among these genes; this diversity provides different immune responses [6]. The rhIFNα2b is one of the most studied rhIFN and its intronless sequence encodes for 165 amino acid protein. The DNA recombinant technology makes a large-scale production of interferon proteins possible for pharmaceutical applications. Different expression systems have been used for the overexpression of rhIFNα2b, including Escherichia coli [7], Saccharomyces cerevisiae [8], Streptomyces lividans [9], Bacillus subtilis [10], Pichia pastoris [11], Lactococcus lactis [12], Yarrowia lipolytica [13], plant nuclear genome [14], chloroplast [15], and mammalian cells [6,16]. Each of these host systems has some advantages as well as disadvantages. However, the maximum expression has been observed in E. coli (3 g/l). E. coli is the most widely used host cell for the production of the recombinant interferons [17]. Numerous studies have been conducted to optimize and increase the expression of interferons [18-21]. To this purpose, we designed this study to optimize the interferon expression in E. coli by using the surface response methodology and the result was confirmed using real-time polymerase chain reaction (PCR).
The rhIFNα2b is 495 bp long, comprising one openreading frame encoding a polypeptide of 165 amino acid residues successfully expressed in E. coli. In this study, the rhIFNα2b gene was synthesized by E. coli codon preference and we demonstrate that the production of rhIFNα2b in E. coli was greatly improved by adjusting the expression condition.
Materials and Methods
Bacteria were cultured in Luria and Bertani (LB) media (Merck, Germany) at 37° with shaking at 200 rpm. The restriction enzymes were purchased from Takara Company (Shiga, Japan). All chemicals used in the laboratory were analytical grade. The E. coli BL21 (DE3) pLysS (f-ompt hsdB, rB¯ mB¯, dcm gal, DE3, pLYsS cmr) was used for the transformation and final expression of the rhIFNα2b recombinant protein. The pET-21b (Novagen) plasmid, capable of preplasmic protein expression, was utilized for the overexpression of the recombinant protein.
Recombinant gene optimization and its cloning into expression plasmid
Since the codon preferences of E. coli and Homo sapiens are significantly different, the DNA coding sequence (495 bp) of rhIFNα2b from H. sapiens (GenBank accession no. AY255838.1) was used for codon optimization. The optimization was performed according to the codon preference of the E. coli genes by using the National Center for Biotechnology Information-related database at (http://www.kazusa. or.jp/codon). The signal sequence of the rhIFNα2b gene was replaced by the PelB signal sequence for preplasmic protein expression. The optimized rhIFNα2b gene with PelB as a signal sequence, flanked by NdeI and BamHI restriction sites, was synthesized by Shinegene Company (China) and cloned into the pUC57 plasmid constructing pUC-rhIFNα2b plasmid. Thereafter, the synthetic PelB-rhIFNα2b was inserted into the pET-21b plasmid between the NdeI and BamHI restriction sites by using the digestion (by NdeI and BamHI restriction enzymes) and ligation (by T4 DNA ligase) reactions. The ligated products were transformed into the E. coli BL21 (DE3) plysS competent cells by the CaCl2 method. Screening for the successful transformation and cloning was done on LB+100 mg/ml ampicillin and the accuracy of the cloning was confirmed by colony-PCR and sequencing (using T7 universal primers).
Protein expression
A single colony of confirmed E. coli BL21 (DE3) harbouring recombinant plasmid was inoculated in 25 ml of LB medium culture at 37° with shaking at 200 rpm overnight and supplemented with 100 mg/ml of ampicillin. To induce the rhIFNα2b expression, 0.5 mM (IPTG) was used when the cell density reached OD600= 0.8 in the shake flask experiments. The expression was continued for 15 h.
Analysis of the primary expression product
The cells in the culture were harvested by centrifugation at 4500 g for 10 min at 4°. The accumulated protein within the periplasmic was released by exposing the cell pellet with an equal volume of STE buffer (1 mg lysozyme/ml; 20 % w/v sucrose; 30 mM Tris/HCl, pH 8.1; 1 mM ethylenediaminetetraacetic acid, EDTA) on ice for 10 min. Then, applied for centrifugation for about 10 min at 12 000 g to separate the cell debris [22].
The recombinant rhIFNα2b protein was expressed as insoluble inclusion bodies, thus, a renaturation process was needed to achieve the active form of the recombinant enzyme. First, the inclusion pellets were solubilized in 8 M urea buffer at pH= 8. The mixture was incubated at 25° for 1 h before the insoluble parts were removed by centrifugation. The solution was then diluted with phosphate buffer (pH= 10.7) for rhIFNα2b renaturation. The solution was subjected to dialysis against the dialysis buffer (20 mM Tris/HCl pH 8.0, 50 mM NaCl, 1 mM EDTA) at 4° overnight.
Sodium dodecyl sulphate polyacrylamide gel electrophoresis (SDS-PAGE; 15 %) was employed to analyse the expressed recombinant rhIFNα2b protein. The Coomassie blue staining method helped visualize the protein band of the expressed recombinant rhIFNα2b. The amount of total protein was determined by the Bradford method, using bovine serum albumin (BSA) as a standard.
Response surface methodology (RSM) for overexpression of recombinant rhIFNα2b
The optimization of the recombinant rhIFNα2b expression level in E. coli host was carried out by a central composite design (CCD) and with the RSM. Three significant cultivation conditions including IPTG concentration, post-induction period, and cell density of induction (OD600) were subjected to optimization experiments designed by the Minitab 16 software (Minitab Inc., USA). Twenty experiments containing six replicated centre points were designed and carried out. The analyses of the experimental data were performed statistically by the regression method: Y = β0+Σβi xi+Σβiixii 2+Σβijxi xj+ε, where Y is the predicted rhIFNα2b mRNA percent, β0 is a constant coefficient, βi is the linear coefficient, βii is the quadratic coefficient, and βij is the cross-product coefficient. Xi and Xj are input independent variable levels, while ε is the residual error. The design expert software (version 7.0.0) was employed for data analysis of experimental design and surface response methodology.
The transcriptional level of recombinant rhIFNα2b was measured by real-time PCR method in different conditions. The RNA was extracted by using TRIzol, according to the manufacturer’s instructions, while the cDNA was synthesized by using universal 16s primers. The recombinant E. coli host cells, transformed with pEt21b-PelB-rhIFNα2b vector without induction, were used as the negative control.
Quantitative analyses of rhIFNα2b expression by real-time PCR and ΔΔCt method
Total RNA from E. coli BL 21 cells, containing the recombinant rhIFNα2b, were isolated by using the TRIzol reagent (Life Technologies, USA) following the standard protocol instructed by the manufacturer. The extracted RNA was quantified by measuring absorbance at 260/280 nm by a NanoDrop device and the quality of the RNA was checked by gel electrophoresis. The cDNA synthesis was done with a Thermo Scientific cDNA synthesis kit. Reverse transcription was followed using 50 mg total RNA (maximally in 20 μl) and 1 μl random hexamer primers. The volume of the assay mixture was adjusted to 12 μl with RNase-free water, and then the mixture was incubated for 5 min at 70°, followed by incubation for 10 min at room temperature to allow the primers to anneal with the RNA.
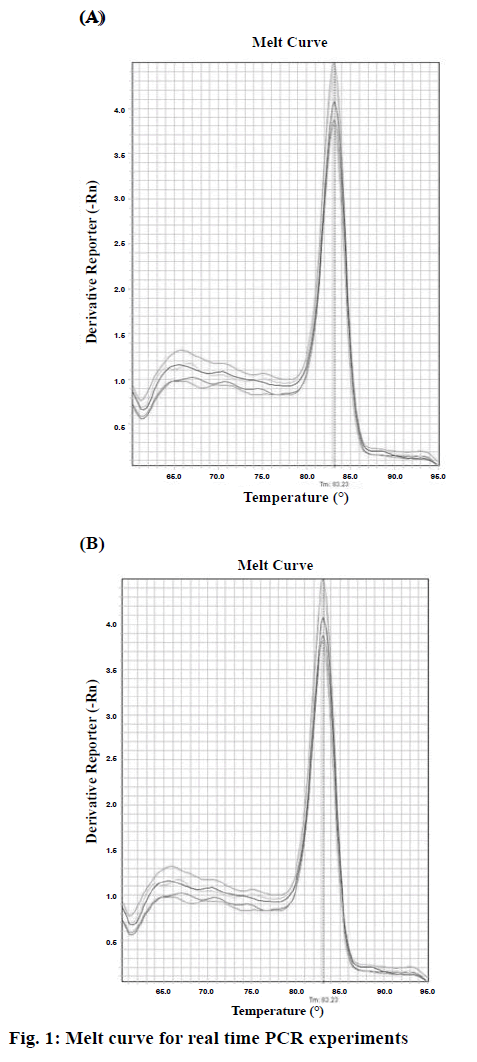
To analyse the rhIFNα2b expression level, real-time PCR was performed by using the Power SYBR® Green PCR Master Mix (life technology), according to manufacturer’s instructions (Applied Biosystems, USA). The kit has a Hot Start Taq DNA polymerase. All samples were analysed in duplicate and the average value is reported. For the determination of the mRNA level, 16S rRNA was used as the internal control gene. The primers used for this study were designed by using the web-based Oligo7 Primer analysis software. The primers for rhIFNα2b were: sense 5-CATAAACTGGAAAAAGCCGATCTG-3 and antisense 5-GACCGCTCAGCAGAAATTCTTG-3. The primers for 16S were: sense 5-CTACGGGAGGCAGCAGTGG-3 and antisense 5-TATTACCGCGGCTGCTGGC-3. The StepOne™ Real-time PCR systems (ABI) was used to detect the relative quantification. The amplification reactions were done under the following conditions: 10 min at 95°, followed by 45 cycles at 95° for 15 s, 60° for 1 min. The melting curve programme was set to 66-99° with a heating rate of 0.1°/s and a continuous fluorescence measurement. In order to identify the specificity of the amplification products, a dissociation curve was plotted (Figure 1). The 2-ΔΔCt method was used to analyse the relative changes in the level of gene expression.
Results and Discussion
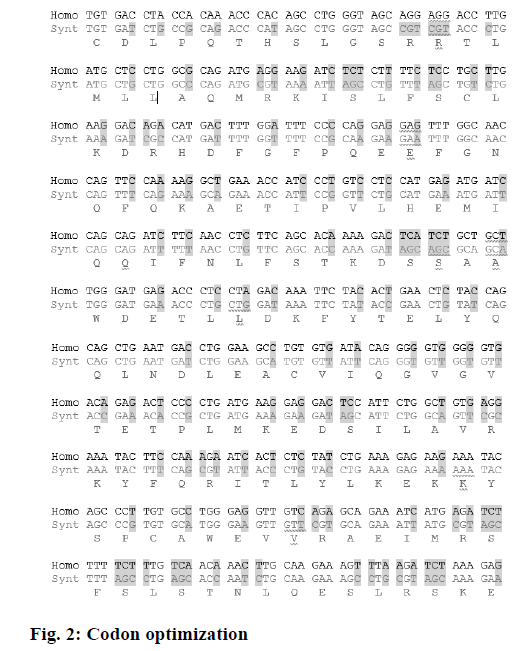
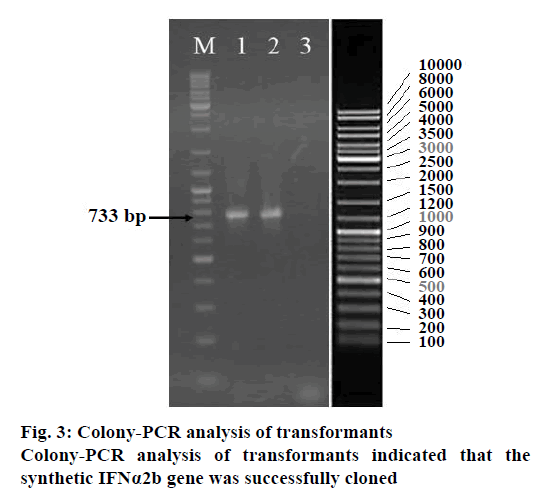
In order to have the highest expression levels of the recombinant protein, the coding sequence of the rhIFNα2b gene was optimized according to the codon preference of the E. coli host. The optimized gene and the wild type gene shared 74.5 % of identity. Although there were no cryptic splicing sites, the internal chi sites and ribosomal binding sites, the negative CpG islands, the repeat sequences, the restriction sites that may interfere with cloning, the RNA instability motif (ARE), and the mRNA secondary structure were detected to be optimized, A total of 128 nucleotides were changed, which led to 100 amino acid codon optimization (60.6 %) and deletion of 13 rare codons (Figure 2, Table 1). The optimized rhIFNα2b gene was subcloned into the pET21b plasmid to form the pET21brhIFNα2b plasmid. The results of the colony PCR (Figure 3) and gene sequencing indicated the accuracy of the subcloning process.
| Codon | E. coli Kazusa (%) |
Homo IFNα2b |
Syn. IFNα2b |
Codon | E. coli Kazusa (%) |
Homo IFNα2b |
Syn. IFNα2b |
|---|---|---|---|---|---|---|---|
| Ala (A) | Asn (N) | ||||||
| GCA | 27 | 1 | 7 | AAT | 59 | 1 | 2 |
| GCT | 22 | 4 | 0 | AAC | 41 | 3 | 2 |
| GCG | 25 | 1 | 0 | Pro (P) | |||
| GCC | 26 | 2 | 1 | CCA | 23 | 1 | 0 |
| Cys (C) | CCT | 24 | 2 | 0 | |||
| TGT | 52 | 3 | 4 | CCG | 37 | 0 | 5 |
| TGC | 48 | 1 | 0 | CCC | 16 | 2 | 0 |
| Asp (D) | Gln (Q) | ||||||
| GAT | 65 | 1 | 8 | CAA | 35 | 4 | 2 |
| GAC | 35 | 7 | 0 | CAG | 65 | 8 | 10 |
| Glu (E) | Arg (R) | ||||||
| GAA | 64 | 5 | 13 | AGA | 13 | 5 | 0 |
| GAG | 36 | 9 | 1 | AGG | 7 | 4 | 0 |
| Phe (F) | CGA | 9 | 0 | 0 | |||
| TTT | 64 | 4 | 8 | CGT | 30 | 0 | 7 |
| TTC | 36 | 6 | 2 | CGG | 15 | 0 | 0 |
| Gly (G) | CGC | 26 | 0 | 2 | |||
| GGA | 19 | 1 | 0 | Ser (S) | |||
| GGT | 34 | 1 | 4 | AGT | 19 | 1 | 0 |
| GGG | 18 | 2 | 0 | AGC | 21 | 4 | 14 |
| GGC | 29 | 1 | 1 | TCA | 18 | 2 | 0 |
| His (H) | TCT | 18 | 5 | 0 | |||
| CAT | 63 | 2 | 3 | TCG | 10 | 0 | 0 |
| CAC | 37 | 1 | 0 | TCC | 14 | 2 | 0 |
| Ile (I) | Thr (T) | ||||||
| ATA | 21 | 1 | 0 | ACA | 25 | 3 | 1 |
| ATT | 48 | 1 | 8 | ACT | 22 | 3 | 0 |
| ATC | 31 | 6 | 0 | ACG | 22 | 0 | 0 |
| Lys (K) | ACC | 31 | 4 | 9 | |||
| AAA | 71 | 6 | 11 | Val (V) | |||
| AAG | 29 | 5 | 0 | GTA | 19 | 0 | 0 |
| Leu (L) | GTT | 33 | 1 | 7 | |||
| TTA | 18 | 1 | 0 | GTG | 29 | 4 | 0 |
| TTG | 13 | 4 | 0 | GTC | 19 | 2 | 0 |
| CTA | 6 | 2 | 0 | Tyr (Y) | |||
| CTT | 15 | 1 | 0 | TAT | 65 | 1 | 2 |
| CTG | 38 | 7 | 21 | TAC | 35 | 4 | 3 |
| CTC | 10 | 6 | 0 | Met (M) | |||
| Try (W) | ATG | 100 | 5 | 5 | |||
| TGG | 100 | 2 | 2 | GC% | 47.3 | 47.88 | 45.86 |
Codons with low frequency (10 %) are highlighted in yellow (light) and the most preferred codon for each amino acid is highlighted in gray (dark). The native IFNα2b gene from human has lower preferred codons with high frequency than optimized gene. For gene optimization, rare codons were omitted completely
Table 1: Codon optimization
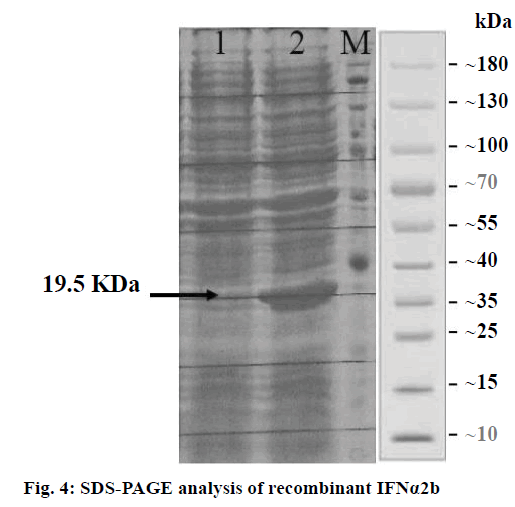
The protein expression results indicated that the rhIFNα2b gene was successfully expressed under the induction of IPTG. The SDS analysis showed an apparent expressed protein band at the desired range of molecular weight (19.2 KDa; Figure 4). This result further justified the accuracy of the previous gene optimization and subcloning. Primary expression level analysis by real-time PCR showed 17 % increase of rhIFNα2b mRNA to the calibrator.
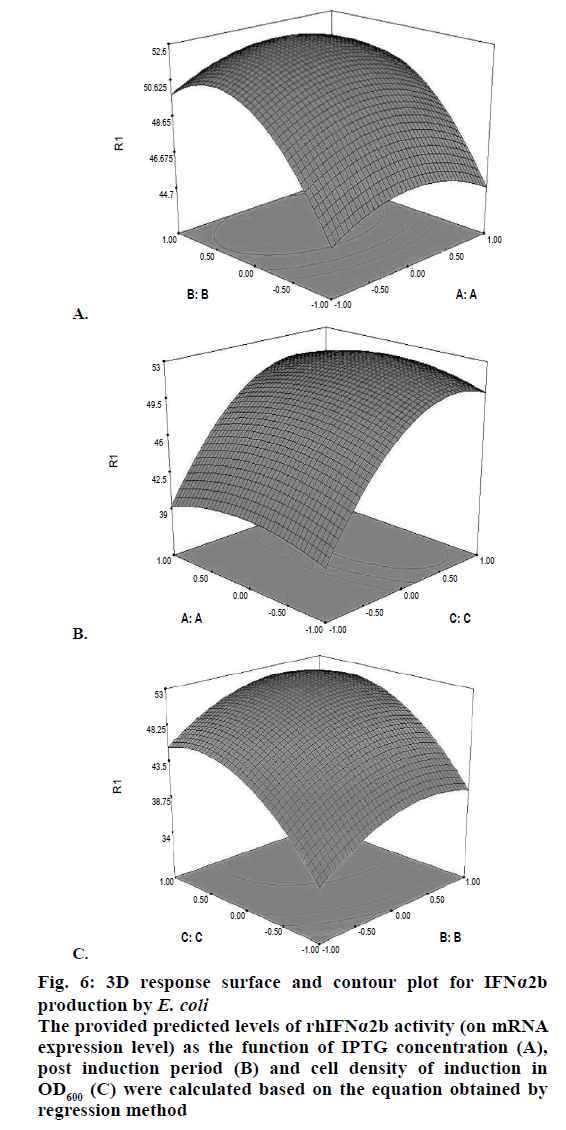
Since the primary protein expression results indicated the basic ability of the designed gene to produce recombinant rhIFNα2b, the optimum levels of significant cultivation conditions including IPTG concentration, post-induction period, and cell density of induction (OD600) were to be achieved as the next step. In this regard, the experimental range of each three variables was produced in five levels (−α, −1, 0, +1, +α; Table 2). Thereafter, 20 experiments including six replications of the central points were designed to optimize the selected parameters (Table 3). Moreover, this table provided additional information like the assessed (by real time method) percent of the expressed rhIFNα2b mRNA under the actual column and the predicted amounts of rhIFNα2b mRNA under the predicted column. The provided predicted levels of rhIFNα2b activity (on mRNA expression level) as the function of the IPTG concentration (A), post induction period (B), and cell density (C) were calculated based on the equation obtained by the regression method: Y (interferon alpha 2b U/ml) = 50.4394–(0.0482869*A1)+(2.57942*B1)+ (5.42418*C1)–(1.5209*A1*A1)–(3.14141*B1*B1)– (4.61246*C1*C1)+(0*A1*B1)+(0*A1*C1)-(0*B1*C1).
| Variable levels | Component | Level | ||||
|---|---|---|---|---|---|---|
| -α | -1 | 0 | +1 | +α | ||
| A | IPTG concentration (mM) | 0.065 | 0.15 | 0.275 | 0.4 | 0.485 |
| B | Post induction period (Hrs) | 0.62 | 3 | 6.5 | 10 | 12.38 |
| C | Cell density (OD600) | 0.312 | 1.4 | 3 | 4.6 | 5.688 |
Table 2: Experimental range of variables and coded values of three variables used in central composite design.
| Run No. | Factor A | Factor B | Factor C | Variations of interferon mRNA (%) | |
|---|---|---|---|---|---|
| IPTG concentration | Post-induction period | Cell density | Actual | Predicted | |
| 1 | -1 | -1 | -1 | 32.4 | 33.20 |
| 2 | 1 | -1 | -1 | 31.6 | 33.11 |
| 3 | -1 | 1 | -1 | 36.9 | 38.36 |
| 4 | 1 | 1 | -1 | 36.1 | 38.27 |
| 5 | -1 | -1 | 1 | 45.3 | 44.05 |
| 6 | 1 | -1 | 1 | 44.5 | 43.96 |
| 7 | -1 | 1 | 1 | 49.8 | 49.21 |
| 8 | 1 | 1 | 1 | 49.0 | 49.11 |
| 9 | -1.68 | 0 | 0 | 46.1 | 46.21 |
| 10 | 1.68 | 0 | 0 | 47.6 | 46.05 |
| 11 | 0 | -1.68 | 0 | 37.1 | 37.21 |
| 12 | 0 | 1.68 | 0 | 47.3 | 45.89 |
| 13 | 0 | 0 | -1.68 | 31.3 | 28.27 |
| 14 | 0 | 0 | 1.68 | 44.8 | 46.51 |
| 15 | 0 | 0 | 0 | 50.9 | 50.43 |
| 16 | 0 | 0 | 0 | 52.0 | 50.43 |
| 17 | 0 | 0 | 0 | 49.2 | 50.43 |
| 18 | 0 | 0 | 0 | 49.4 | 50.43 |
| 19 | 0 | 0 | 0 | 50.2 | 50.43 |
| 20 | 0 | 0 | 0 | 50.8 | 50.43 |
Table 3: CCD with measured and predicted response with transcription level of IFNα2b as a response
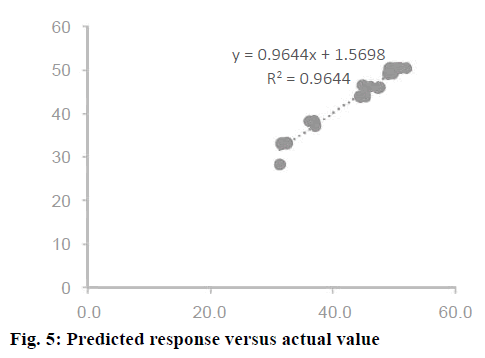
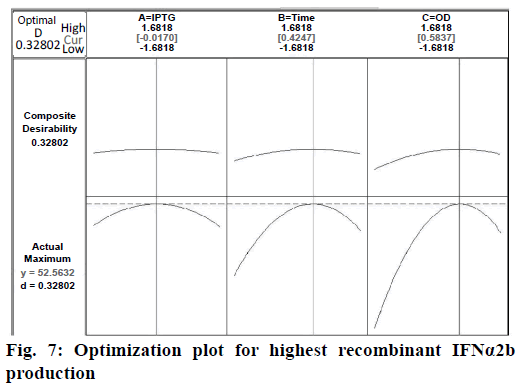
Confirmation of the statistical significance of the above equation was obtained using the F-test and the analysis of variance for response surface quadratic model. Table 4 contained the data pertaining to this analysis. Given a model F value of 30.11 and a very low probability value (Prob>F)<0.0001 confirmed the significance of the model, while there was only a 0.01 % chance that the model F value could occur as a consequence of the noise. The model terms are considered to be significant due to its p-value of Prob>F less than 0.0001. If there were many insignificant model terms (not counting those required to support the hierarchy), model reduction might improve the model. In this case B, C, A2, B2, and C2 were the significant model terms. The R2 coefficient was determined to check the fit of the model. The R2 value was calculated to be 0.9644, therefore, these results revealed that the regression model for rhIFNα2b overexpression fit the experimental values (Figure 5). The closer the R2 values to 1, the stronger the model and the better prediction of the response. The actual values are the results obtained for a specific run and the predicted values are obtained from the independent variables in the CCD model. The effect of each factor on the mRNA expression level of rhIFNα2b and their optimum amounts were depicted by 3D surface plots (Figure 6). The optimum levels of the selected parameters were determined to be 0.27 mM for the IPTG concentration, 7.98 H for the post-induction period, and 3.93 for cell density (OD600). The predicted maximum rhIFNα2b activity (on the mRNA expression level) was 52.56 %, which was close to the 54.27 % rhIFNα2b activity (on the mRNA expression level) obtained during the experiments (Figure 7).
| Source | Sum of square | F value | Prob>F |
|---|---|---|---|
| Model | 913.99 | 101.55 | 0.0001 |
| A-IPTG mM | 0.032 | 0.032 | 0.9245 |
| B-expression time (h) | 90.864 | 90.86 | 0.0004 |
| C-cell density (OD600) | 401.81 | 401.81 | 0.0001 |
| AB | 0.000 | 0.000 | 1.0000 |
| AC | 0.000 | 0.000 | 1.0000 |
| BC | 0.000 | 0.000 | 1.0000 |
| A2 | 33.34 | 33.34 | 0.0104 |
| B2 | 142.22 | 142.22 | 0.0001 |
| C2 | 306.60 | 306.60 | 0.0001 |
Table 4: Analysis of variance (ANOVA) for response surface quadratic model for the IFNα2b production
Figure 6: 3D response surface and contour plot for IFNα2b
production by E. coli
The provided predicted levels of rhIFNα2b activity (on mRNA
expression level) as the function of IPTG concentration (A),
post induction period (B) and cell density of induction in
OD600 (C) were calculated based on the equation obtained by
regression method
In the present study, RSM was employed to achieve the optimum rhIFNα2b production condition by simultaneous changing of the IPTG concentration, post-induction period, and cell density of induction (OD600). Optimizing these parameters is of great significance for having a sustainable source of industrial rhIFNα2b production. Due to its extensive prescription in various clinical conditions, rhIFNα2b is under the spotlight for industrial recombinant production. The recombinant expression of a gene within a host cell could bring about a metabolic burden, which could reduce the specific growth rate and biomass content as well as plasmid instability [23]. Moreover, the upper limit of the specific growth rate was determined by two detrimental factors for recombinant protein production including the onset of glucose overflow metabolism and acetate formation [24-26]. These facts accentuated the necessity of the recombinant expression optimization for rhIFNα2b.
To have a gene with its full capacity of heterologous recombinant expression requires careful codon optimization. The varying codon preference between different species should be dealt with properly. Decreased mRNA stability and translation rate would be the consequences of the remaining rare codons, while high G+C contents could result in reduced translational yields or even failed expression [27]. A successful codon optimization in which the existing rare codons are replaced with a set of more favourable host codons throughout the whole gene would lead to a twofold or threefold enhancement of the recombinant protein expression [27-29]. An efficient codon optimization process could simultaneously solve the problematic sequences of the gene other than the rare codons like the cryptic splicing sites, the internal chi sites and ribosomal binding sites, the negative CpG islands, the repeat sequences, the restriction sites that may interfere with cloning, ARE, and the mRNA secondary structure (which affects the translation efficiency) [30]. Chemical synthesis of the recombinant gene is deemed to be the most logical method to obtain a codon-optimized gene. The chemical synthesis of the rhIFNα2b gene provided us with the opportunity to introduce additional elements to the gene, like the pelB signal peptide. This sequence would guide the protein into the preplasmic space, which is associated with several advantages. A separation from other impurities residing in the cytoplasmic space, providing an oxidizing medium for the formation of disulphide bonds, and assisting the recombinant protein to keep its activity and biological structure are among the compelling features of preplasmic expression [31].
The IPTG concentration, post-induction period, and cell density were reported to be among the most important production conditions for the high yield of recombinant protein expression [32]. The conventional optimization approach is to vary one parameter at a time while keeping the others constant. However, this approach is not practical for dealing with numerous parameters due to a large number of experiments, which are needed for expression optimization. It’s a cumbersome method to perform numerous experiments in search of the optimum expression points. Moreover, the interaction between different variables could be neglected while employing this approach, which, in turn, could result in a misinterpretation of the results [33]. The aforementioned snags could be circumvented by using the RSM method as a commonly used alternative for the parallel optimization of several parameters. The RSM uses a unit of mathematical and statistical tools to design the minimum number of optimization experiments, builds models, and studies the interactions among the various bioprocess parameters [34]. Regarding the rhIFNα2b recombinant expression, the point prediction tool of the RSM software determined that the optimum values for IPTG concentration, post-induction period, and cell density are 0.27 mM, 7.98 H, and 3.93, respectively. The models are presented as 3-D response surfaces, to have a better grasp on the three factors of optimal SK production. Five levels of each variable were used in the experimental design. It seems to be more efficient than using three levels of each variable to arrive at the best results. Moreover, the optimizations in five levels reveal the accuracy of the selected range of variables. Analysing the obtained results indicated that the rhIFNα2b expression at the optimized IPTG concentration, post-induction period, and cell density points would lead to 3.5-fold increase in the rhIFNα2b production.
E. coli is one of the fairly characterized recombinant expression systems and various operational expression settings have been developed based on this host. The beginning of the log phase of the bacterial growth has been contemplated to be the best point for the exogenous expression of recombinant proteins by E. coli. However, contrary to the most of previous investigations, we have demonstrated that midway through the log phase and close to the end of this phase are the best points for the highest amount of recombinant rhIFNα2b production. In line with our results, Chae and Galloway et al. have reported that they have reached the high yield recombinant protein expression close to the end point of the log phase [35,36]. Their reports indicated the escalation of soluble expression of the target protein and diminished proteolysis in the cytoplasm. Moreover, the study conducted by Ou et al. agrees well with the idea of optimum expression at the late log growth phase [37]. It should be underscored that this finding is applicable for both the heat-shockinduced promoters and the lac-based promoters [37]. The results obtained from these studies suggest that the E. coli cells, at the midway of log phase and close to the end of this phase, are at a condition similar to the early log phase with the highest physiological activity pertaining to the transcription, translation, and protein folding processes. It should be noted that the secretion of the expressed recombinant protein seems to be alleviated at the same stage. These phenomena could be the direct consequences of the diversion of the metabolic flow of the bacteria towards producing the target protein, which, in turn, could be the rationale behind the growth halt observed an hour post-induction at the end of this phase. The cost of IPTG and its probable cytotoxicity at some concentrations are two factors that make IPTG concentration an imperative agent for the overexpression of recombinant protein. Due to its ability for significant reduction of the growth rate and the production of bacterial proteases degrading heterologous proteins at high concentrations, the IPTG concentration should be subjected to fine-tuning. Although prior investigations have reported a wide range of IPTG concentrations applied for optimum protein expression, our study revealed a concentration as low as 0.27 mM to be the optimum amount of needed IPTG. This result is in concordance with the study conducted by Larentis et al. [38]. They have suggested that employing IPTG at a concentration tenfold lower than the usual amounts could result in the optimum expression of the recombinant protein.
It could be concluded that finding optimum points of IPTG concentration, post-induction period, and cell density of induction (OD600) for rhIFNα2b heterogeneous expression is among the tough challenges that lie ahead of its industrial-scale production. The ever-growing clinical demand for this drug underscores the necessity of its protein expression. The present study has determined the optimum points for these parameters, which lead to 3.5-fold increase in the rhIFNα2b expression. Although these results are highly promising for large-scale rhIFNα2b overexpression, the optimization of other influential parameters of protein expression would bring about higher expression rates.
Acknowledgements
The authors are grateful for the financial support provided by the Gene Transfer Pioneers Company (No.1223343). The authors wish to thank Dr. Seyed Bahman Momen for his assistance during the data analysis.
Financial support and sponsorship
Nil.
Conflict of interest
The authors declare that this paper content has no conflict of interests.
References
- Hesketh R. Introduction to Cancer Biology: Cambridge University Press. 2013.
- Jemal A, Bray F, Center MM, Ferlay J, Ward E, Forman D. Global cancer statistics. CA Cancer J Clin 2011;61:69-90.
- Wang YS, Youngster S, Grace M, Bausch J, Bordens R, Wyss DF. Structural and biological characterization of pegylated recombinant interferon alpha-2b and its therapeutic implications. Adv Drug Deliv Rev 2002;54:547-70.
- Artika IM, Budirahardja Y, Ekowati AL. Molecular cloning and heterologous expression of human interferon alpha2b gene. Am J Biochem Biotechnol 2013;9:423-29.
- Tan JS, Ramanan RN, Azaman SNA, Ling TC, Shuhaimi M, Ariff AB. Enhanced interferon-[alpha] 2 b production in periplasmic space of Escherichia coli through medium optimization using Response Surface Method. Open Biotechnol J 2009;3:117-24.
- Gull I, Samra ZQ, Aslam MS, Athar MA. Heterologous expression, immunochemical and computational analysis of recombinant human interferon alpha 2b. Springerplus 2013;2:264.
- De Maeyer E, Skup D, Prasad K, De Maeyer-Guignard J, Williams B, Meacock P, et al. Expression of a chemically synthesized human alpha 1 interferon gene. Proc Natl Acad Sci 1982;79:4256-9.
- Hitzeman RA, Hagie FE, Levine HL, Goeddel DV, Ammerer G, Hall BD. Expression of a human gene for interferon in yeast. Nature 1981;293:717-22.
- Vallin C, Pimienta E, Ramos A, Rodriguez C, Van Mellaert L, Anné J. Streptomyces as a host for the secretion of heterologous proteins for the production of biopharmaceuticals. J Bus Chem 2005;2:107-111.
- Breitling R, Gerlach D, Hartmann M, Behnke D. Secretory expression in Escherichia coli and Bacillus subtilis of human interferon α genes directed by staphylokinase signals. Mol Gen Genet 1989;217:384-91.
- Shi L, Wang D, Chan W, Cheng L. Efficient expression and purification of human interferon alpha2b in the methylotrophic yeast, Pichia pastoris. Protein Expr Purif 2007;54:220-26.
- Zhang Q, Zhong J, Liang X, Liu W, Huan L. Improvement of human interferon alpha secretion by Lactococcus lactis. Biotechnol Lett 2010;32:1271-77.
- Gasmi N, Fudalej F, Kallel H, Nicaud JM. A molecular approach to optimize hIFN α2b expression and secretion in Yarrowia lipolytica. Appl Microbiol Biotechnol 2011;89:109-19.
- Ohya K, Matsumura T, Ohashi K, Onuma M, Sugimoto C. Expression of two subtypes of human IFN-α in transgenic potato plants. J Interferon Cytokine Res 2001;21:595-602.
- Allen G, Diaz M. Nomenclature of the human interferon proteins. J Interferon Cytokine Res 1996;16:181-84.
- Rossmann C, Sharp N, Allen G, Gewert D. Expression and purification of recombinant, glycosylated human interferon alpha 2b in murine myeloma NSo cells. Protein Expr Purif 1996;7:335-42.
- Babaeipour V, Shojaosadati SA, Maghsoudi N. Maximizing production of human interferon-γ in HCDC of Recombinant E. coli. Iran J Pharm Res 2013;12:563-72.
- Maldonado LMP, Hernández VEB, Rivero EM, de la Rosa APB, Flores JLF, Acevedo LGO, et al. Optimization of culture conditions for a synthetic gene expression in Escherichia coli using response surface methodology: the case of human interferon beta. Biomol Eng 2007;24:217-22.
- Morowvat MH, Babaeipour V, Vahidi H. Optimization of fermentation conditions for recombinant human Interferon beta production by Escherichia coli using the response surface methodology. Jundishapur J Microbiol 2015;8:e16236.
- Huang Y, Lu X, Wang J, Jin X, Zhu J. [Optimization of expression conditions of an induction strategy for improving liver targeted interferon (IFN-CSP) production in E. coli]. Sheng Wu Yi Xue Gong Cheng Xue Za Zhi 2014;31:432-38.
- Kumar M, Singh M, Singh SB. Optimization of conditions for expression of recombinant interferon-γ in E coli. Mol Biol Rep 2014;41:6537-43.
- Sambrook JR. Molecular cloning: a laboratory manual. New York: Cold Spring Harbor Laboratory Press; 2001.
- DeLisa MP, Valdes JJ, Bentley WE. Quorum signaling via AI-2 communicates the “Metabolic Burden” associated with heterologous protein production in Escherichia coli. Biotechnol Bioeng 2001;75:439-50.
- Wolfe AJ. The acetate switch. Microbiol Mol Biol Rev 2005;69:12-50.
- Valgepea K, Adamberg K, Nahku R, Lahtvee PJ, Arike L, Vilu R. Systems biology approach reveals that overflow metabolism of acetate in Escherichia coli is triggered by carbon catabolite repression of acetyl-CoA synthetase. BMC Syst Biol 2010;4:166.
- Eiteman MA, Altman E. Overcoming acetate in Escherichia coli recombinant protein fermentations. Trends Biotechnol 2006;24:530-6.
- Cai Y, Sun J, Wang J, Ding Y, Tian N, Liao X, et al. Optimizing the codon usage of synthetic gene with QPSO algorithm. J Theor Biol 2008;254:123-7.
- Gustafsson C, Govindarajan S, Minshull J. Codon bias and heterologous protein expression. Trends Biotechnol 2004;22:346-53.
- Gao W, Rzewski A, Sun H, Robbins PD, Gambotto A. UpGene: application of a web based DNA codon optimization algorithm. Biotechnol Prog 2004;20:443-48.
- Hatfield GW, Roth DA. Optimizing scaleup yield for protein production: Computationally Optimized DNA Assembly (CODA) and Translation Engineering. Biotechnol Annu Rev 2007;13:27-42.
- Harrison ST. Bacterial cell disruption: a key unit operation in the recovery of intracellular products. Biotechnol Adv 1991;9:217-40.
- Francis DM, Page R. Strategies to optimize protein expression in E coli. Curr Protoc Protein Sci 2010;5:1-29.
- Araujo PW, Brereton RG. Experimental design II. optimization. TrAC Trends Anal Chem 1996;15:63-70.
- Myers RH, Montgomery DC, Anderson-Cook CM. Response surface methodology: process and product optimization using designed experiments. Hoboken, New Jersey: John Wiley Sons; 2016.
- Chae YK, Kim SH, Ellinger JJ, Markley JL. Tracing metabolite footsteps of Escherichia coli along the time course of recombinant protein expression by two-dimensional NMR Spectroscopy. Bull Korean Chem Soc 2012;33:4041-46.
- Galloway CA, Sowden MP, Smith HC. Increasing the yield of soluble recombinant protein expressed in E. coli by induction during late log phase. Biotechniques 2003;34:524-26.
- Ou J, Wang L, Ding X, Du J, Zhang Y, Chen H, et al. Stationary phase protein overproduction is a fundamental capability of Escherichia coli. Biochem Biophys Res Commun 2004;314:174-80.
- Larentis AL, Argondizzo APC, dos Santos Esteves G, Jessouron E, Galler R, Medeiros MA. Cloning and optimization of induction conditions for mature PsaA (pneumococcal surface adhesin A) expression in Escherichia coli and recombinant protein stability during long-term storage. Protein Expr Purif 2011;78:38-47.
