- *Corresponding Author:
- Pornsak Sriamornsak
Pharmaceutical Biopolymer Group, Faculty of Pharmacy, Silpakorn University, Nakhon Pathom 73000, Thailand
E-mail: sriamornsak_p@su.ac.th
| Date of Received | 11 May 2021 |
| Date of Revision | 08 December 2021 |
| Date of Acceptance | 25 November 2022 |
| Indian J Pharm Sci 2022;84(6):1488-1497 |
This is an open access article distributed under the terms of the Creative Commons Attribution-NonCommercial-ShareAlike 3.0 License, which allows others to remix, tweak, and build upon the work non-commercially, as long as the author is credited and the new creations are licensed under the identical terms
Abstract
Mefenamic acid is characterized by a low oral bioavailability due to its slow dissolution and absorption. The purpose of this study was to investigate the effect of salt formation on dissolution of mefenamic acid and its physical stability. Potassium, sodium and lysine salts of mefenamic acid were prepared. The resulting salts formed were characterized by scanning electron microscopy, hot-stage microscopy, Fourier transform infrared spectroscopy, differential scanning calorimetry and powder X-ray diffractometry. In addition, the accelerated stability test was performed at 45°±2° and 75 %±5 % relative humidity for 3 mo. The dissolution of prepared salts was evaluated in comparison to untreated mefenamic acid. The results showed that the potassium and sodium salts of mefenamic acid were successfully prepared, while lysine salt of mefenamic acid could not be formed by the same method. The dissolution of both potassium and sodium salts of mefenamic acid was not significantly different, but the sodium salt was more stable than potassium salt. For this reason, sodium mefenamate was selected for formulating immediate-release tablets. It was also found that the formulated tablets containing sodium mefenamate gave rapid drug dissolution, compared to untreated mefenamic acid. Thus, it can be concluded that the formation of sodium mefenamate and its tablet formulation improve the dissolution of mefenamic acid.
Keywords
Mefenamic acid, salt form, stability, tablet, improved dissolution
In the last few decades, several advanced and efficacious drug discovery strategies are available, resulting in a rapid synthesis and analysis of a tremendous number of new pharmaceutical compounds. Although these compounds have potent activity, more than 40 % of marketed drug and about 70 % of development compounds have been categorized to be a low water-soluble substances[1]. To achieve desired drug level in systematic circulation, solubility is one of important factors. In such cases, to reach therapeutic drug concentration, dosage escalation would be required. However, product formulation process of high dose active drug might be difficult. In addition, since a large amount of drug and excipient would be consumed to manufacture the product, manufacturing cost would also increase. Mefenamic acid (MF) is an anthranilic acid derivative of non-steroidal anti-inflammatory drugs and extensively used as analgesic, anti-inflammatory and antipyretic drug. It is also characterized as a practically insoluble drug with the water solubility of 0.9 μg/ml[2]. After administration, it rapidly permeates through gastrointestinal membrane and reaching maximum plasma concentration within 2-4 h[3,4]. Due to high permeability and low solubility characteristics, MF was classified to Biopharmaceutical Classification System (BCS) class II. For this class, the rate or absorption extent is limited by dissolution rate in gastrointestinal fluid. To overcome the problem, several approaches have been developed to improve the dissolution rate of poorly watersoluble drugs, eg., crystal modification, amorphization, particle size reduction, salt formation, cyclodextrin complexation, pH modification[5], surfactant addition[2,6], etc. Among these approaches, salt formation technique might be a remarkable technique to improve dissolution rate of MF due to its effectiveness, simplicity and affordability. For example, Stephenson et al.[7] reported the improved dissolution rate of delavirdine mesylate prepared by salt formation technique with over 2238 folds. In addition, this approach improves not only the dissolution rate of active drug but also its physical properties, e.g., crystallinity, stability, melting point[8].
To prepare salt form of MF, an important issue might be the selection of salt former. Typically, the pH solubility profiles of acidic drug could be represented by the curve of equilibrated free acid form and its salt. The intercept point of these two curves is called pHmax where the free acid and salt coexist. The equilibrium species at a pH below pHmax is free acid form. By addition of a basic counter-ion, this form would be converted to its salt at a pH above pHmax. However, the pHmax of low solubility acidic drug is rather high[9]. To cross the pHmax, the strong counter-ion (e.g., sodium and potassium) was used in this study and compared with weak counter-ion (e.g., lysine). Though, the dissolution improvement of MF by sodium salt formation was reported earlier[10], its physicochemical properties and thermal behavior have not yet thoroughly characterized. Thus, the objective of this research was to study the effect of salt formation on dissolution rate and stability property of MF. The crystal properties and thermal behavior of different salt forms were also characterized. After that, it was further formulated into immediate release tablets; the tablet properties and dissolution profiles were also investigated.
Materials and Methods
Materials:
MF was purchased from P.C. Drug Center (Thailand). Potassium hydroxide (KOH), Sodium hydroxide (NaOH) and lysine mono-hydrochloride were purchased from Merck (Germany). Microcrystalline cellulose (Avicel® PH102) was obtained from FMC Corporation (USA). Colloidal silicon dioxide (Aerosil®) was obtained from Evonik (Germany). Sodium starch glycolate (Explotab®) was obtained from Maxway (Thailand). Magnesium stearate was provided by Glaxo Wellcome Vidhasom (Thailand). Other chemical reagents were of analytical grade and chromatographic solvents were of High Performance Liquid Chromatography (HPLC) grade.
Preparation of mefenamate salts:
Mefenamate salts were prepared by addition of excess MF to 2 % (w/v) KOH, NaOH, or lysine solution. The mixture was continuously stirred using magnetic stirrer to obtain a clear yellow solution with excess MF powder. Vacuum filtration apparatus with 0.22 μm membrane filter was used to remove an excess powder. Mefenamate salt solution was dried at 80° in hot air oven. The dried mass was ground into fine powders using mortar and pestle. The resultant powders were kept in air-tight plastic bag and stored in desiccator for further characterization.
Physicochemical characterization
MF content analysis: An accurate weighed amount (10 mg) of mefenamate salt powders was transferred to 10 ml volumetric flask and diluted to the volume by the mobile phase consisted of acetonitrile, pH 5.0 phosphate buffer and tetrahydrofuran (23:20:7, by volume). The sample was filtered through 0.45 μm membrane filter. All samples were analyzed with (HPLC, model JASCO PU-2089 plus quaternary gradient inert pump, and a JASCO Ultraviolet (UV)- 2070 plus UV-Visible detector, Jasco, Japan) and octadecylsilane (C18) column (5 μm, 4.6 nm×250 mm ACE, Advanced Chromatography Technologies Ltd., USA). The system was operated at room temperature using isocratic mode with flow rate of 1 ml/min. The UV detector wavelength was set at 254 nm. MF concentration was calculated based on linear calibration curve.
Particle size distribution: Particle size distribution of MF and mefenamate salts was investigated by sieve analysis, using sieves with an opening size of 850, 425, 250,180, 150 and 75 μm. Each wire sieve was weighed before testing. After that, the sieve was arranged in a stack with the opening size decreasing from the top to bottom on the mechanical shaker at room temperature. To investigate size distribution of mefenamate salts, 50 g of each sample were placed onto top sieve prior to test. Sieve stack was vibrated and reweighed until constant weight was reached. Size distribution of each sample was calculated.
Powder flowability: Flowability of the mefenamate salt was determined by calculating percent compressibility. Tap density tester (Pharmatest, Germany) was used to measure bulk or tapped volume of the powder. An accurately weighed amount (50 g) of sample was filled in a 250 ml glass measuring cylinder and bulk volume (V0) was measured prior to test. After tapping powder until constant volume was achieved, final tapped volume (Vf) was recorded. Each experiment was performed in triplicate and compressibility index was calculated according to the following equation:
Compressibility index=100 (V0-Vf)/V0 (1)
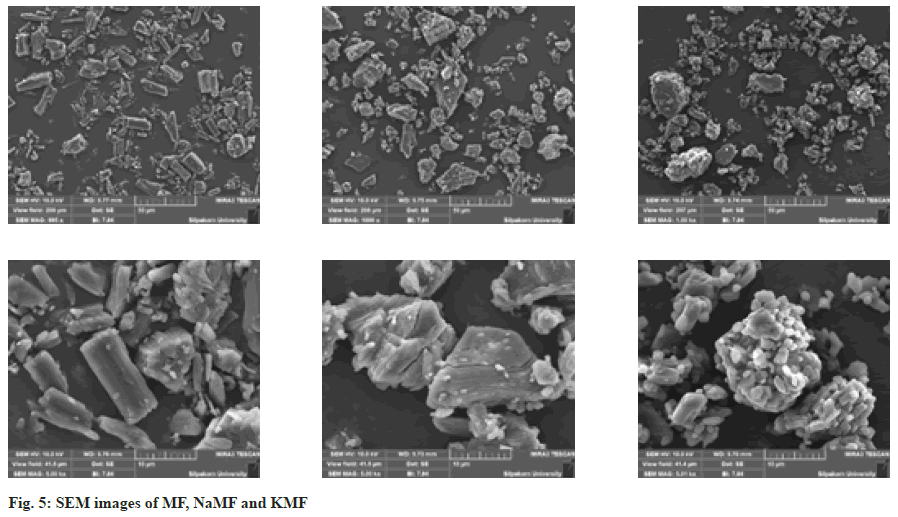
Surface morphology: The surface morphology of MF, Sodium mefenamate (NaMF) and Potassium mefenamate (KMF) was observed by Scanning Electron Microscope (SEM) (model MIRA3, Tescan, Czech Republic). Prior to imaging, the samples were fixed on stubs and sputter coated with a gold layer under vacuum environment. The SEM images were taken at magnification of 1000× and 5000×.
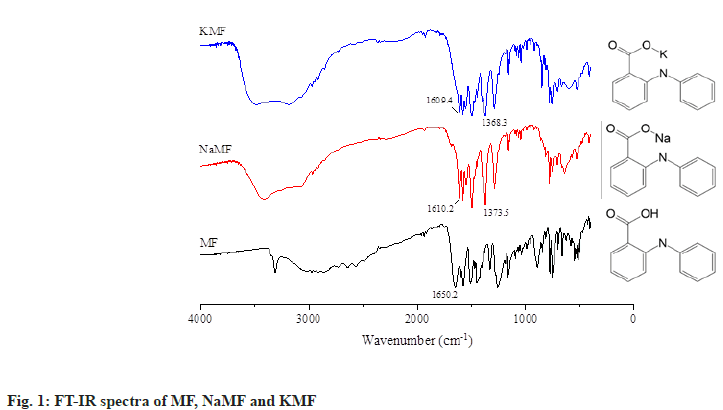
Fourier Transform Infrared (FT-IR) spectroscopy: FTIR spectra of MF and salt powders were recorded with a FTIR spectrophotometer (model Nicolet 4700, Thermo Electron Corporation, USA) using KBr disk method (fig. 1). KBr powder was dried over silica gel before use. The samples were combined with KBr powder using mortar and pestle, and compressed into a disk with pressure of 5 tons for 30 s. The samples were placed on sample holder and the scan range was 4000 to 400 cm-1 with a resolution of 4 cm-1.
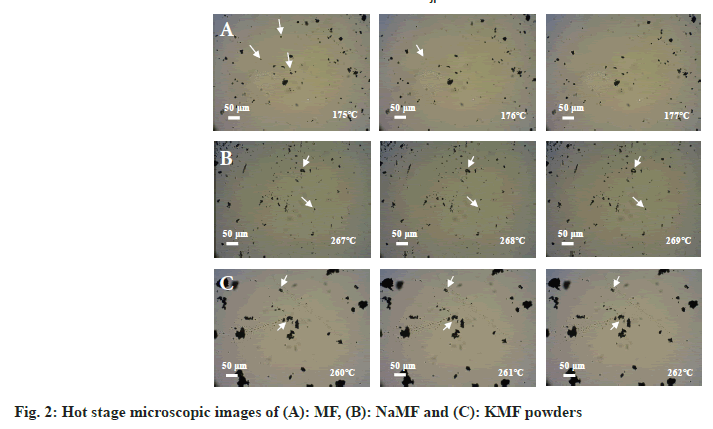
Hot-stage microscopy: The transformation of MF and mefenamate salts during heating was analyzed under an optical microscope (Olympus, Japan) equipped with temperature-controlled stage (model FP82HT, Mettler Toledo, Switzerland) at total magnification of 734.6x. The heating rate was set at 4°/min. The morphology changes of MF and mefenamate salts was visually identified and noted as a function of temperature (fig. 2).
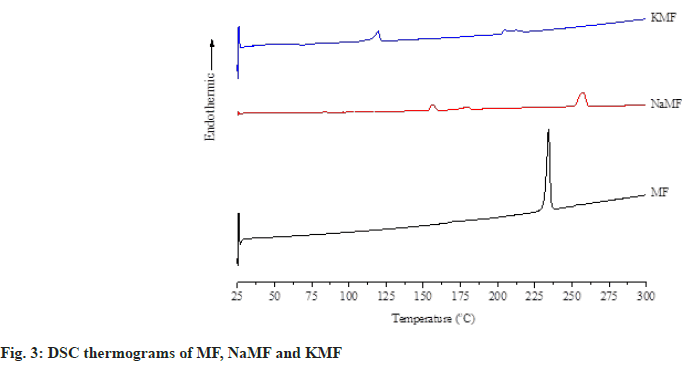
Differential Scanning Calorimetry (DSC): Thermal behavior of powders was carried out using a differential scanning calorimeter (DSC, Perkin Elmer Instrument, USA). Samples of about 2 to 3 mg were placed in aluminum pan and sealed with its cover by pressing in a crimper. The heating rate was set at 10°/min (fig. 3). All samples were measured over the temperature range from 25°-300° under an inert nitrogen purge of 10 ml/min.
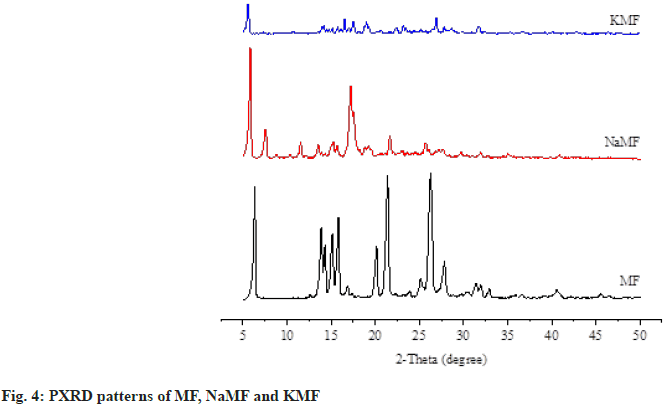
Powder X-ray Diffractometry (PXRD): The physical states of MF and salt powders were evaluated using PXRD (model Miniflex II, Rigaku, Japan) (fig. 4). Each sample was packed into PXRD glass slide and placed on sample holder. The diffraction patterns were recorded using Copper K-alpha (CuKα) radiation source with nickel filters over a range of 5° to 50° 2θ.
In vitro dissolution testing of MF and mefenamate salts:
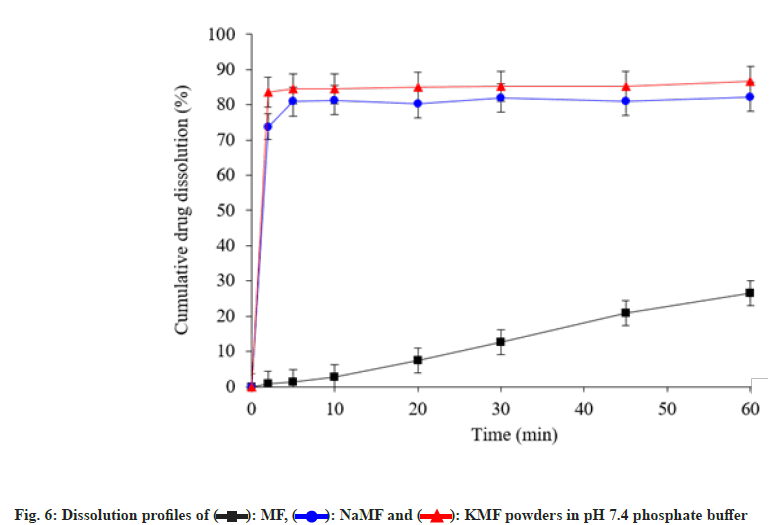
In vitro dissolution test was carried out using United States Pharmacopeia (USP) dissolution apparatus II (model DT70, Erweka GmbH, Germany) with 900 ml of pH 7.4 phosphate buffer under sink condition. The dissolution medium temperature was kept constant at 37°±0.5° and paddle speed was adjusted to 50 rpm. Accurately weighed amount of sample (equivalent to 100 mg MF) was placed into the vessel. At predetermined time intervals (2, 5, 10, 20, 30, 45 and 60 min), 5 ml of medium was withdrawn and immediately replaced with fresh medium. The concentration of MF in dissolution medium was determined by HPLC method specified under 2.3.1. The KinetDS 3.0 curve fitting program was used to calculate Mean Dissolution Time (MDT) of the samples.
Stability of mefenamate salts: Salt powders were kept in air-tight plastic bags and stored in polyethylene bottles. The stability study was performed under accelerated storage condition in temperature-controlled cabinet at 45±2° and 75 %±5 % relative humidity for 3 mo. The moisture content, drug content and in vitro dissolution testing in pH 7.4 phosphate buffer solutions were investigated every month.
Preparation of immediate release tablets:
Table 1 shows formulation used for preparing immediate release tablets in this study. NaMF and microcrystalline cellulose were blended together for 2 min. Wet mass was then prepared by addition of isopropyl alcohol. After that, the mass was forced through 1180 μm aperture sieve. The wet granules were subsequently dried at 40° in hot air oven for 4 h. Moisture content of dried granules was measured using moisture balance (model YTX01L, Sartorius, Germany). Dried granules were forced through wire sieve with the opening size of 1000 μm. To improve disintegration property of tablets, sodium starch glycolate was added to the prepared granules. The mixture was further blended with lactose, colloidal silicon dioxide and magnesium stearate in plastic container. Granule mixtures were weighed and then compressed by hydraulic press machine (model SPECAC 15011, Specac Ltd., United Kingdom) using flat-face punches with pressure of 0.5 tons for 2 s. The prepared tablets were kept in air-tight plastic bags and stored in desiccator.
| Ingredient | Amount (mg) | |
|---|---|---|
| MF tablets | NaMF tablets | |
| MF | 100 | - |
| NaMF | - | 109 |
| Microcrystalline cellulose | 35 | 35 |
| Sodium starch glycolate | 8 | 8 |
| Colloidal silicon dioxide | 3 | 3 |
| Magnesium stearate | 2 | 2 |
| Lactose | 52 | 43 |
| Total | 200 | 200 |
Table 1: Composition of MF and NaMF Immediate Release Tablets
Evaluation of tablets:
MF and NaMF content analysis: Ten tablets were sampled and ground to a fine powder. An accurately weighed of each sample (equivalent to 100 mg of MF) was transferred into 10 ml volumetric flask and diluted to the volume by addition of mobile phase. After that, 1 ml of the solution was transferred to 10 ml volumetric flask and diluted to the volume. The content of MF and NaMF in the tablets was analyzed with HPLC.
Hardness and friability testing: Six tablets in each formulation were randomly sampled and hardness was determined using hardness tester (model TBH 225TD, Erweka GmbH, Germany). The tablets were weighed as close as possible to 6.5 g and friability testing was performed with friability tester (model TA 120, Erweka GmbH, Germany). Any dust was removed from tablets before placing in friability drum which was rotated at 25±4 rpm for 4 min. After test finished, loose dust was removed and tablets were accurately weighed. The friability of formulations was calculated as percentage of weight loss.
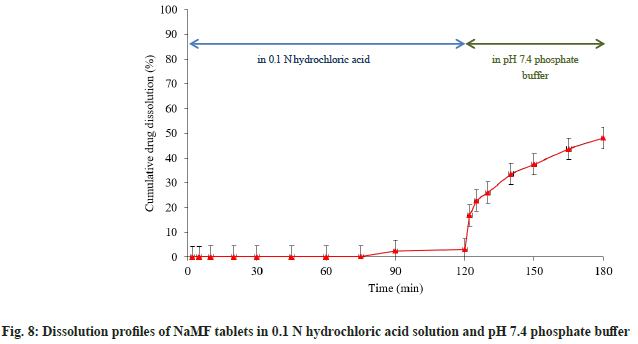
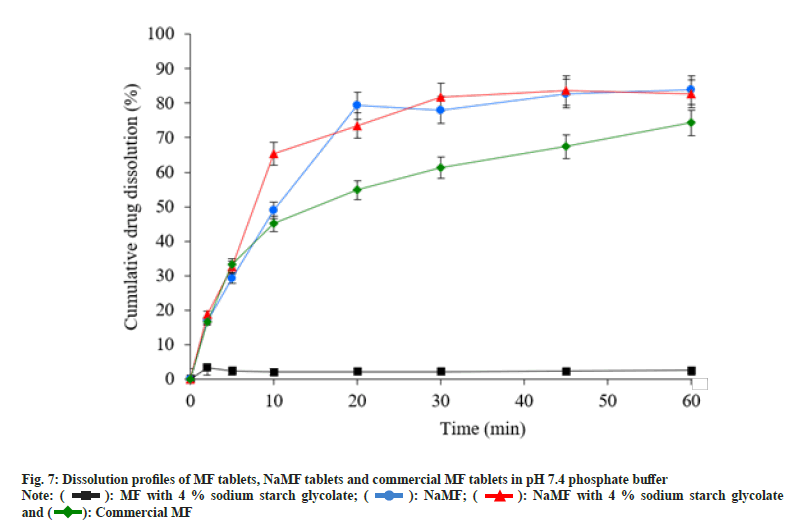
In vitro dissolution testing of tablets: Three tablets of MF commercial product, MF and NaMF containing equivalent amount of 100 mg MF were sampled. In vitro dissolution testing was performed using USP dissolution tester with paddle (model DT70, Erweka GmbH, Germany). The paddle speed was set at 50 rpm. To characterize dissolution profiles, MF and NaMF tablets were first tested in 900 ml of phosphate buffer pH 7.4. After that, three more NaMF tablets were tested in simulated physiological media. The tablets were soaked in 750 ml of 0.1 N hydrochloric acid for 2 h, the pH of dissolution medium was adjusted to 7.4 by addition of 250 ml of 0.2 M tribasic sodium phosphate. The dissolution test was then performed for another 1 h. The samples of 5 ml were withdrawn at predetermined time intervals (2, 5, 10, 20, 30, 45, 60, 75, 90 and 120 min) and replaced with fresh medium. The drug concentration was analyzed by HPLC.
Results and Discussion
After salt formation, off-white powders of NaMF and KMF were successfully prepared while lysine salt of MF could not be formed by using the same method. As sieve analysis was used for characterization of mefenamate salts, the results showed that mean size distribution of NaMF and KMF was 308.67 and 296.97 μm respectively. At the equimolar of MF and NaOH or KOH, the average content of NaMF and KMF analyzed with HPLC was found to be 98.08 %±4.53 % and 100.95 %±7.23 % of the theoretical MF contents, indicating that the reaction between the MF and basic substances was complete. To characterize the identity of mefenamate salts, FTIR spectroscopy was used. The FTIR spectrum of native MF showed a band at 1258.3 cm-1 and 1509.8 cm-1 which was assigned to C–O stretching of conjugated carboxylic acid and N–H bending of secondary amine. Moreover, a strong band at 1650.2 cm-1 was also recorded, indicating the present of C=O stretching of conjugated carboxylic acid of MF. After reacting with basic substances, this band disappeared from the spectrum of NaMF and KMF. Two new strong peaks were found at 1610.2, 1373.5 cm-1 and 1609.4, 1368.3 cm-1 in NaMF and KMF spectrum, respectively. These bands can be assigned to asymmetric and symmetric stretching of COO-, allowing the authors to hypothesize that the hydrogen atom of MF was substituted by Na and K atom. Therefore, it might be inferred that mefenamate salt was successfully prepared.
Thereafter, DSC and hot-stage microscopy were combined together in order to study the transformation of MF and its salt. MF showed two endothermic peaks at 170.9° and 233.9°, corresponding to the MF fusion observed under hot-stage microscope at approximately 176° which attributed to the transformation of form I to form II and melting temperature of form II as reported earlier by Antonio et al.[10]. Two endothermic peaks at 156.2° and 257.1° were observed in the DSC thermogram of NaMF. However, no significant different transformation was observed under hot-stage microscope in the temperature range of 130°-180°. Therefore, it was hypothesized that the first peak at 156.2° attributed to an evaporation of water in the samples. The melting point of NaMF determined by hot-stage microscope was around 268°. Meanwhile, the melting temperature of NaMF was 257.1° which was almost the same position reported by Jaber et al.[11]. In the case of KMF, the thermogram showed the endothermic peaks at 156.2° and 194.6° which did not coincide with the results under hot-stage microscope. Even though the temperature was increased to 350°, KMF powder did not melt. It was burnt and transformed into decomposed black powders. Therefore, the peak at 156.2° might be attributed to water evaporation while another peak at 194.6° were attributed to the thermal decomposition temperature of KMF.
The crystal arrangement of MF and mefenamate salts were investigated by PXRD, along with the SEM images (fig. 5). The characteristic peaks of crystalline phase at 6.3, 21.4 and 26.2 were clearly observed in the diffractogram of MF, corresponding to previous study[10]. Small crystalline peaks were also observed in the diffractograms of NaMF and KMF. These results are in good agreement with the SEM images, depicting different crystal shapes of MF and mefenamate salts. MF presented an orthombic crystal while an irregular crystal of NaMF and KMF was observed.
To study dissolution profiles of MF and its salts, phosphate buffer pH 7.4 was used to simulate the physiological environment (fig. 6). After test end, less than 30 % cumulative drug dissolution was obtained from native MF powders. On the other hand, NaMF and KMF showed rapid drug dissolution with cumulative drug dissolved more than 80 % within 5 min. These phenomena can be attributed to high water solubility of the ionizable NaMF and KMF in phosphate buffer.
Flowability of mefenamate salts was determined indirectly by measuring percent compressibility of the powder. The results showed that percent compressibility of MF, NaMF and KMF was 39.7, 35.2 and 40.3 respectively. According to the scale of powder flowability[12], powder with compressibility index greater than 25 % is considered to be an indication of poor flowability whereas lowest compressibility index close to 15 % corresponds to a good flow properties. Therefore, NaMF was considered to be a very poor flowability powder while MF and KMF were considered to be a very, very poor flowability powder. To improve flowability of MF and mefenamate salt, wet granulation might be a suitable method to prepare free-flowing granules.
Stability study of MF and mefenamate salts was conducted in stability cabinet at 45°±2°, 75 %±5 % relative humidity for 3 mo. The appearance, moisture content, drug content and MDT were presented in Table 2; these properties were used to characterize the stability of MF and mefenamate salts. The results revealed that appearance; moisture content and MDT of mefenamate salts were not significantly different, whereas the drug content of KMF was decreased greater than that of NaMF. This result demonstrated the predominant stability of NaMF over KMF and therefore NaMF was selected to prepare immediate release tablets. Drug content, hardness and friability of MF tablets and NaMF tablets were tested. The results are presented in Table 3. The in vitro dissolution test of MF tablets, in phosphate buffer pH 7.4, was compared with that of NaMF. After test end, less than 5 % cumulative drug release was obtained from MF tablets, whereas more than 70 % and 80 % were obtained from NaMF tablets and commercial MF tablets, respectively (fig. 7).
| Observed parameters | NaMF | KMF | ||||||
|---|---|---|---|---|---|---|---|---|
| Initial | 1st mo | 2nd mo | 3rd mo | Initial | 1st mo | 2nd mo | 3rd mo | |
| Appearance | White powder | White powder | White powder | White powder | White powder | White powder | White powder | White powder |
| Moisture content (%)±SD | 5.07±0.15 | 8.29±0.44 | 15.01±0.47 | 17.33±0.31 | 12.05±0.71 | 12.79±0.41 | 16.86±0.09 | 17.18±0.04 |
| Drug content (%)±SD | 101.61±4.05 | 97.74±1.84 | 99.91±3.66 | 95.49±5.18 | 100.59±5.65 | 89.55±2.96 | 93.53±6.96 | 86.78±2.62 |
| MDT (min)±SD | 0.67±0.23 | 0.48±0.62 | 0.47±1.31 | 1.73±0.70 | 1.21±0.72 | 1.29±0.80 | 1.00±0.34 | 2.49±1.49 |
Note: All experiments were conducted in triplicate and SD: Standard Deviation
Table 2: Moisture Content, Drug Content and MDT of NaMF and KMF Powders
| Observed parameters | Formulation | |
|---|---|---|
| MF tablets | NaMF tablets | |
| Drug content (%)±SD | 100.54±1.63 | 99.30±2.09 |
| Hardness (kg)±SD | 12.3±0.3 | 15.1±0.4 |
| Friability (%)±SD | 0.57±0.73 | 0.22±0.36 |
Note: All experiments were conducted in triplicate and SD: Standard Deviation
Table 3: Tablet Properties of Mf Tablets and NaMF Tablets
From the results of characterization study, the diffractogram revealed that the crystal structure of NaMF did not change to amorphous form; therefore, it might be concluded that MF dissolution was enhanced by salt formation with basic substance. In case of high cumulative dissolution obtained from commercial MF tablets, it might be explained by the effect of Sodium Lauryl Sulfate (SLS), an anionic surfactant, which was one of inactive ingredients in the formulation. By addition of SLS, wettability of hydrophobic MF was improved and thus facilitated ease of drug dissolution. This might be an explanation of the result.
To study dissolution behavior of NaMF along the gastrointestinal system, NaMF tablets were tested in pH 1.2 and 7.4 dissolution media. After soaking the tablets in pH 1.2 hydrochloric acid for about 120 min, the results showed that there was almost no NaMF released. This finding might be explained by the conversion of NaMF into MF base form hence it could not dissolve in acid medium resulting in extremely low drug dissolution in acid state. After adjusting the pH of dissolution medium to pH 7.4, the test was continued for 1 h more (fig. 8). The result revealed that high drug dissolution was obtained. It might be hypothesized from the results that NaMF might be converted into MF form in gastric environment, resulting in low drug dissolution. Enteric coated dosage form might be a suitable solution of this problem in order to prevent drug conversion.
Mefenamate salts were prepared by the reaction of MF and basic substances (e.g., NaOH, KOH and lysine) in an aqueous phase. The FT-IR spectrum confirmed that NaMF and KMF with improve dissolution rate were successfully prepared in the present study. Due to the stability of NaMF, it was further prepared into immediate release tablet by wet granulation technique in order to improve its flowability. In comparison to commercial MF tablets, in pH 7.4 phosphate buffer, NaMF tablets showed higher cumulative drug dissolution. Therefore, NaMF might be considered as solution to improve the dissolution of MF.
Conflict of interests:
The authors report no conflict of interests.
References
- Williams HD, Trevaskis NL, Charman SA, Shanker RM, Charman WN, Pouton CW, et al. Strategies to address low drug solubility in discovery and development. Pharmacol Rev 2013;65(1):315-499.
[Crossref] [Google Scholar] [PubMed]
- Fujimori M, Kadota K, Tozuka Y. Mixed micelle system produced by interaction between transglycosylated stevia and an ionic surfactant improves dissolution profile of mefenamic acid. J Pharm Sci 2017;106(4):1117-23.
[Crossref] [Google Scholar] [PubMed]
- Shinkuma D, Hamaguchi T, Yamanaka Y, Mizuno N. Correlation between dissolution rate and bioavailability of different commercial mefenamic acid capsules. Int J Pharm 1984;21(2):187-200.
- Hamaguchi T, Shinkuma D, Yamanaka Y, Mizuno N. Bioavailability of mefenamic acid: Influence of food and water intake. J Pharm Sci 1986;75(9):891-3.
[Crossref] [Google Scholar] [PubMed]
- Kawabata Y, Wada K, Nakatani M, Yamada S, Onoue S. Formulation design for poorly water-soluble drugs based on biopharmaceutics classification system: Basic approaches and practical applications. Int J Pharm 2011;420(1):1-0.
[Crossref] [Google Scholar] [PubMed]
- Sriamornsak P, Limmatvapirat S, Piriyaprasarth S, Mansukmanee P, Huang Z. A new self-emulsifying formulation of mefenamic acid with enhanced drug dissolution. Asian J Pharm Sci 2015;10(2):121-7.
- Stephenson GA, Aburub A, Woods TA. Physical stability of salts of weak bases in the solid-state. J Pharm Sci 2011;100(5):1607-17.
[Crossref] [Google Scholar] [PubMed]
- Elder DP, Holm R, De Diego HL. Use of pharmaceutical salts and cocrystals to address the issue of poor solubility. Int J Pharm 2013;453(1):88-100.
[Crossref] [Google Scholar] [PubMed]
- Serajuddin AT. Salt formation to improve drug solubility. Adv Drug Deliv Rev 2007;59(7):603-16.
[Crossref] [Google Scholar] [PubMed]
- Antonio M, Maggio RM. Assessment of mefenamic acid polymorphs in commercial tablets using chemometric coupled to MIR and NIR spectroscopies: Prediction of dissolution performance. J Pharm Biomed Anal 2018;149:603-11.
[Crossref] [Google Scholar] [PubMed]
- Bani-Jaber A, Hamdan I, Al-Khalidi B. Sodium mefenamate as a solution for the formulation and dissolution problems of mefenamic acid. Chem Pharm Bull 2007;55(8):1136-40.
[Crossref] [Google Scholar] [PubMed]
- The United States Pharmacopeia: The National Formulary. Rockville, MD: United States Pharmacopeial Convention; 2013.
 ): MF, (
 ): NaMF and (
 ): KMF powders in pH 7.4 phosphate buffer
 ): MF with 4 % sodium starch glycolate; (
 ): NaMF; (
 ): NaMF with 4 % sodium starch glycolate
and (
 ): Commercial MF