- *Corresponding Author:
- D. H. Tran
Department of Pharmacy, Hue University of Medicine and Pharmacy, Hue University, Hue 520000, Vietnam
E-mail: thdung@huemed-univ.edu.vn
| Date of Received | 11 May 2021 |
| Date of Revision | 08 December 2021 |
| Date of Acceptance | 25 November 2022 |
| Indian J Pharm Sci 2022;84(6):1498-1505 |
This is an open access article distributed under the terms of the Creative Commons Attribution-NonCommercial-ShareAlike 3.0 License, which allows others to remix, tweak, and build upon the work non-commercially, as long as the author is credited and the new creations are licensed under the identical terms
Abstract
This study aimed to develop a simple and fast reverse-phase high performance liquid chromatographydiode array detection method for the simultaneous determination of carvedilol and five impurities (A, B, C, D, E) in tablets. The separation was carried out by Zorbax Eclipse XDB-C8 (150×4.6 mm; 5 μm) column. Isocratic elution was carried out using a mobile phase mixture of acetonitrile and phosphate buffer pH 2 (containing 1.5 mM 1-heptanesulfonic acid) in the ratio of 43:57 (v/v); while the flow rate was maintained at 0.7 ml/min. The impurity E was detected at 220 nm, carvedilol and other impurities were detected at 240 nm by a photodiode array detector. The good linearity was obtained with correlation coefficients (r2) greater than 0.995 in the range of 0.01-1500 μg/ml for carvedilol, 0.04-3.0 μg/ml for impurity A and 0.1- 3.0 μg/ml for impurities B, C, D, E. Inter-day and intra-day accuracy and precision data were within the acceptable limits. This new method has satisfactory applications in the quality control of pharmaceuticals containing carvedilol.
Keywords
Carvedilol, high performance liquid chromatography, impurities, hypertension, tablets
Impurities may be formed during manufacturing, the storage, or/and the distribution of pharmaceuticals. Undesirable compounds, even in small amounts, which are present in tablets, may affect not only the therapeutic efficacy but also the safety of the pharmaceutical products[1]. However, the analysis of trace impurities in the ingredients and pharmaceutical dosage forms is one of the most challenging tasks of analytical chemists[2].
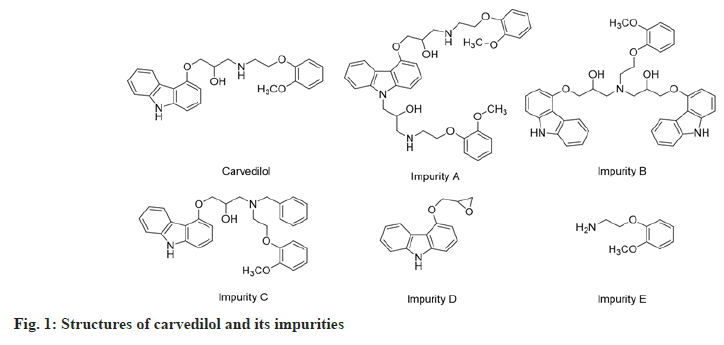
Carvedilol or (±)-1-9H-(carbazol-4-yloxy)-3-((2- (2-methoxyphenoxy)ethyl)amino)-2-propanol (fig. 1), is an antihypertensive agent with β and α1-adrenergic receptor-blocking activities[3-5]. It has been used as an antihypertensive, anti-angina agent and for the treatment of congestive heart failure for a long time[4,6-9]. The impurities A, B, C, D and E (fig. 1) are compounds that appear during the synthesis or the storage of carvedilol. According to the Globally Harmonized System (GHS) of classification and labeling of chemicals, these impurities may cause skin and eye irritation or damage to the digestive tract when swallowed or inhaled[10-12]. Especially, impurity D is classified in the GHS08 group, which is toxic on target organs and the risk of cancer[13]. According to Muller's classification, impurity D is a carcinogen agent because of contains an epoxy group, which is a group binding to deoxyribonucleic acid and inducing mutagenic potential[14,15]. Therefore, the quality control of carvedilol ingredient as well as pharmaceutical dosage forms is very important.
Accordingly, the United States Pharmacopoeia (USP) 41 have established maximum allowed limits for individual carvedilol related compound as not more than 0.02 % (impurity C) or 0.1 % (impurity A, B, D, E) in bulk and as not more than 0.2 % (each impurity) in tablets[16]. Several analytical methods for the estimation of carvedilol in tablets were reported in USP 41, British Pharmacopoeia (BP) 2018 and many literatures, such as Liquid Chromatography-Mass Spectrometry (LC-MS), High Performance Liquid Chromatography (HPLC), High-Performance Thin-Layer Chromatography (HPTLC) with Ultraviolet (UV) detector or Gas Chromatography–Mass Spectrometry (GC-MS)[16- 24].
Amongst them, there were not many reports on the simultaneous determination of carvedilol and its impurities. These procedures have some disadvantages, such as only analyzing carvedilol[19-22,24], analyzing two or four impurities[17,23], applying of solvent gradient program[16,18,23], long analysis time [16,18,23], or high Limit of Detection (LOD) and Limit of Quantitation (LOQ) values[19,22]. Hence, this study aimed to develop an isocratic reverse-phase HPLCdiode array detection method for the simultaneous determination of carvedilol and five impurities (A, B, C, D and E) (fig. 1) in tablets. The method was validated for accuracy, precision, specificity, sensitivity, linearity, LOD, LOQ and robustness parameters as per International Council for Harmonisation (ICH) guidelines[25]; then applied for the assay of several commercial tablets.
Materials and Methods
Materials:
Carvedilol (batch number: 10-SCC-93-1, containing 98.0 %) was purchased from Toronto Research Chemicals (Canada). Impurity A (batch number: JCCRD- 01, containing 97.9 %) was purchased from Dr. JCR BIO (India). Impurities B, C, D and E (containing 99.70, 99.60, 99.96 and 99.77 %, respectively) were the secondary standards that were obtained from the Institute of Drug Quality Control–Ho Chi Minh City, Vietnam.
Sodium dihydrogen phosphate (NaH2PO4), Sodium hydroxide (NaOH), Phosphoric acid (H3PO4), Trifluoroacetic acid (TFA), Acetonitrile (ACN) and Methanol (MeOH) (HPLC grade) were purchased from Merck (Germany), ultrapure water used for HPLC analysis was produced by a Milli-Q water purification unit (Millipore, Bedford, MA, USA); sample and solvent membrane filter, 0.45 μm pore size, were purchased from Supelco (USA).
Six product brands of carvedilol tablets purchased in the Vietnamese market were marked with the symbols M1, M2, M3, M4, M5, M6 and each tablet contained 6.25 or 12.5 mg of carvedilol.
Instrumentation:
Samples were analyzed on a Shimadzu LC-20AD system (Japan) composed of a parallel double micro plunger type pump, a photodiode array detector (SPD-M20A), a CTO-20A column oven, a SIL-20AC auto sampler and a DGU-20A degasser module. An HR-250AZ electronic balance (A and D Company, Japan) was used to weigh the samples. pH values were measured by a Sension+ PH3 pH-meter (Hach, Colorado, US).
Preparation of standard solutions: Carvedilol stock solution was prepared by accurately weighing 40 mg of carvedilol standard in a 10 ml volumetric flask, dissolving in ACN to tolerant volume. Each single impurity stock solution was prepared by accurately weighing 20 mg of impurity in a 10 ml volumetric flask, dissolving in ACN to tolerant volume. A volume of 1.0 ml of each solution was diluted to a concentration of approximately 20 μg/ml.
For the calibration curve, working standard solutions were prepared by mixing of these stock solutions to obtain different concentrations within the range of 0.01-1500 μg/ml for carvedilol, 0.04-3.0 μg/ml for impurity A and 0.1-3.0 μg/ml for impurities B, C, D and E.
Preparation of sample solutions: Tablet powder equivalent to 10 mg of carvedilol was weighed and transferred to a 10 ml volumetric flask, then sonicated with ACN for 15 min and diluted with ACN to volume. These sample solutions were filtered through nylon filter membranes pore size 0.45 μm for the HPLC analysis. The model sample solutions were prepared by spiking standard solutions of impurities A, B, C, D and E into sample solutions (corresponding to the allowable percentage of each impurity is 0.2 %).
Optimization of chromatographic condition:
The HPLC analysis was carried out on a Zorbax Eclipse XDB-C8 column (4.6 mm ID×150 mm, 5 μm in particle size, Agilent, USA); the detection wavelength was set at 220 nm for E impurity and 240 nm for carvedilol and other impurities; the column oven temperature was maintained at 40°. The sample injection volume was 20 μl. The optimum HPLC condition for the separation simultaneously of carvedilol and five impurities was investigated by varying mobile phases and flow rate. The optimum conditions were justified from the system suitability test, including Resolution (Rs), Tailing factor (Tf), the Number of theoretical plates (N), Percent Relative Standard Deviation (RSD %) of Retention time (Rt) and Peak area (S).
Method validation:
The optimized condition was evaluated according to the ICH guidelines, for the specificity, linearity, precision, accuracy, LOD, LOQ and robustness[25].
Specificity experiments were performed by comparing chromatograms of blank, standards, sample and spiked-standard solutions. Besides, the specificity of the method was verified by peak purity index and UV spectra overlay.
Linearity was established at different concentrations in the range of 0.01-1500 μg/ml for carvedilol, 0.04-3.0 μg/ml for impurity A and 0.1-3.0 μg/ml for impurities B, C, D and E. The calibration curves were plotted of the peak areas vs. concentrations. Linear regression and coefficient of determination (r2) were calculated.
The precision of the method was evaluated by the repeatability (intra-day) and intermediate precision (inter-day). Repeatability was studied by analyzing samples (M1 tablets) and model samples (M1 tablets spiked impurity B, C, D, E), within 1 d and under the same experimental conditions. Intermediate precision was performed by analyzing the above samples on a different day.
Accuracy was evaluated by the percent recovery of impurities standard spiked into samples. Three different known amounts of standards corresponding to 80 %, 100 % and 120 % of the accepted concentrations of these impurities were added to the sample solutions for analysis.
The LOD and LOQ were determined based on a Signal-to-Noise (S/N) ratio of 3 and 10, respectively. The precision and accuracy at LOQ values were measured.
Robustness was performed by making deliberately minor changes in the parameters of the method including wavelength (±2 nm), column temperature (±4°) and pH of mobile phase (±0.1 unit). Obtained data of each case was evaluated by analyzing the precision of the method on model sample solutions.
For the solution stability test, the model sample solutions were prepared and stored in tightly-sealed containers, protected from light at room temperature. The solutions were injected at 0, 24, 48 h time intervals, the content of carvedilol and its impurities were evaluated and the consistency of analytes at each time interval was checked.
Results and Discussion
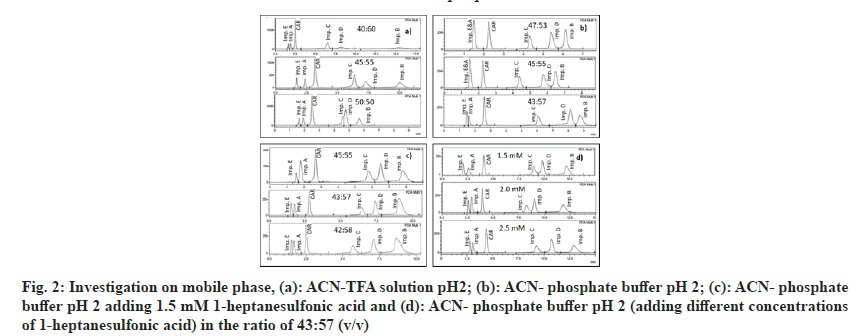
Investigating many mobile phase solvents with different ratios of ACN and TFA solution pH 2 (40:60, 45:55 and 50:50, v/v), the results shown that the peaks were well-shaped and separated, the values of Rs, Tf were achieved, but the peak purity index was low at the ratio of 45:55 (fig. 2a). The mobile phase ACN-phosphate buffer pH 2 was tested at the ratios of 47:53, 45:55 and 43:57 and the results showed that impurities A and E were not completely separated or overlapped (fig 2b). The added ion-pairing agent (1-heptanesulfonic acid) has been shown to increase the peak resolution of the two impurities A and E (fig. 2c). Investigating the concentration of 1-heptanesulfonic acid added at 1.5 mM, 2 mM and 2.5 mM found that the separation of impurities A and E was the best at 1.5 mM 1-heptanesulfonic acid, the Rs value is greater than 1.5 (fig. 2d). Compared to the studies of Raju et al.[26,27], acid-1-heptanesulfonic, an ion-pairing agent that was used in this method, was shown to significantly improve the retention time and increase the resolution between impurity E with impurity A. This was explained by impurity E was a polar compound, which could interact with 1-heptanesufonic acid in the mobile phase, thus increasing the interaction with the stationary phase to prolong the time retention of impurity E, leading to the separation of impurities A and E.
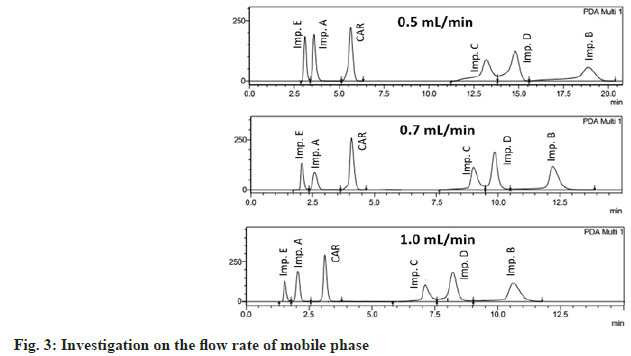
The flow rate was tested in the range of 0.5 to 1.0 ml/min. A better peak shape was obtained at flow rates of 0.7 ml/min and 1 ml/min. In order to reduce the system pressure, the flow rate of 0.7 ml/min was suitable for the separation of impurities (fig. 3).
Based on the above results, the optimal chromatographic conditions were as follows; Zorbax Eclipse XDB-C8 column (4.6 mm ID×150 mm, 5 μm in particle size, Agilent, USA); the mobile phase was a mixture of ACN and phosphate buffer pH 2 (containing 1.5 mM 1-heptanesulfonic acid) in the ratio of 43:57 (v/v); the detection wavelength was set at 220 nm for impurity E and 240 nm for carvedilol and other impurities; the column temperature was 40°; the flow rate was 0.7 ml/min and the sample injection volume was 5 μl (fig. 3). The total analysis time of this method was 15 min, which was faster than the results reported by Raju, Mahajan and Rao[23,26,27], in which the analysis time was 20, 60 and 70 min respectively.
The result of the system suitability test was shown in Table 1. These parameters confirmed that the condition was appropriate for analysis according to the ICH criteria.
| Parameter | Tr (min) | S (mA U.S) | Rs | N | Tf | |
|---|---|---|---|---|---|---|
| Carvedilol | Mean | 3.985 | 22 623 276 | 5.18 | 2209 | 1.04 |
| RSD % | 0.13 | 0.05 | ||||
| Imp. A | Mean | 2.548 | 41 798 | - | 2247 | 1.46 |
| RSD % | 0.17 | 1.3 | ||||
| Imp. B | Mean | 13.735 | 47 993 | 4.35 | 4870 | 1.13 |
| RSD % | 0.17 | 1.82 | ||||
| Imp. C | Mean | 9.609 | 50 649 | 11.72 | 3840 | 1.16 |
| RSD % | 0.15 | 1.75 | ||||
| Imp. D | Mean | 10.771 | 67 162 | 1.94 | 5623 | 1.03 |
| RSD % | 0.06 | 0.65 | ||||
| Imp. E | Mean | 2.207 | 17 976 | - | 1159 | 1.03 |
| RSD % | 0.22 | 0.81 | ||||
Note: tR=Retention time; S=Peak area; Rs=Resolution; N=Number of theoretical plates; Tf=Tailing factor and RSD=Relative standard deviation
Table 1: System Suitability on the Optimal HPLC Condition (N=6)
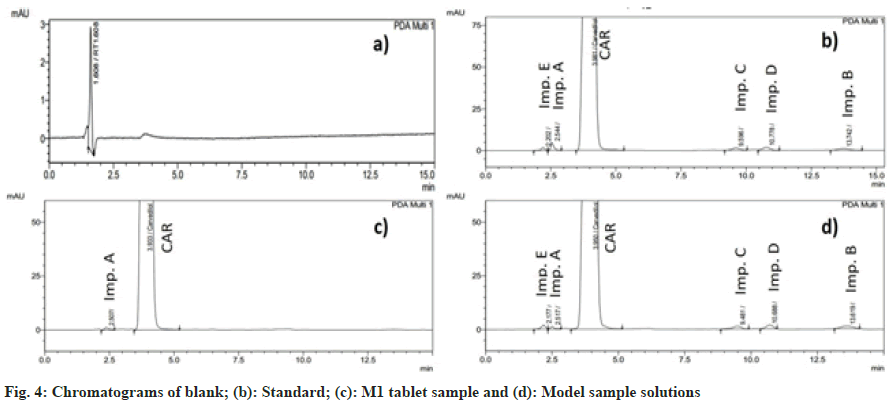
By visual inspection of the chromatogram, no interference was found in the retention time of carvedilol and its impurities in the blank solution (fig. 4). In addition, the peak purity index of the standard solution and the model sample solution were both greater than 0.999, indicating that the method has high specificity[25].
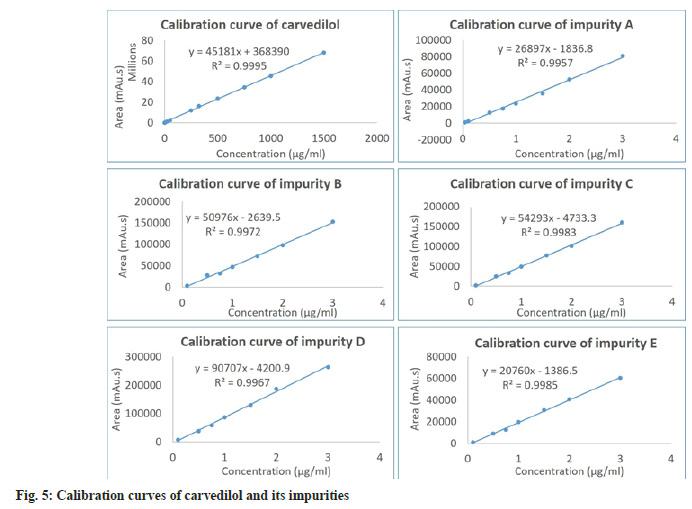
The result of the linearity test in Table 2 and fig. 5 showed that the concentration was directly proportional to the peak area in the concentration range of 0.01-1500 μg/ml for carvedilol, 0.04–3.0 μg/ ml for impurity A and 0.1-3.0 μg/ml for impurities B, C, D, E. The correlation coefficients (r2) of analytes were achieved to be >0.995, indicating that the proposed method was linear.
| Parameter | Carvedilol | Imp.A | Imp.B | Imp.C | Imp.D | Imp.E | |||||||
|---|---|---|---|---|---|---|---|---|---|---|---|---|---|
| Linearity | |||||||||||||
| Range (µg/ml) | 0.01-1500 | 0.04–3 | 0.1–3 | 0.1–3 | 0.1-3 | 0.1-3 | |||||||
| r2 | 0.9995 | 0.9957 | 0.9972 | 0.9983 | 0.9967 | 0.9985 | |||||||
| Slope±SD (a) | 45181±334 | 26897±721 | 50976±1198 | 54293±1001 | 90707±2348 | 20760±359 | |||||||
| Intercept±SD (b) | 368390±207377 | -1837±1054 | -2639.5±1871 | -4733.3±1564 | -4200.9±3666 | -1386.5±560 | |||||||
| Fstatistic | 18267.9 | 1390.8 | 1811.1 | 2939.5 | 1492.8 | 3349.4 | |||||||
| Fcritical | 5.1174 | 5.9874 | 6.6079 | 6.6079 | 6.6079 | 6.6079 | |||||||
| Precision | |||||||||||||
| Intra-day | |||||||||||||
| Samplea | |||||||||||||
| Mean (%)b | 99.86 | 0.087 | |||||||||||
| SD | 1.029 | 0.003 | |||||||||||
| RSD % | 1.03 | 3.12 | |||||||||||
| Model sample | |||||||||||||
| Mean (%)b | 99.89 | 0.086 | 0.205 | 0.187 | 0.213 | 0.104 | |||||||
| SD | 1.126 | 0.002 | 0.002 | 0.004 | 0.002 | 0.002 | |||||||
| RSD % | 1.13 | 2.58 | 1 | 1.9 | 1.12 | 2.04 | |||||||
| Inter-day | |||||||||||||
| Samplea |
|||||||||||||
| Mean (%)b | 100.24 | 0.086 | |||||||||||
| SD | 0.313 | 0.002 | |||||||||||
| RSD % | 0.31 | 2.75 | |||||||||||
| Model sample | |||||||||||||
| Mean (%)b | 100.18 | 0.085 | 0.195 | 0.179 | 0.206 | 0.115 | |||||||
| SD | 0.468 | 0.002 | 0.003 | 0.004 | 0.002 | 0.002 | |||||||
| RSD % | 0.47 | 2.33 | 1.39 | 2.03 | 0.92 | 1.72 | |||||||
| Accuracy | |||||||||||||
| % recoveryc | 100.38 | 99.92 | 100.16 | 100.3 | 99.95 | 100.3 | |||||||
| RSD % | 1.04 | 1.69 | 1.16 | 0.89 | 0.86 | 1.37 | |||||||
| LOD (µg/ml) | 0.003 | 0.013 | 0.033 | 0.033 | 0.033 | 0.033 | |||||||
| LOQ (µg/ml) | 0.01 | 0.04 | 0.1 | 0.1 | 0.1 | 0.1 | |||||||
| Robustnessd | |||||||||||||
| Wavelength 222/242 nm (+2 nm) | 1.04 | 1.86 | 0.68 | 1.45 | 1.22 | 2.11 | |||||||
| Wavelength 218/238 nm (-2 nm) | 0.73 | 1.17 | 0.83 | 0.96 | 0.77 | 2.35 | |||||||
| Column temperature 44° (+4°) | 1.15 | 0.94 | 1.12 | 2.1 | 0.5 | 1.48 | |||||||
| Column temperature 36° (-4°) | 1.43 | 1.55 | 0.93 | 1.17 | 0.33 | 1.54 | |||||||
| pH of mobile phase 2.1 (+0.1 unit) | 0.8 | 1.37 | 0.95 | 1.69 | 1.11 | 1.38 | |||||||
| pH of mobile phase 1.9 (-0.1 unit) | 0.88 | 0.99 | 1.66 | 1.3 | 1.04 | 2.04 | |||||||
Note: Regression equation: y=ax+b; where “y”=corrected peak area (MA U.S) and “x”=concentration in µg/ml. aImp B, C, D, E not detected in sample; bn=6; cn=9 and dExpressed as precision (RSD %) on model sample solutions, n=3 in each case
Table 2: Summary of Validation Results
The data obtained from precision on sample and model sample solutions are given in Table 2. The RSD values of carvedilol content for intra-day and inter-day precision were <2.0 %. The percentages of relative impurities were <5.3 %, compatible with the required threshold for samples with a concentration of <0.01 %, according to Huber et al.[28], demonstrating that the method is sufficiently precise.
The results of the accuracy test shown in Table 2 that the average percentage recovery of carvedilol content and relative impurities ranged from 99.92 % to 100.38 % at three concentration levels with RSD of 0.86 %-1.69 %, which suggest that the method obtained a high accuracy.
The data obtained from LOD and LOQ experiments showed that the method was highly sensitive and suitable for the simultaneous determination of carvedilol and its impurities (Table 2). The LOD and LOQ of impurities A, B, C, D and E were in the range of 0.015-0.083 μg/ml and 0.05-0.25 μg/ ml, respectively. The precision and accuracy at the LOQ level of impurities were in the range of 2.43 %-3.11 % and 99.61 %-100.66 %, respectively. These results indicated that the developed method was more sensitive than the previous study of Rao et al., in which the LOD and LOQ were greater than 1.41 and 4.27 μg/ml, respectively[27].
The robustness of the method after applying deliberate changes in wavelength, column temperature and pH of mobile phase were reported in Table 2. The results indicated that these changes did not affect the precision of the method with an RSD value not exceeding 2.35 %. Therefore, the method was found to be robust to the variability of application conditions.
The experimental data of solution stability showed that there was no additional peak in the chromatogram and no significant change was observed in the content of carvedilol and its impurities through 48 h at room temperature. Hence, the solution was stable for at least 48 h at room temperature and suitable for the analysis.
The validated method was applied to determine six commercial tablets containing 6.25 or 12.5 mg carvedilol. The result showed that impurity A was detected in five samples and its concentration was in the range of LOD to 0.187 %, while the contents of impurities B, C, D and E were all less than LOD (Table 3). According to USP 41 standard[16], all six preparations meet the allowable limit requirements for carvedilol related compounds.
| Sample | Content (%) | |||||
|---|---|---|---|---|---|---|
| Carvedilol | Imp. A | Imp. B | Imp. C | Imp. D | Imp. E | |
| M1 | 100.24 | 0.086 | - | - | - | - |
| M2 | 101.42 | 0.187 | - | - | - | - |
| M3 | 100.99 | + | - | - | - | - |
| M4 | 99.46 | + | - | - | - | - |
| M5 | 100.56 | - | - | - | - | - |
| M6 | 99.94 | 0.059 | - | - | - | - |
Note: (-) Less than LOD and (+) Less than LOQ
Table 3: Composition of Commercial Tablets of Carvedilol
Conflict of interests:
The authors declared no conflict of interests.
References
- Bari SB, Kadam BR, Jaiswal YS, Shirkhedkar AA. Impurity profile: Significance in active pharmaceutical ingredient. Eurasian J Anal Chem 2007;2(1):32-53.
- Görög S. Identification and determination of impurities in drugs. Elsevier; 2000.
- de Mey C, Breithaupt K, Schloos J, Neugebauer G, Palm D, Belz GG. Dose-effect and pharmacokinetic-pharmacodynamic relationships of the β1adrenergic receptor blocking properties of various doses of carvedilol in healthy humans. Clin Pharmacol Ther 1994;55(3):329-37.
[Crossref] [Google Scholar] [PubMed]
- Ruffolo RR, Gellai M, Hieble JP, Willette RN, Nichols AJ. The pharmacology of carvedilol. Eur J Clin Pharmacol 1990;38(2):S82-8.
[Crossref] [Google Scholar] [PubMed]
- Shah R, Patel S, Patel H, Pandey S, Shah S, Shah D. Development and validation of dissolution method for carvedilol compression-coated tablets. Braz J Pharm Sci 2011;47:899-906.
- Nichols AJ, Gellai M, Ruffolo Jr RR. Studies on the mechanism of arterial vasodilation produced by the novel antihypertensive agent, carvedilol. Fundam Clin Pharmacol 1991;5(1):25-38.
[Crossref] [Google Scholar] [PubMed]
- Poole-Wilson PA, Swedberg K, Cleland JG, Di Lenarda A, Hanrath P, Komajda M, et al. Comparison of carvedilol and metoprolol on clinical outcomes in patients with chronic heart failure in the Carvedilol or Metoprolol European Trial (COMET): Randomised controlled trial. Lancet 2003;362(9377):7-13.
[Crossref] [Google Scholar] [PubMed]
- Frishman WH. Carvedilol. New Engl J Med 1998;339(24):1759-65.
- Kumar KS, Reddy KT, Omprakash G, Dubey PK. Synthesis and characterization of potential impurities in key intermediates of carvedilol: A β-adrenergic receptor. J Chem Pharm Res 2011;3(6):33-45.
- Convention UP. Safety data sheet: Carvedilol Related Compound A; 2007.
- Safety data sheet: Carvedilol impurity C; 2018.
- Safety data sheet: Carvedilol Biscarbazole. LGC Limited; 2020.
- Safety data sheet: Carvedilol Related Compound D. Sigma-Aldrich Pte Ltd; 2019.
- Srinivasa Rao M, Rao SV, Ray UK, Siva Kumar GS, Sharma HK. Quantification of 4-Oxiranyl methoxy-9H-carbazole a genotoxic impurity in carvedilol drug substances by LC-MS. J Bioanal Biomed 2010;2:91-5.
- Müller L, Mauthe RJ, Riley CM, Andino MM, de Antonis D, Beels C, et al. A rationale for determining, testing and controlling specific impurities in pharmaceuticals that possess potential for genotoxicity. Regu Toxicol Pharmacol 200;44(3):198-211.
[Crossref] [Google Scholar] [PubMed]
- Convention UP. The United States Pharmacopeia 41. 41st ed. Carvedilol, Carvedilol tablets. 2018:729-33.
- Kang TC, Gu X, He JJ, Zheng GG, Zheng JQ. Determination of impurities D and E of carvedilol tablets by RP-HPLC. Chin J Pharm Anal 2015;35(10):1838-42.
- British pharmacopoeia 2018: Carvedilol, Carvedilol tablets. The Stationery Office: London (UK); 2018.
- Gannu R, Yamsani VV, Rao YM. New RP-HPLC method with UV-detection for the determination of carvedilol in human serum. J Liquid chromatogr Related Technol 2007;30(11):1677-85.
- Patel LJ, Suhagia BN, Shah PB, Shah RR. RP-HPLC and HPTLC methods for the estimation of carvedilol in bulk drug and pharmaceutical formulations. Indian J Pharm Sci 2006;68(6):790.
- Kim SH, Lee SH, Lee HJ. Rapid and sensitive carvedilol assay in human plasma using a high-performance liquid chromatography with mass/mass spectrometer detection employed for a bioequivalence study. Am J Anal Chem 2010;1(3):135-43.
- Ahmed S, Khan A, Sheraz MA, Bano R, Ahmad I. Development and validation of a stability-indicating HPLC method for the assay of carvedilol in pure and tablet dosage forms. Curr Pharm Anal 2018;14(2):139-52.
- Mahajan N, Deshmukh S, Farooqui M. Analytical method development and validation for known and unknown impurities profiling for carvedilol pharmaceutical dosage form (tablets). Int J Curr Pharm Res 2021;13(6):71-80.
[Crossref]
- Yilmaz B, Arslan S. Determination of carvedilol in human plasma by gas chromatography-mass spectrometry method. J Chromatographic Sci 2011;49(1):35-9.
- Guideline IH. Validation of analytical procedures: Text and methodology. Q2 (R1). 2005;1(20):5.
- Raju TR. Development and validation of stability-indicating impurity profiling method for the carvedilol in API and pharmaceutical formulation. Int J Pharmacol 2015;2(6):22-31.
- L. Rao, P. Madhavan, Prakash KV. Development and validation of stability indicating method for the quantitative determination of carvedilol and its related impurities in pharmaceutical dosage forms using RP HPLC. J Chem Pharm Res 2015;7(9):144-54.
- Huber L. Validation and qualification in analytical laboratories. 2nd ed. Informa Healthcare, New York; 2007.
