- *Corresponding Author:
- S. Bozhanov
Department of Chemistry, Faculty of Pharmacy, Medical University of Sofia, Sofia 1000, Bulgaria
E-mail: bozhanov.stanislav@gmail.com
| Date of Received | 08 November 2021 |
| Date of Revision | 09 June 2022 |
| Date of Acceptance | 30 December 2022 |
| Indian J Pharm Sci 2022;84(6):1506-1513 |
This is an open access article distributed under the terms of the Creative Commons Attribution-NonCommercial-ShareAlike 3.0 License, which allows others to remix, tweak, and build upon the work non-commercially, as long as the author is credited and the new creations are licensed under the identical terms
Abstract
Due to their anti-inflammatory and antioxidant properties, pentoxifylline and melatonin have been considered by many authors as potential adjuvants in coronavirus disease infection. The present study describes the development of a high performance liquid chromatography method with ultraviolet detection for the simultaneous determination of pentoxifylline and melatonin in spiked plasma samples. The chromatographic separation was performed isocratically at a temperature of 25°, using a LiChrosorb® reverse phase-18 (125×4.0 mm, 5 μm) as stationary phase. The mobile phase consists of water and acetonitrile in a ratio of 80:20 v/v. Under optimal chromatographic conditions, for both pentoxifylline and melatonin, the number of theoretical plates was >2000, peak asymmetry was <1.3 and resolution factors were >2. The relative standard deviations for pentoxifylline and melatonin for both intra-day and interday not exceeded 4 % and recoveries were in the ranges 99.46 %-102.51 % for pentoxifylline and 96.02 %-102.85 % for melatonin.
Keywords
Pentoxifylline, melatonin, coronavirus disease-19, spiked plasma samples, high performance liquid chromatography
Coronavirus infection has radically changed a person’s life worldwide. There are currently several approved vaccines and many others are in various stages of development and research[1]. Undoubtedly, vaccines will play an important role in disease control. However, it seems that the world is far from dealing with this problem. It takes time and the virus continues to spread and the consequences are serious-health, social and economic.
An alternative that allows for rapid prevention and treatment of the disease is the use of existing, approved drugs. Applying such an approach can help to suppress the symptoms of newly infected people, limit their ability to transmit the virus, as well as to prevent them from developing a severe or even critical manifestation of the disease.
Many drugs have been described in the literature, such as antioxidants[2-4], plants and herbal medicines[5,6], traditional Chinese medicine formulations[7] and antimicrobial peptides[8,9], which would have a beneficial effect on the course of the disease. These include the long-known and well-studied Pentoxifylline (PTX) and Melatonin (MLT). PTX (chemically known as 3,7-dimethyl- 1-(5-oxohexyl)-2,3,6,7-tetrahydro-1H-purine-2,6- dione), is a xanthine derivative with favorable anti-inflammatory effects and immunoregulatory properties and MLT (N-[2-(5-methoxy-1H-indol- 3-yl)ethyl]acetamide) is an indole derivative that regulates circadian rhythms, has pronounced antioxidant properties and interacts with the immune system. Given the properties of both drugs, as well as the clinical picture of Coronavirus Disease-19 (COVID-19), many authors consider PTX[10-17] and MLT[18-25] as potential adjuvant therapy drugs.
There are also clinical studies on the effect of MLT[26] and PTX in combination with antioxidants (including MLT)[27] in patients with COVID-19.
The availability of effective methods of analysis is extremely important, both in terms of quality control and in terms of drug monitoring. Different methods for PTX and MLT determination were reported. For example, PTX and MLT were determined in biological samples by High Performance Liquid Chromatography (HPLC)[28-31], Liquid Chromatography–Mass Spectrometry (LC-MS)[32,33] and electrochemical methods[34-37]. For analysis of both drugs in pharmaceutical formulations HPLC[38-41], Thin-Layer Chromatography (TLC)[42,43], spectral[44-47] and electrochemical[34,36,37,48] methods were used.
The beneficial properties of both drugs and the promising outcomes of a clinical trial[27], provoked our interest in developing an HPLC method for the simultaneous determination of PTX and MLT in spiked plasma samples. Moreover, there is no published method for the simultaneous determination of both drugs (to the best of our knowledge).
Materials and Methods
Chemicals and reagents:
The analytical standards of PTX, MLT and caffeine used as Internal Standard (IS) were purchased from Sigma-Aldrich. Control human plasma used to prepare standard calibration curves was provided by Sigma-Aldrich (catalog number P9523). Acetonitrile of HPLC quality used to prepare the mobile phase was purchased from Honeywell (Riedel-de Haen). Perchloric acid needed for plasma protein precipitation was also of HPLC grade.
Instrumentation and chromatographic conditions:
HPLC-diode array detection Thermo ScientificTM-DionexTM system UltiMateTM 3000 equipped with a pump module, auto sampler module, column thermostat and a diode array detector was used. ChromeleonTM software was used for data acquisition.
The chromatographic separation was performed in isocratic mode at a temperature of 25°, using a LiChrosorb® RP-18 (125×4.0 mm, 5 μm) chromatographic column, еquiped with a guard column. The mobile phase consisting of water and acetonitrile, in a ratio of 80:20 v/v, was filtered through a 0.45 μm membrane filter and sonicated for 10 min. The flow rate was set at 1.0 ml/min and the injection volume was 20 μl. The elute was monitored at 274 nm.
Preparation of PTX and MLT stock solution:
A mixed stock solution of PTX and MLT was prepared by dissolving appropriate amounts of the two substances in mobile phase water:acetonitrile (80:20 v/v) to obtain final drug concentrations of 480 μg/ml and 60 μg/ml, respectively for PTX and MLT.
Preparation of PTX and MLT working standard solutions:
Working standards were prepared by making suitable dilutions from stock solution with the same solvent. The obtained final working standard concentrations were 80, 160, 240, 320, 400, 480 μg/ml for PTX and 10, 20, 30, 40, 50, 60 μg/ml for MLT.
Preparation of the IS solution:
The stock solution of the IS (caffeine) was prepared by dissolving 24 mg of the substance in the mobile phase and the obtained concentration was 240 μg/ ml. Further dilution of the stock solution with the same solvent was performed to obtain a working solution at a concentration of 2.4 μg/ml used for the construction of the plasma calibration curve.
Preparation of spiked plasma samples:
PTX and MLT spiked blank plasma samples were used to prepare standard calibration curves. Sample preparation was performed as described elsewhere[49] with slight modification. A set of six standard curve solutions was prepared by spiking 100 μl of the working standard solutions to 900 μl blank plasma reaching plasma concentrations of 8-48 μg/ml and 1-6 μg/ml, respectively for PTX and MLT. Samples were vortex mixed for 1 min and 250 μl of each standard were added to 250 μl of the working IS solution (2.4 μg/ml). Plasma protein precipitation was performed by adding 100 μl of 20 % perchloric acid to the final plasma aliquot of 600 μl. Then samples were vortex mixed for 1 min and centrifuged for 5 min at 13 000 rpm. The supernatant was separated and 20 μl were injected for analysis into the HPLC system. To confirm the absence of additional effects of plasma components on PTX, MLT and IS retention times, blank plasma samples were prepared by replacing the IS working solution with the mobile phase.
Results and Discussion
Chromatographic conditions were selected after several experiments with different columns (C8 and C18) and mobile phases. Mobile phases consisting of acetonitrile:water, methanol:water, as well as combinations of acetonitrile:methanol:water in different ratios was tested. Acetonitrile:water (20:80 v/v) was chosen as the optimal mobile phase, which is easy to prepare and with a minimum content of organic solvent. Increasing the amount of organic phase led to a shortening of the retention time of the IS and to the impossibility of separating it from the components of the matrix. On the other hand, the mobile phase methanol:water gave wider peaks. The combination of acetonitrile:methanol:water resulted in unacceptably short retention times and poor separation of MLT from PTX.
In addition to caffeine, theophylline and theobromine were tested as ISs. In any case, their retention times were shorter than those of caffeine and their peaks overlapped with the plasma components. For this reason, they dropped out of further research.
The effect of temperature in the range of 25°-35° was studied and no significant effect on the retention time of the analyzed components was observed. However, to achieve reproducible retention times, studies were performed at a fixed temperature (25°) both on the auto sampler and column compartment.
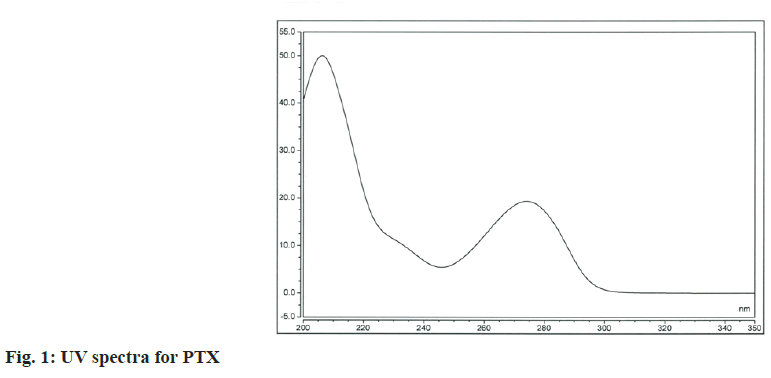
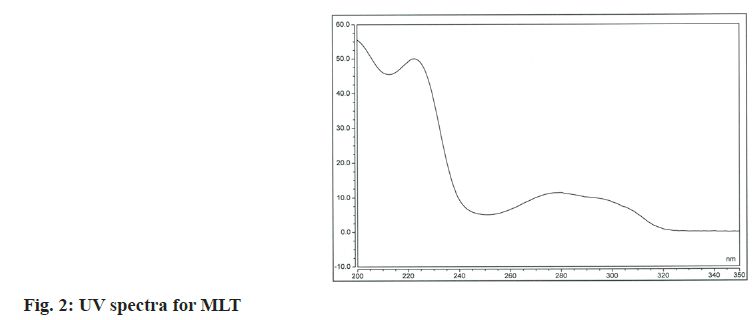
Various wavelengths were tried to analyze the drugs simultaneously for considerable sensitivity of the method based on the obtained spectra of the substances (fig. 1 and fig. 2). Although MLT has a pronounced absorption maximum at about 222 nm the absorbance was measured at 274 nm to minimize nonselective absorption at such lower wavelengths.
Thus, the best results in terms of separation, peak shape and run time were achieved with LiChrosorb® RP-18 (125×4.0 mm, 5 μm) chromatographic column and mobile phase water:acetonitrile (80:20 v/v) at a flow rate of 1.0 ml/min; at 25° and wavelength of 274 nm. The achieved retention times were 2.69 min for caffeine (IS), 5.34 min for PTX and 11.08 min for MLT.
The retention time of PTX was shorter in comparison to those, reported in some previously published papers, applying C18 columns and mobile phases containing water:acetonitrile:dioxane[28], and methanol:acetonitrile:phosphate buffer[29]. On the other hand, the reached retention time of MLT was longer and shorter respectively than reported in methods[30,31], which used phosphate buffer and acetonitrile in similar proportions, as a mobile phase. However, the above examples relate to the determination of a single component and not to the simultaneous determination of PTX and MLT.
The developed chromatographic method was validated according to international conference on harmonisation guidelines[50] in terms of selectivity, linearity, accuracy, precision and limits of determination and quantification.
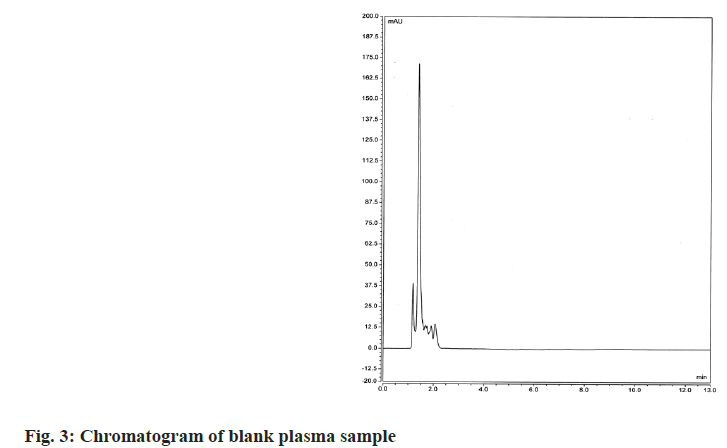
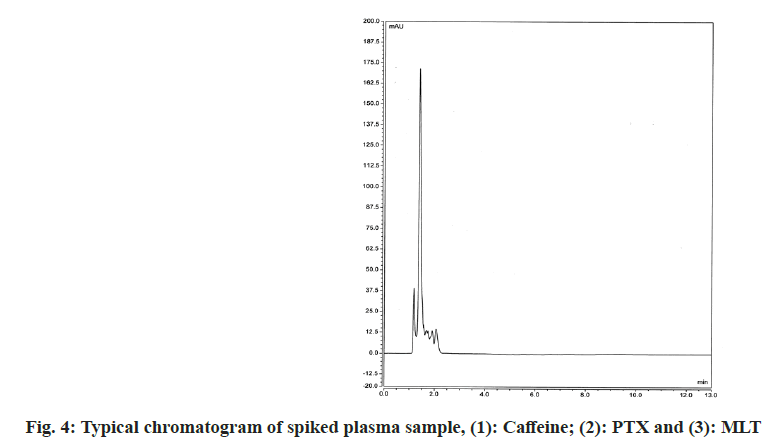
The proposed method was confirmed for its selectivity by good separation of the IS and both studied drugs. Selectivity was also examined by comparing chromatograms obtained after analyzing drug-free blank plasma samples and spiked with caffeine (IS), PTX and MLT plasma samples. As can be seen in fig. 3 and fig. 4 there are no interferences from plasma components on the retention times of the studied compounds. All drugs were well separated and under optimal chromatographic conditions, for both PTX and MLT, the number of theoretical plates was >2000, peak asymmetry was <1.4 and resolution factors were >2. The detailed results of the system suitability parameters are given in Table 1.
| Parameter | Acceptance criteria | PTX | MLT |
|---|---|---|---|
| Retention time (min) | - | 5.34 | 11.08 |
| Ph. Eur. Theoretical plates | NLT 2000 | 2543 | 2604 |
| Ph. Eur. Asymmetry | NMT 2.0 | 1.32 | 1.27 |
| Ph. Eur. Resolution | NLT 2.0 | 6.06 | 5.42 |
Note: Ph. Eur.: European Pharmacopoeia; NLT: Not Less Than and NMT: Not More Than
Table 1: System Suitability Parameters
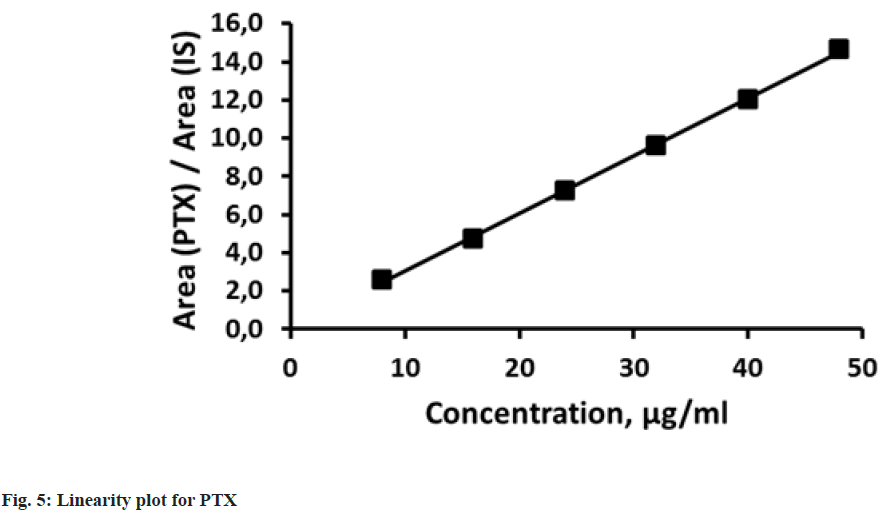
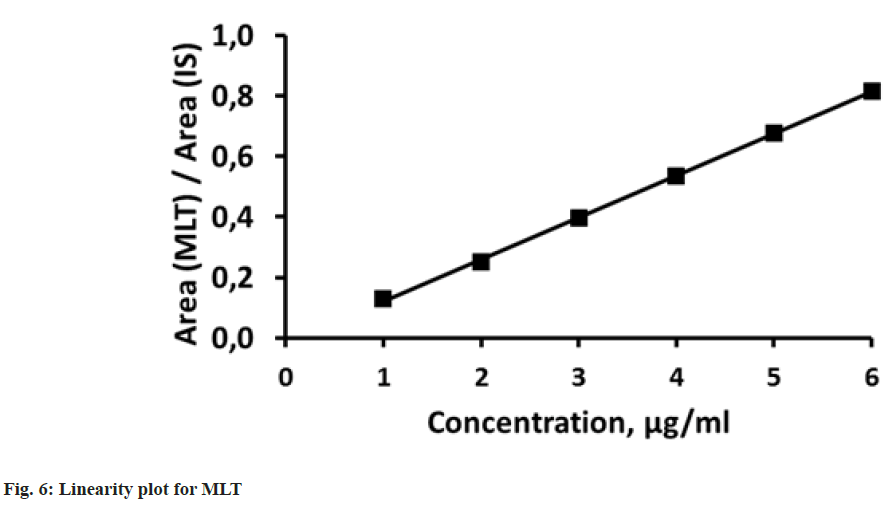
Linearity was estimated by the ability of method to give proportional to the concentration results for both analytes. Six calibration standards were used in the linearity studies. Concentrations for PTX and MLT were 8-48 μg/ml and 1-6 μg/ml, respectively. Each standard solution was injected three times and the mean results for peak area ratios of PTX to IS and MLT to IS were plotted against the concentration of PTX or MLT to obtain the calibration graph (fig. 5 and fig. 6). Proportional responses were observed over the tested concentration ranges with correlation coefficients greater than 0.999. The results from linearity study about parameters like correlation coefficients (R2), slopes and intercepts are listed in Table 2.
| Parameter | PTX | MLT |
|---|---|---|
| Concentration range (µg/ml) | 8-48 | 1-6 |
| Slope | 0.3021 | 0.1385 |
| Intercept | 0.0172 | -0.0177 |
| Correlation coefficient | 0.9993 | 0.9996 |
Table 2: Linearity Data for PTX and MLT
Accuracy tests of the method aim to show the proximity of the true value and found value. Three concentration levels with known added amount of analytes were evaluated and the percentage recoveries were calculated. The selected concentration levels were 12:1.5, 28:3.5 and 44:5.5 μg/ml for PTX and MLT, respectively. After a five time’s injection of each spiked plasma sample, the results showed recoveries in the range from 96 % to 103 %. The data is arranged in Table 3 and Table 4. The Relative Standard Deviation (RSD) for PTX and MLT for both intra-day and inter-day not exceeded 4 % and recoveries were in the ranges 99.46 %-102.51 % for PTX and 96.02 %-102.85 % for MLT.
| Concentration (µg/ml) | Intra-day | Inter-day | ||||||
|---|---|---|---|---|---|---|---|---|
| Mean (µg/ml) | SD (µg/ml) | RSD (%) | Recovery (%) | Mean (µg/ml) | SD (µg/ml) | RSD (%) | Recovery (%) | |
| 12 | 12.17 | 0.29 | 2.37 | 101.42 | 11.99 | 0.05 | 0.41 | 99.93 |
| 28 | 27.85 | 0.35 | 1.24 | 99.46 | 27.98 | 0.13 | 0.45 | 99.94 |
| 44 | 45.10 | 0.50 | 1.12 | 102.51 | 44.81 | 0.91 | 2.04 | 101.85 |
Note: SD: Standard Deviation; RSD: Relative Standard Deviation
Table 3: Accuracy Results for PTX (n=5)
| Concentration (µg/ml) | Intra-day | Inter-day | ||||||
|---|---|---|---|---|---|---|---|---|
| Mean (µg/ml) | SD (µg/ml) | RSD (%) | Recovery (%) | Mean (µg/ml) | SD (µg/ml) | RSD (%) | Recovery (%) | |
| 1.5 | 1.54 | 0.03 | 2.13 | 102.85 | 1.44 | 0.05 | 3.55 | 96.02 |
| 3.5 | 3.49 | 0.03 | 0.93 | 99.69 | 3.48 | 0.09 | 2.6 | 99.45 |
| 5.5 | 5.51 | 0.10 | 1.73 | 100.23 | 5.47 | 0.1 | 1.91 | 99.5 |
Note: SD: Standard Deviation; RSD: Relative Standard Deviation
Table 4: Accuracy Results for MLT (n=5)
Precision of the analytical method is established by series of measurements of the same homogeneous sample in the same conditions. Therefore, the closer the values of the results obtained, the more precise the method. Precision validation tests were developed by conducting six consecutive assays of the test sample containing PTX and MLT with concentrations 28 and 3.5 μg/ml, respectively. The RSD percentage of the assay was calculated and inter-day precision was evaluated by analyzing the six replicate of sample solution on a different day and by a different analyst. Results are united in Table 5.
| Sample No | PTX | MLT | ||||
|---|---|---|---|---|---|---|
| Drug taken (μg/ml) | Drug found (μg/ml) | Recovery (%) | Drug taken (μg/ml) | Drug found (μg/ml) | Recovery (%) | |
| 1 | 28.0 | 27.99 | 99.96 | 3.50 | 3.57 | 102 |
| 2 | 28.0 | 28.08 | 100.29 | 3.50 | 3.48 | 99.43 |
| 3 | 28.0 | 28.18 | 100.64 | 3.50 | 3.49 | 99.71 |
| 4 | 28.0 | 27.92 | 99.71 | 3.50 | 3.58 | 102.29 |
| 5 | 28.0 | 28.05 | 100.18 | 3.50 | 3.53 | 100.86 |
| 6 | 28.0 | 27.89 | 99.61 | 3.50 | 3.50 | 100.00 |
| Mean | 28.02 | 100.07 | 3.53 | 100.71 | ||
| SD | 0.11 | 0.38 | 0.04 | 1.21 | ||
| RSD (%) | 0.38 | 0.38 | 1.20 | 1.20 | ||
Note: SD: Standard Deviation; RSD: Relative Standard Deviation
Table 5: Precision Results for PTX and MLT (n=6)
Determining the two parameters Limit of Detection (LOD) and Limit of Quantification (LOQ) is a very important part of the method validation procedure. LOD gives the smallest measurable sample concentration and LOQ gives the smallest quantified sample concentration. Determining of these two parameters was based on signal to noise ratio of 3:1 and 10:1, respectively. The performed experiments showed LOD concentrations of 0.2 and 0.6 μg/ml and LOQ concentrations of 8.0 and 1.0 μg/ml for PTX and MLT, respectively.
A simple and precise isocratic HPLC method was developed for simultaneous determination of PTX and MLT in spiked plasma samples. Application of common equipment, simple mobile phase and relatively short run time can be assumed as advantages of the method. However, results cannot be compared, since there are no reported methods (according to the author’s knowledge) dealing with the simultaneous determination of both drugs in biological samples.
Acknowledgements
This work is supported by the Bulgarian Ministry of Education and Science under the National Program for Research “Young Scientists and Postdoctoral Students” 2021.
Conflict of interests:
The authors declared no conflict of interests.
References
- Craven J. COVID-19 vaccine tracker. Rockville: Regulatory Affairs Professionals Society; 2021.
- Soto ME, Guarner-Lans V, Soria-Castro E, Manzano Pech L, Pérez-Torres I. Is antioxidant therapy a useful complementary measure for Covid-19 treatment? An algorithm for its application. Medicina 2020;56(8):386.
[Crossref] [Google Scholar] [PubMed]
- Aisa-Alvarez A, Soto ME, Guarner-Lans V, Camarena-Alejo G, Franco-Granillo J, Martínez-Rodríguez EA, et al. Usefulness of antioxidants as adjuvant therapy for septic shock: A randomized clinical trial. Medicina 2020;56(11):619.
[Crossref] [Google Scholar] [PubMed]
- Diniz LR, Bezerra Filho CD, Fielding BC, de Sousa DP. Natural antioxidants: A review of studies on human and animal coronavirus. Oxid Med Cell Longev 2020;2020:3173281.
[Crossref] [Google Scholar] [PubMed]
- Silveira D, Prieto-Garcia JM, Boylan F, Estrada O, Fonseca-Bazzo YM, Jamal CM, et al. COVID-19: Is there evidence for the use of herbal medicines as adjuvant symptomatic therapy? Front Pharmacol 2020;11:1479.
[Crossref] [Google Scholar] [PubMed]
- Fuzimoto AD, Isidoro C. The antiviral and coronavirus-host protein pathways inhibiting properties of herbs and natural compounds-Additional weapons in the fight against the COVID-19 pandemic? J Tradit Complement Med 2020;10(4):405-19.
[Crossref] [Google Scholar] [PubMed]
- Peng Y, Tao H, Satyanarayanan SK, Jin K, Su H. A comprehensive summary of the knowledge on COVID-19 treatment. Aging Dis 2021;12(1):155-91.
[Crossref] [Google Scholar] [PubMed]
- Liscano Y, Oñate-Garzón J, Ocampo-Ibáñez ID. In silico discovery of antimicrobial peptides as an alternative to control SARS-CoV-2. Molecules 2020;25(23):5535.
[Crossref] [Google Scholar] [PubMed]
- Bansal R, Mohagaonkar S, Sen A, Khanam U, Rathi B. In silico study of peptide-protein interaction of antimicrobial peptides potentially targeting SARS and SARS-CoV-2 nucleocapsid protein. In Silico Pharmacol 2021;9(1):1-4.
- Assimakopoulos SF, Seintis F, Marangos M. Pentoxifylline and complicated COVID-19: A pathophysiologically based treatment proposal. Med Hypotheses 2020;143:109926.
[Crossref] [Google Scholar] [PubMed]
- Feily A, Daneshpay K, Alighadr A. COVID-19: Pentoxifylline as a potential adjuvant treatment. Int J Clin Pharmacol Ther 2020;58(07):406-7.
[Crossref] [Google Scholar] [PubMed]
- Seirafianpour F, Mozafarpoor S, Fattahi N, Sadeghzadeh-Bazargan A, Hanifiha M, Goodarzi A. Treatment of COVID-19 with pentoxifylline: Could it be a potential adjuvant therapy? Dermatol Ther 2020;33(4):e13733.
[Crossref] [Google Scholar] [PubMed]
- Dhameliya H, Thakkar V, Trivedi G, Mesara S, Subramanian R. Pentoxifylline: An immunomodulatory drug for the treatment of COVID-19. J Pure Appl Microbiol 2020;14(1):861-7.
- Monji F, Siddiquee AA, Hashemian F. Can pentoxifylline and similar xanthine derivatives find a niche in COVID-19 therapeutic strategies? A ray of hope in the midst of the pandemic. Eur J Pharmacol 2020;887:173561.
[Crossref] [Google Scholar] [PubMed]
- Hendry BM, Stafford N, Arnold AD, Sangwaiya A, Manglam V, Rosen SD, et al. Hypothesis: Pentoxifylline is a potential cytokine modulator therapeutic in COVID-19 patients. Pharmacol Res Perspect 2020;8(4):e00631.
- Ghasemnejad-Berenji M, Pashapour S, Sadeghpour S. Pentoxifylline: A drug with antiviral and anti-inflammatory effects to be considered in the treatment of coronavirus disease 2019. Med Princ Pract 2021;30(1):98-100.
[Crossref] [Google Scholar] [PubMed]
- Ramonfaur D, González-Assad CA, Paredes-Vázquez JG. Pentoxifylline and Covid-19: A systematic review. Internet J Infect Dis 2020;18(1):1-6.
- Shneider A, Kudriavtsev A, Vakhrusheva A. Can melatonin reduce the severity of COVID-19 pandemic? Int Rev Immunol 2020;39(4):153-62.
[Crossref] [Google Scholar] [PubMed]
- Cardinali DP, Brown GM, Pandi-Perumal SR. Can melatonin be a potential “silver bullet” in treating COVID-19 patients? Dis 2020;8(4):44.
[Crossref] [Google Scholar] [PubMed]
- Reiter RJ, Abreu-Gonzalez P, Marik PE, Dominguez-Rodriguez A. Therapeutic algorithm for use of melatonin in patients with COVID-19. Front Med 2020:226.
[Crossref] [Google Scholar] [PubMed]
- Parlakpinar H, Polat S, Acet HA. Pharmacological agents under investigation in the treatment of coronavirus disease 2019 and the importance of melatonin. Fundamen Clin Pharmacol 2021;35(1):62-75.
[Crossref] [Google Scholar] [PubMed]
- Pandi Perumal SR, Cardinali DP, Reiter R, Brown GM. Low melatonin as a contributor to SARS-CoV-2 disease. Melatonin Res 2020;3(4):558-76.
- Simko F, Hrenak J, Dominguez-Rodriguez A, Reiter RJ. Melatonin as a putative protection against myocardial injury in COVID-19 infection. Exp Rev Clin Pharmacol 2020;13(9):921-4.
[Crossref] [Google Scholar] [PubMed]
- Anderson G, Reiter RJ. Melatonin: Roles in influenza, Covid-19 and other viral infections. Rev Med Virol 2020;30(3):e2109.
[Crossref] [Google Scholar] [PubMed]
- Castillo RR, Quizon GR, Juco MJ, Roman AD, de Leon DG, Punzalan FE, et al. Melatonin as adjuvant treatment for coronavirus disease 2019 pneumonia patients requiring hospitalization (MAC-19 PRO): A case series. Melatonin Res 2020;3(3):297-310.
- Vlachou M, Siamidi A, Dedeloudi A, Konstantinidou SK, Papanastasiou IP. Pineal hormone melatonin as an adjuvant treatment for COVID-19. Int J Mol Med 2021;47(4):47.
[Crossref] [Google Scholar] [PubMed]
- Chavarría AP, Vázquez RR, Cherit JG, Bello HH, Suastegui HC, Moreno-Castañeda L, et al. Antioxidants and pentoxifylline as coadjuvant measures to standard therapy to improve prognosis of patients with pneumonia by COVID-19. Comput Struct Biotechnol J 2021;19:1379-90.
[Crossref] [Google Scholar] [PubMed]
- Mancinelli A, Pace S, Marzo A, Martelli EA, Passetti G. Determination of pentoxifylline and its metabolites in human plasma by high-performance liquid chromatography with solid-phase extraction. J Chromatogr 1992;575(1):101-7.
[Crossref] [Google Scholar] [PubMed]
- Sripalakit P, Saraphanchotiwitthaya A. Validation of an HPLC method for determination of pentoxifylline in human plasma and its application to pharmacokinetic study. J AOAC Int 2009;92(3):837-45.
- Jenjirattithigarn N, Phunikom K, Kongpan T, Kanjanawart S, Johns JR, Tassaneeyakul W. Determination of melatonin in plasma by liquid-liquid extraction and high performance liquid chromatography coupled with fluorescence detection and its application for melatonin pharmacokinetic study in humans. Thai J Pharmacol 2014;36(2):5-18.
- Römsing S, Ulfberg J, Bergqvist Y. Determination of melatonin in human plasma with solid-phase extraction, high-performance liquid chromatography and fluorescence detection. Scand J Clin Lab Invest 2003;63(1):81-8.
[Crossref] [Google Scholar] [PubMed]
- Dodda S, Makula A, Polagani SR, Kandhagatla RN. Development and validation of bioanalytical liquid chromatography–tandem mass spectrometry method for the estimation of pentoxifylline in human plasma: Application for a comparative pharmacokinetic study. Eur J Mass Spectrometry 2019;25(4):372-80.
[Crossref] [Google Scholar] [PubMed]
- van Faassen M, Bischoff R, Kema IP. Relationship between plasma and salivary melatonin and cortisol investigated by LC-MS/MS. Clin Chem Lab Med 2017;55(9):1340-8.
[Crossref] [Google Scholar] [PubMed]
- Meenakshi S, Pandian K, Gopinath SC. Quantitative simultaneous determination of pentoxifylline and paracetamol in drug and biological samples at graphene nanoflakes modified electrode. J Taiwan Inst Chem Eng 2020;107:15-23.
- Alarfaj N, El-Tohamy M. New validated potentiometric determination of vasodilator pentoxifylline in its pharmaceutical formulations and biological fluids. J Chin Chem Soc 2011;58(5):637-44.
- Apetrei IM, Apetrei C. Voltammetric determination of melatonin using a graphene-based sensor in pharmaceutical products. Int J Nanomed 2016;11:1859-66.
[Crossref] [Google Scholar] [PubMed]
- Levent A. Electrochemical determination of melatonin hormone using a boron-doped diamond electrode. Diam Relat Mater 2012;21:114-9.
- Korany MA, Haggag RS, Ragab MA, Elmallah OA. A validated stability indicating DAD–HPLC method for determination of pentoxifylline in presence of its pharmacopeial related substances. Bull Fac Pharm Cairo Univ 2013;51(2):211-9.
- Lahsini R, Monser L. Optimization and validation of a new HPLC method using monolithic column for simultaneous determination of pentoxifylline and related compounds. Pharm Chem J 2012;46(2):127-31.
- Sattar A, Suneetha A. A validated RP-HPLC method for the determination of melatonin and zolpidem tartarate in bulk and pharmaceutical dosage forms. Int Res J Pharm 2018;9(3):90-6.
- Lin J, Zhang C, Gao Y, Zhao X, Li X. A validated HPLC method for determining melatonin in capsule dosage form. Spatula DD 2012;2(3):147-51.
- Jeswani RM, Sinha PK, Topagi KS, Damle MC. A validated stability indicating HPTLC method for determination of pentoxifylline in bulk and pharmaceutical formulation. Res J Pharm Tech 2009;2(3):527-30.
- Agarwal SP, Gonsalves HJ, Khar RK. HPTLC method for the analysis of melatonin in bulk and pharmaceutical formulations. Asian J Chem 2008;20(4):2531-8.
- Mahmoud AM, AlQahtani SA. Spectrophotometric study for the reaction of pentoxifylline hydrochloride with 1,2-naphthoquinone-4-sulphonate: Kinetics, mechanism and application for development of high-throughput kinetic microwell assay for pentoxifylline in quality control laboratory. Am J Anal Chem 2016;7(2):179-91.
- El Dawya MA, Mabrouk MM, El Barbary RA. Spectrofluorimetric determination of drugs containing active methylene group using N1-methyl nicotinamide chloride as a fluorigenic agent. Chem Pharm Bull 2006;54(7):1026-9.
[Crossref] [Google Scholar] [PubMed]
- Darwish HW, Attia MI, Zlotos DP. New spectrofluorimetric methods for determination of melatonin in the presence of N-{2-[1-({3-[2-(acetylamino) ethyl]-5-methoxy-1H-indol-2-yl} methyl)-5-methoxy-1H-indol-3-yl]-ethyl} acetamide: A contaminant in commercial melatonin preparations. Chem Cent J 2012;6(1):1-1.
[Crossref] [Google Scholar] [PubMed]
- Bhusnure OG, Gandge NV, Gholve SB, Birajdar MJ, Giram PS. First order derivative spectrophotometric method for estimation of melatonin in bulk and pharmaceutical dosage form. Int J Pharm Pharm Res 2017;10(1):55-62.
- Abbar JC, Malode SJ, Nandibewoor ST. Electrochemical determination of a hemorheologic drug, pentoxifylline at a multi-walled carbon nanotube paste electrode. Bioelectrochemistry 2012;83:1-7.
[Crossref] [Google Scholar] [PubMed]
- Schreiber-Deturmeny E, Bruguerolle B. Simultaneous high-performance liquid chromatographic determination of caffeine and theophylline for routine drug monitoring in human plasma. J Chromatogr B Biom Sci Appl 1996;677(2):305-12.
[Crossref] [Google Scholar] [PubMed]
- International Conference on Harmonisation of Technical Requirements for Registration of Pharmaceuticals for Human Use, ICH Harmonized Tripartite Guideline, Validation of Analytical Procedures: Text and Methodology Q2 (R1); 2005.
