- *Corresponding Author:
- Leena Sawaikar
Department of Pharmaceutical Chemistry, PES’s Rajaram and Tarabai Bandekar College of Pharmacy, Farmagudi, Goa 403401, India
E-mail: sawaikarleena@gmail.com
| Date of Received | 17 April 2023 |
| Date of Revision | 11 Jul 2023 |
| Date of Acceptance | 22 May 2024 |
| Indian J Pharm Sci Indian J Pharm Sci 2024;86(3):896-903 |
This is an open access article distributed under the terms of the Creative Commons Attribution-NonCommercial-ShareAlike 3.0 License, which allows others to remix, tweak, and build upon the work non-commercially, as long as the author is credited and the new creations are licensed under the identical terms
Abstract
Two simple and rapid ultraviolet spectrophotometric methods were developed to estimate indapamide and atenolol in marketed tablet formulation. These ultraviolet methods are simple, economical and less time consuming as compared to other instrumental methods. The developed methods included the simultaneous equations method and absorbance ratio method. Methanol was used as a dissolving solvent and distilled water was used as a diluent. For the simultaneous equations method, the wavelengths selected were 241 nm (λmax of indapamide) and 224.4 nm (λmax of atenolol) and for absorbance ratio method, the two wavelengths selected were 233.8 nm (isosbestic point) and 224.4 nm (λmax of atenolol). In both approaches, the linearity was proven over concentration ranges of 2-20 μg/ml for indapamide and 10-80 μg/ml for atenolol. The percentage purity in the marketed formulation was found to be 99.79 % for indapamide and 98.57 % for atenolol by simultaneous equations method and 99.56 % for indapamide and 100.0 % for atenolol by absorbance ratio method, which lies within the acceptance criteria i.e., 95 %-105 %. The methods were validated as per the International Council for Harmonisation guidelines and were found to be linear, precise, accurate, sensitive and robust and hence can be used for the estimation of indapamide and atenolol simultaneously in tablet formulation.
Keywords
Indapamide, atenolol, isosbestic, International Council for Harmonisation, validation
Hypertension and heart related diseases are leading causes of death across the world. Therapy involving drugs in combined dosage form offers excellent results in reducing hypertension and indirectly decreasing cardiovascular issues. Indapamide (IND) is a diuretic drug used in treatment of high blood pressure, edema heart attack, stroke and heart failure in persons with high blood pressure[1]. Atenolol (ATN) is a selective Beta 1 (β1) receptor antagonist which decreases the formation of angiotensin II and secretion of aldosterone and helps in the treatment of cardiovascular disease such as angina, hypertension, cardiac arrhythmias, and myocardial infractions[2]. Literature survey revealed that many Ultraviolet (UV), High Performance Thin Layer Chromatography (HPTLC) and High Performance Liquid Chromatography (HPLC) methods have been developed on these drugs either alone[3-10] as such or in combination[11-22]. UV methods are simple to carry out, fast and economical. In this study we propose two simple and validated UV methods for the simultaneous estimation IND and ATN in marketed formulations. The validation of the methods has been carried out as per the International Council for Harmonisation (ICH) guidelines.
Materials and Methods
Reagents and chemicals:
Active pharmaceutical ingredients IND and ATN were received as a gift samples from Cipla Pvt. Ltd. and Goa Zydus Lifesciences Ltd. Goa, respectively. The marketed tablet formulation, ATEN-D, comprising 2.5 mg of IND and 50 mg of ATN was purchased from a local pharmacy. Analysis was carried out on UV 1800 of Shimadzu as methanol was used as a solvent and distilled water as a diluent.
Choice of diluent:
The selection of diluent was made after assessing the solubility and stability of the drugs, IND and ATN, in different solvents. As both the drugs were soluble in methanol, it was used as solvent and distilled water was used as a diluent for further dilutions in the experiment.
Preparation of stock solutions (1000 μg/ml):
Stock solutions of IND and ATN were prepared by transferring 25 mg of each of the drug into a 25 ml volumetric flask and dissolving with sufficient amount of methanol. Further, volume was made up with methanol to get a concentration of 1000 μg/ ml.
Preparation of working stock solutions (100 μg/ml):
The above stock solutions were appropriately diluted to give a concentration range of 2-20 μg/ ml for IND and 10-80 μg/ml for ATN with distilled water.
Choice of wavelength:
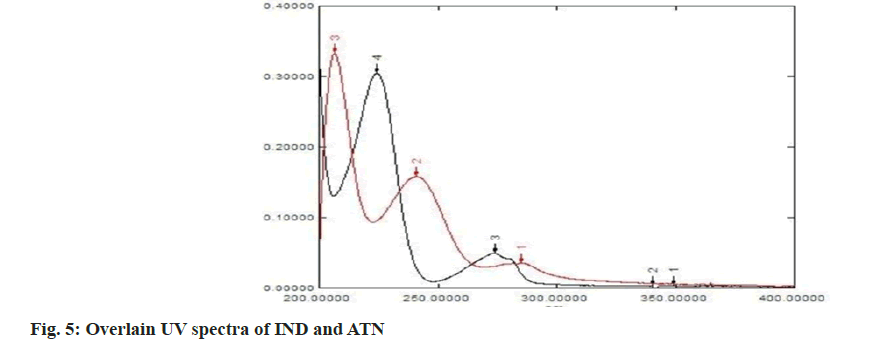
Solutions containing 2 μg/ml of IND and of 10 μg/ml of ATN were prepared from the working stock (100 μg/ml) of ATN and IND respectively using distilled water as diluent and were scanned in the range of 200-400 nm. The two spectra were recorded and λmax for both the drugs was determined. From the overlain spectra of both the drugs three wavelengths were selected, λmax of IND 241 nm, λmax of ATN 224.4 nm for the simultaneous equations method (method 1) and, λmax of ATN 224.4 nm and isosbestic point 233.8 nm were selected for the absorbance ratio method (method 2).
METHOD VALIDATION
Linearity:
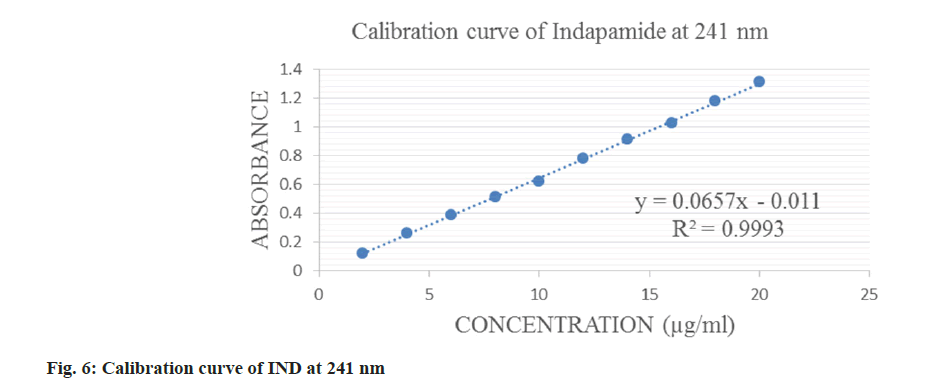
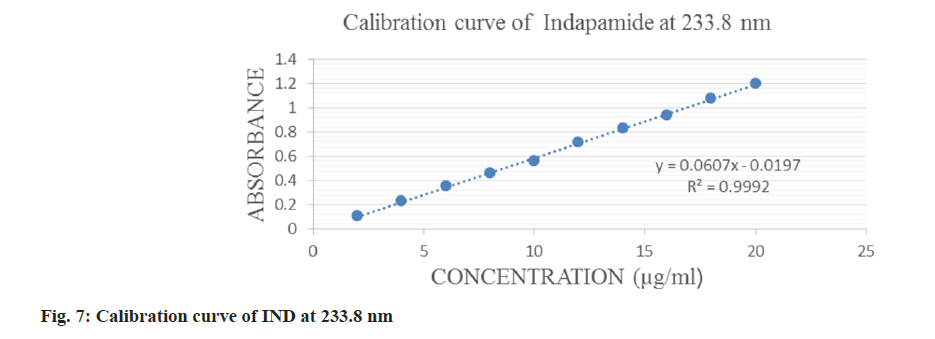
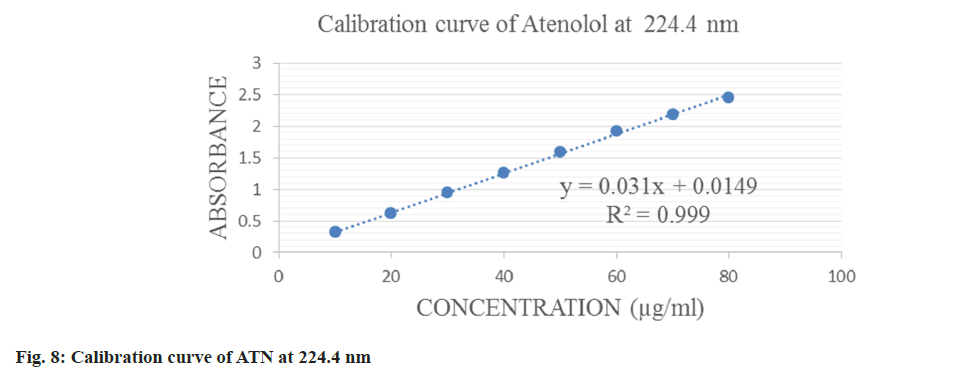
To determine the linearity range for IND and ATN, serial dilutions having concentration of 2, 4, 6, 8, 10, 12, 14, 16, 18, and 20 μg/ml and 10, 20, 30, 40, 50, 60, 70 and 80 μg/ml were prepared from the respective working stock solution of both the drugs. The absorbance of these solutions was recorded at predetermined wavelengths and the calibration curve was constructed by plotting absorbance versus concentration for both the methods. The linear regression equation and correlation coefficient (r2) were determined for method 1 and method 2.
Precision:
Precision was evaluated by performing repeatability, intraday precision and interday precision. Repeatability was evaluated by performing the assay procedure for six times and recording the absorbances at the respective wavelengths. Intraday precision was evaluated by analysing the working sample solution of tablet formulation in triplicate at different intervals on one day and interday precision was evaluated by analysing the working sample solution of tablet formulation in triplicate for 3 consecutive d. The standard deviation and percentage relative standard deviation with respective to the absorbances were calculated at each stage for both the methods.
Accuracy:
To establish the accuracy, recovery studies were performed at three different concentration levels, i.e., 80 %, 100 % and 120 % in triplicates. A working sample solution of tablet formulation equivalent to 30 μg/ml of ATN and 1.5 μg/ml of IND was added into three sets (consisting of three volumetric flasks each of 10 ml capacity). To all these flasks, working sample solution of tablet formulation equivalent to a concentration of 30 μg/ml of ATN and 1.5 μg/ml of IND was added. To the first set of three flasks, 0.12 ml of IND and 2.4 ml of ATN was added. To the second set of three flasks, 0.15 ml of IND and 3 ml of ATN was added. To the third set of three flasks 0.18 ml of IND and 3.6 ml of ATN was added. Later diluent, i.e., distilled water was added up to the mark.
Limit of Detection (LOD) and Limit of Quantitation (LOQ):
LOD and LOQ were calculated by using slope and standard deviation response of calibration curve of the drugs, IND and ATN.
Robustness:
Robustness was established by performing the assay procedure under some deliberately varying conditions like changing the instrument, analyst and wavelength by ±2 nm and measuring the absorbances. The standard deviation and percentage relative standard deviation were calculated.
Analysis of tablet formulation:
Ten tablets of ATEN-D containing 2.5 mg of IND and 50 mg of ATN were weighed, average weight determined and triturated to a fine powder. Tablet powder equivalent to 25 mg of ATN was accurately weighed and transferred into 25 ml volumetric flask containing about 15 ml of methanol and sonicated for 15 min. Using the same solvent dilution was made up to the mark and further dilutions were made with distilled water to obtain the final concentration of 2 μg/ml for IND 50 μg/ ml of ATN. The assay procedure was repeated three times. The absorbances of the resulting solution were recorded at predetermined wavelengths and the percent purity of both the drugs were calculated for method 1 and method 2.
Results and Discussion
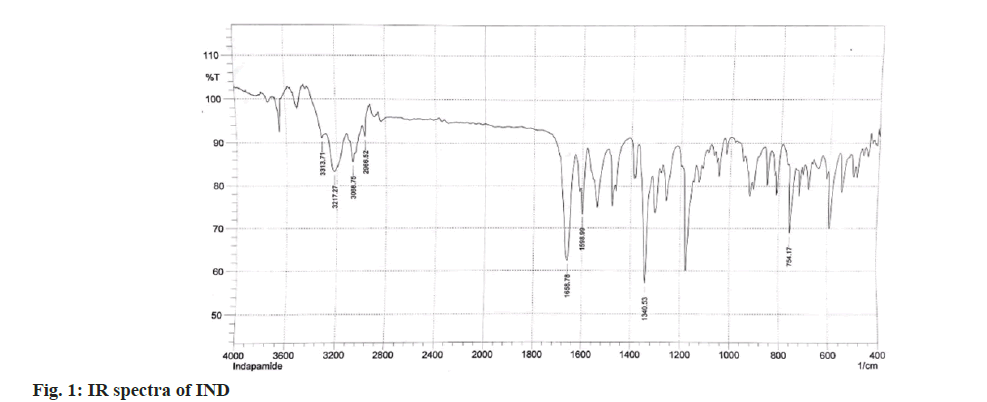
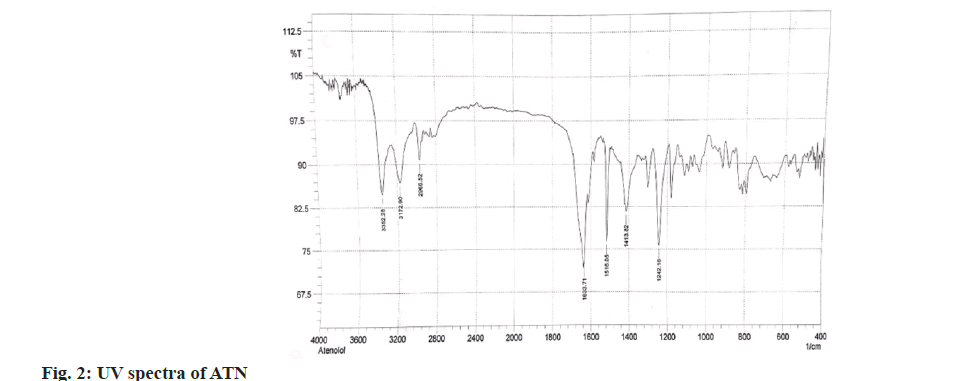
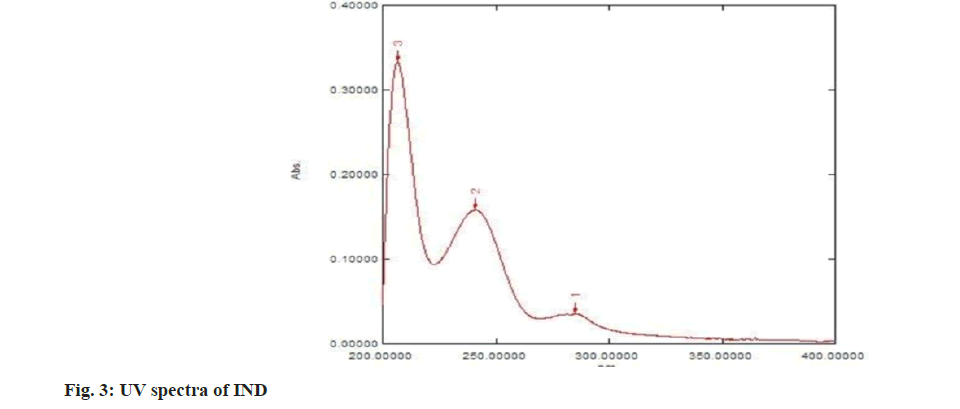
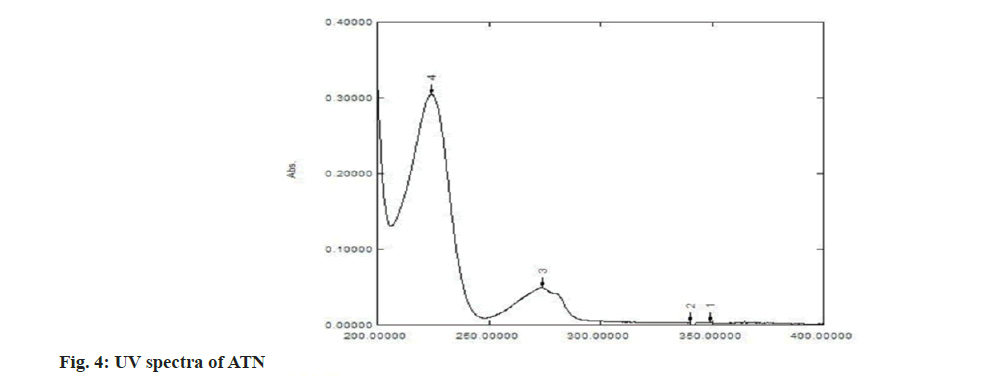
The structure of IND and ATN was confirmed by taking the Infrared (IR) spectra of both the drugs as shown in fig. 1 and fig. 2 respectively. Fourier Transform Infrared (FTIR) spectra of pure IND showed significant bands at 3317 cm-1 and 3217 cm-1 due to N-H stretching, at 1658 cm-1 due to C=O stretching, 1598 cm-1 due to aromatic C-H stretch. FTIR spectra of pure ATN showed significant bands at 3352 cm-1 due to O-H stretch, at 3172 cm-1 and 2966 cm-1 due to N-H stretching, at 1633 cm-1 due to C=O stretching and 1242 cm-1 due to aromatic C-O ether stretch. The solvent was selected based on the solubility of both the drugs. Methanol was used as a solvent and distilled water was used as a diluent. The solutions of IND and ATN were scanned by UV spectrophotometer in the range of 200-400 nm. The two spectra were recorded and λmax for IND was found to be 241 nm and λmax of ATN was found to be 224.4 nm as shown in fig. 3 and fig. 4 respectively. From the overlain spectra of IND and ATN (fig. 5), it was found that both the drugs, absorbs at the λmax of the other. Hence, 241 nm and 224.4 nm were selected as λ1 and λ2 respectively, for simultaneous equations method and 224.4 nm and 233.8 nm (isosbestic point) were chosen as λ1 and λ2 for absorbance correction method.
IND was linear in a concentration range of 2-20 μg/ml and ATN in a range of 10-80 μg/ml which is displayed in fig. 6-fig. 8 for both the methods. The correlation coefficient was 0.9993 and 0.999 for IND and ATN by method 1 and 0.9992 and 0.999 by method 2 respectively, which proved a good correlation between the absorbance and concentration. The results are displayed in Table 1.
| Parameters | Method 1 | Method 2 | ||
|---|---|---|---|---|
| IND | ATN | IND | ATN | |
| Wavelength selected | 241 nm | 224.4 nm | 233.8 nm | 224.4 nm |
| Beer’s law range | 2-20 µg/ml | 10-80 µg/ml | 2-20 µg/ml | 10-80 µg/ml |
| Correlation coefficient (r2) | 0.9993 | 0.999 | 0.9992 | 0.999 |
| Regression equation | y=0.0657x-0.011 | y=0.031x+0.0149 | y=0.0607x-0.0197 | y=0.031x+0.0149 |
| Slope | 0.0657 | 0.031 | 0.0607 | 0.031 |
| Intercept | 0.0011 | 0.0149 | 0.0197 | 0.0149 |
Table 1: Linearity Data
Precision was carried out for by analysing the tablet formulation for repeatability, interday and intraday studies by both the methods. The results are depicted in Table 2 and Table 3. Accuracy of the methods was obtained by carrying out recovery studies at three different levels, 80 % 100 % and 120 %. The mean recovery for IND and ATN was between 98 %-101 % by method 1 and 100 %-101 % for IND and 99 %-102 % for ATN by method 2 as shown in Table 4. Robustness of the method was established by making deliberate changes in the instrument, analyst and wavelength and the percentage RSD was found to be less than 2 % which was within the limits which is depicted in Table 5. From the LOD and LOQ values, the method was seen to be sensitive as seen in Table 6. Both the methods were applied for the analysis of marketed tablet formulation. The percentage purity in the marketed formulation was found to be 99.79 % for IND and 98.57 % for ATN by method 1 and 99.56 % for IND and 100.0 % for ATN by method 2, which lies within the acceptance criteria i.e., 95 %-105 % which is depicted in Table 7.
| S no. | Method 1 | Method 2 | ||
|---|---|---|---|---|
| Absorbance at 241 nm | Absorbance at 224.4 nm | Absorbance at 233.8 nm | Absorbance at 224.4 nm | |
| Mean | 0.339 | 1.662 | 0.941 | 1.761 |
| SD | 0.0029 | 0.0146 | 0.0142 | 0.0276 |
| % RSD | 0.8688 | 0.8837 | 1.5136 | 1.5691 |
Table 2: Precision Data Repeatability
| Wavelength | Method 1 | Wavelength | Method 2 | ||||
|---|---|---|---|---|---|---|---|
| Mean | SD | % RSD | Mean | SD | % RSD | ||
| Intraday | |||||||
| 241 nm morning | 0.343 | 0.003 | 0.771 | 233.8 nm morning | 0.951 | 0.008 | 0.898 |
| Afternoon | 0.342 | 0.002 | 0.608 | Afternoon | 0.947 | 0.002 | 0.244 |
| Evening | 0.341 | 0.003 | 0.880 | Evening | 0.951 | 0.006 | 0.616 |
| 224.4 nm morning | 1.676 | 0.015 | 0.879 | 224.4 nm morning | 1.778 | 0.020 | 1.125 |
| Afternoon | 1.673 | 0.007 | 0.432 | Afternoon | 1.778 | 0.005 | 0.283 |
| Evening | 1.671 | 0.012 | 0.719 | Evening | 1.782 | 0.017 | 0.967 |
| Interday | |||||||
| 241 nm day 1 | 0.337 | 0.003 | 0.745 | 233.8 nm day 1 | 0.935 | 0.005 | 0.535 |
| Day 2 | 0.342 | 0.001 | 0.337 | Day 2 | 0.942 | 0.008 | 0.858 |
| Day 3 | 0.346 | 0.006 | 1.642 | Day 3 | 0.946 | 0.013 | 1.379 |
| 224.4 nm day 1 | 1.654 | 0.007 | 0.425 | 224.4 nm day 1 | 1.749 | 0.010 | 0.580 |
| Day 2 | 1.680 | 0.009 | 0.540 | Day 2 | 1.762 | 0.016 | 0.887 |
| Day 3 | 1.683 | 0.018 | 1.056 | Day 3 | 1.774 | 0.027 | 1.517 |
Table 3: Intraday and Interday Data
| Spike level (%) | Amount present (µg/ml) | Amount recovered (µg/ml) | % Recovery | Mean % recovery | ||||
|---|---|---|---|---|---|---|---|---|
| Drugs | IND | ATN | IND | ATN | IND | ATN | IND | ATN |
| 80 | 1.2 | 24 | 1.2 | 23.43 | 100 | 97.6 | 100.2 | 98.63 |
| 1.2 | 24 | 1.19 | 23.49 | 99.16 | 97.6 | |||
| 1.2 | 24 | 1.22 | 24.17 | 101.6 | 101 | |||
| 100 | 1.5 | 30 | 1.53 | 30.77 | 102 | 103 | 100.4 | 101 |
| 1.5 | 30 | 1.51 | 30.17 | 100.6 | 101 | |||
| 1.5 | 30 | 1.48 | 30.08 | 98.66 | 100 | |||
| 120 | 1.8 | 36 | 1.77 | 36.26 | 98.33 | 101 | 98.7 | 99.69 |
| 1.8 | 36 | 1.79 | 35.24 | 99.44 | 97.9 | |||
| 1.8 | 36 | 1.77 | 36.19 | 98.33 | 101 | |||
Table 4: Accuracy Data
| Parameters | Method 1 | Method II | ||||||
|---|---|---|---|---|---|---|---|---|
| Change of UV | UV 1 | UV 2 | UV 1 | UV 2 | ||||
| Wavelength (nm) | 241 | 224.4 | 241 | 224.4 | 233.8 | 224.4 | 233.8 | 224.4 |
| Mean | 0.342 | 1.676 | 0.349 | 1.706 | 0.945 | 1.771 | 0.938 | 1.754 |
| SD | 0.002 | 0.015 | 0.001 | 0.005 | 0.008 | 0.019 | 0.007 | 0.016 |
| % RSD | 0.608 | 0.902 | 0.286 | 0.343 | 0.899 | 1.077 | 0.799 | 0.952 |
| Change of analyst | Analyst 1 | Analyst 2 | Analyst 1 | Analyst 2 | ||||
| Mean | 0.341 | 1.673 | 0.342 | 1.669 | 0.945 | 1.771 | 0.938 | 1.754 |
| SD | 0.002 | 0.0100 | 0.0055 | 0.0080 | 0.0085 | 0.0190 | 0.0075 | 0.017 |
| % RSD | 0.609 | 0.5984 | 1.6072 | 0.4793 | 0.8996 | 1.0772 | 0.7995 | 0.9522 |
| Change in the wavelength | Wavelength +2 | Wavelength -2 | Wavelength +2 | Wavelength -2 | ||||
| Wavelength (nm) | 243 | 226.4 | 239 | 222.4 | 235.8 | 226.4 | 231.8 | 222.4 |
| Mean | 0.278 | 1.617 | 0.437 | 1.662 | 0.728 | 1.720 | 1.192 | 1.764 |
| SD | 0.004 | 0.008 | 0.0070 | 0.009 | 0.006 | 0.024 | 0.013 | 0.019 |
| % RSD | 1.695 | 0.525 | 1.605 | 0.558 | 0.827 | 1.423 | 1.107 | 1.132 |
Table 5: Robustness Data
| Drugs | IND | ATN | ||
|---|---|---|---|---|
| Method I | 241 nm | 224.4 nm | 241 nm | 224.4 nm |
| LOD | 0.190 | 0.168 | 0.907 | 0.480 |
| LOQ | 0.576 | 0.509 | 2.749 | 1.454 |
| Method II | 233.8 nm | 224.4 nm | 233.8 nm | 224.4 nm |
| LOD | 0.116 | 0.168 | 0.642 | 0.480 |
| LOQ | 0.503 | 0.509 | 1.945 | 1.454 |
Table 6: Limit of Detection and Limit of Quantification Lod and Loq
| Method | Brand name | Label claim of IND (µg/ml) | Label claim of ATN (µg/ml) | Amount found for IND (µg/ml) | Amount found for ATN (µg/ml) | % Recovery for IND (n=3) | % Recovery for ATN (n=3) |
|---|---|---|---|---|---|---|---|
| I | Aten D | 2.5 | 50 | 2.49 | 49.28 | 99.79 | 98.57 |
| II | Aten D | 2.5 | 50 | 2.48 | 50.01 | 99.56 | 100 |
Table 7: Assay of the Formulation
Two simple UV spectrophotometric methods have been developed for the estimation of IND and ATN in tablet dosage form. The results showed that both the methods were statistically equivalent. From the results of the validation it can be concluded that methods are suitable and meet the ICH requirement and it may be concluded that the result obtained by these two methods are in fair agreement with each other. Thus the analysis of solid dosage form of IND and ATN in combination may be successfully performed by the simultaneous ratio method and absorbance ratio method.
Acknowledgements:
The authors are thankful to Cipla Pvt. Ltd. and Goa Zydus Lifesciences Ltd. Goa, for providing the gift samples of IND and ATN respectively.
Conflict of interests:
The authors declared no conflict of interests.
References
- Kori S, Goyal J, Sharma S, Pahade NK, Tandekar M. Method development and validation of Atenolol drug by spectrophotometric and HPLC technique in forensic application. Int J Sci Res 2013;4:438.
- Solanki VS, Bishnoi RS, Baghel R, Jain D. RP-HPLC method development and validation for simultaneous estimation of Cilnidipine, Atenolol and Chlorthalidone. J Drug Deliv Ther 2018;8(6):78-82.
- Tarkase KN, Jadhav MB, Tajane SR, Dongare US. Development and validation of UV-spectrophotometric methods for estimation of indapamide in bulk and tablet dosage form. Der Pharma Chem 2012;4:1128-32.
- Süslü İ, Altınöz S. Two derivative spectrophotometric determinations of indapamide in pharmaceutical dosage forms. J Pharm Biomed Anal 2002;30(2):357-64.
[Crossref] [Google Scholar] [PubMed]
- Chaudhary A. Analytical method for determination of indapamide in marketed pharmaceutical preparation: A mini review. Int J All Res Writings 2020;2(1):47-51.
- Agrawal GP. Validated stability indicating method for determination of indapamide in pharmaceutical formulation. Res J Pharm Technol 2021;14(6):3347-52.
[Crossref] [Google Scholar] [PubMed]
- Nayak P, Kachroo M. A comparative group-qsar and molecular docking studies of 4-thiazolidinone containing indolin-2-one moiety as vgefr inhibitors. Int J Pharm Sci Res 2017;8(4):1796.
- Aboud K, Mohammad A, Isbera M, Beesh M. Development and validation UV spectrophotometric method for determination of atenolol in pure materials and pharmaceutical dosage. Indo Am J Pharm Res 2017;7(4):8179-84.
- Lalitha G, Salomi PR, Ravindra RK. Development of an analytical method and its validation for the analysis of atenolol in tablet dosage form by UV-Spectrophotometry. In J Pharm Pharm Sci 2013;5(2):197-9.
- Kumar B, Patel R, Bhandari A. Spectrophotometric method for estimation of Atenolol in tablet dosage form. Asian J Chem 2006;18(4):3049.
- Pawar PV, Gaikwad PD, Bankar VH, Pawar SP. Development and validation of UV-spectrophotometric method for simultaneous estimation of atenolol and indapamide in bulk and tablet dosage form. Int J Pharm Technol 2010;2(4):876-85.
- Fernandes N, Nimdeo MS, Choudhar VP, Kulkarni RR, Pande VV, Nikalje AG. Dual wavelength and simultaneous equation spectrophotometric methods for estimation of atenolol and indapamide in their combined dosage form. Int J Chem Sci 2008;6(1):29-35.
- Basu A, Das B, Basak K, Chakraborty M, Basu S. Development and validation of stability indicating high performance liquid chromatographic method for simultaneous estimation of atenolol and indapamide in tablet dosage form. J Pharm Res 2011;4:1677-80. [Crossref]
- Baheti KG, Shah N, Shaikh S. Ion-pairing reverse-phase high performance liquid chromatography method for simultaneous estimation of atenolol and indapamide in bulk and combined dosage form. Indian J Pharm Sci 2012;74(3):271.
[Crossref] [Google Scholar] [PubMed]
- Yadav SS, Rao JR. Simultaneous HPTLC analysis of atenolol and indapamide in tablet formulation. Int J Compr Pharm 2011;9:1-4.
- Rani UN, Saroja N, Rani JCH. New validated RP-HPLC method for simultaneous estimation of atenolol and indapamide in tablets. World J Pharm Res 2015;4(12):1057-65.
- Badola A, Kumar P, Bahuguna Y, Tailor CH, Ashutosh B, Praveen K, et al. Development and validation of RP-HPLC method for simultaneous estimation of atenolol and indapamide in combined dosage form. Int J Pharm Sci Lett 2013;3(3):213-18.
- Yadav SS, Rao JR. Use of Miceller mobile phase for the chromatographic simultaneous determination of Atenolol and Indapamide in pharmaceutical Dosage form. Int J Pharm Bio Sci 2012;3(4):645-55.
- Parusu T, Ponneri V. RP-HPLC method for simultaneous determination of atenolol and indapamide in pharmaceutical dosage forms, human blood and milk. Eur J Chem 2012;3(2):138-42.
- Gupta KR, Wankhede SB, Tajne MR, Wadodkar SG. High performance thin layer chromatographic estimation of atenolol and indapamide from pharmaceutical dosage form. Asian J Chem 2007;19(6):4183.
- Kadian N, Maste M, Bhat AR. An Effective RP-HPLC method for the simultaneous determination of atenolol and indapamide in marketed tablet formulation (ATEN-D). Asian J Res Chem 2012;5(3):405-8. [Crossref]
- Kher GJ, Ram VR, Bhavesh LD, Joshi HS. HPLC method development and validation of combined dosage form of atenolol and indapamide in tablets. Int J Pharm Technol 2011;3:3277-98.
