- *Corresponding Author:
- Shirkhedkar
R. C. Patel College of Pharmacy, Karvand Naka, Shirpur - 425 405, India
E-mail: atul_shirkhedkar@yahoo.com
| Date of Received : | 20 March 2006 |
| Date of Revised : | 24 March 2007 |
| Date of Accepted : | 6 October 2007 |
| Indian J. Pharm. Sci., 2007, 69 (5): 683-684 |
Abstract
A simple, accurate, economical and reproducible procedure for simultaneous estimation of atorvastatin calcium and ezetimibe in their tablet dosage form has been developed using, Q-absorbance equation. The method involves, the absorbance measurement at 235.5 nm (iso-absorptive point) and 246.0 nm (λmax of atorvastatin calcium), in methanol. Both the drugs, obey Beer-Lambert's law in the concentration range of 5-25 μg/ml. The results of analysis have been validated statistically and by recovery studies.
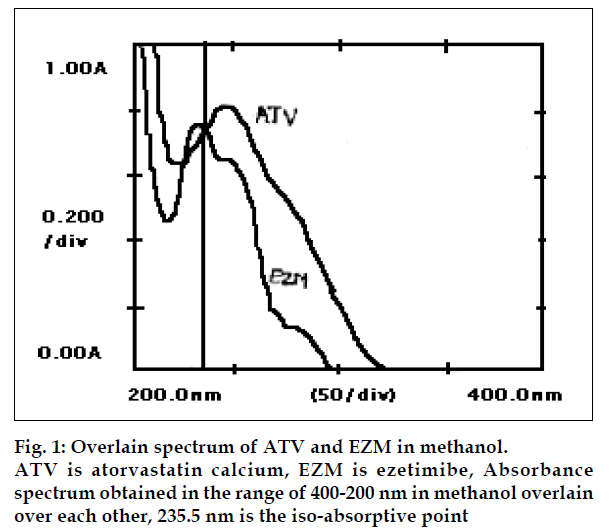
Atorvastatin calcium (ATV) chemically [R-(R,R*)]-2-(4- flurophenyl)-β,δ-dihydroxy-5(1-methylethyl)-3-phenyl- 4-[(phenylamino)carbonyl]-1H-pyrrole-1-heptanoic acid, calcium salt (2:1) trihydrate, is a synthetic HMGCoA reductase inhibitor [1]. Various analytical methods, such as, HPLC [2] and HPTLC [3] have been reported for the estimation of ATV from its formulations. Ezetimibe (EZM) chemically 1-(-4-flurophenyl)-(3S)- hydroxypropyl]-(4S)-(4-hydroxyphenyl)-2-azetidione, is a selective cholesterol absorption inhibitor [4]. Several analytical methods have been developed for the quantification of EZM. The methods include, HPLC [5] and spectrophotometry [6]. Literature survey revealed that no UV spectrophotometric method has been reported for the estimation of ATV and EZM in combined dosage form. In present communication, we propose simple and accurate spectrophotometric method for simultaneous estimation of both the drugs in tablet dosage form. ATV and EZM working standards were procured as a gift sample from Blue Cross Labs. Ltd. (Nashik). Two combined film-coated tablet formulations containing ATV (10 mg) and EZM (10 mg) were procured from local market. (Liponorm EZ, Blue Cross Labs, Nashik and TG-tor EZ, Atoz Life Sciences). All chemicals and reagents used were of analytical grade. UV/Vis spectrophotometer 1601 (Shimadzu, Japan) and 10 mm matched quartz cells were used, during the study. Standard stock solutions of 100 µg/ml were prepared by dissolving 10 mg of each in 100 ml of methanol (E. Merck). From these stock solutions, working standard solutions having concentration of 15 µg/ml each were prepared by appropriate dilutions. They were scanned in the wavelength range of 400-200 nm and the overlain spectrum was obtained (fig. 1). Two wavelengths 235.5 nm (iso-absorptive point) and 246.0 nm (λmax of ATV) were selected for the formation of Qabsorbance equation. The calibration curves were found to be linear in the concentration range of 5-25 µg/ml, for each drug. The absorptivity coefficients of each drug at both wavelengths were determined. The concentration of two drugs in the mixture can be calculated, by using equations, CATV= QM–QY/ QX–QY×A1/ax1, CEZM=A1/ax1-CATV, where, A1 and A2, are the absorbances of mixture at 235.5 nm and 246.0 nm, ax1 (425.11) and ax2 (452.08) absorptivities of ATV at 235.5 nm and 246.0 nm, respectively, ay1 (425.09) and ay2 (388.96) absorptivities of EZM at 235.5 nm and 246.0 nm, respectively and QM= A2/A1, QY= ay2/ay1, QX= ax2/ax1 and CATV and CEZM are concentrations of ATV and EZM, respectively in g/100 ml in the sample solution.
Twenty tablets were weighed; average weight determined and crushed to fine powder. An accurately weighed sample equivalent to 10 mg of ATV and 10 mg of EZM was transferred to 100 ml volumetric flask; 50 ml of methanol was added and sonicated for 10 min.The solution was filtered through whatman filter paper No. 41 and the volume was made up to 100 ml, using the same solvent. After, appropriate dilutions, absorbances of the sample solutions were recorded, at 235.5 nm and 246.0 nm i.e. A1 and A2, respectively and the concentration of the two drugs in sample solutions (CATV and CEZM) were determined by, using Eqns. 1 and 2. The analysis procedure was repeated, five times, with tablet formulations of two brands; the results of analysis are presented in the Table 1.
| Brand | Parameters | % label claim* | |
|---|---|---|---|
| ATV | EZM | ||
| Liponorm EZ | Mean | 99.56 | 100.25 |
| SD | 0.06 | 0.04 | |
| RSD | 0.37 | 0.23 | |
| TG-tor EZ | Mean | 99.50 | 100.38 |
| SD | 0.04 | 0.04 | |
| 0.28 | 0.22 | ||
*Values for % label claim are mean of five estimations; SD is standard deviation and RSD is relative standard deviation
Table 1: Analysis Data of Tablet Formulations.
The proposed method was found to be simple, accurate, economic and rapid for the routine simultaneous estimation of atorvastatin calcium and ezetimibe in tablet dosage forms. The values of standard deviation and % RSD were found to be <2% indicates the high precision of the method. The results of recovery studies lie between 99-101% indicative of accuracy of the method.
Acknowledgements
The authors thank the Blue Cross Labs. Ltd. (Nashik), for providing drug samples and R. C. Patel College of Pharmacy, Shirpur, for providing facilities to carry out this work.
References
- Moffat, A.C., Osselton, M.D. and Widdop, B., In; Clarke's Analysis of Drugs and Poisons in Pharmaceuticals, body fluids and Postmortem material, 3rd Edn., Part 2, The Pharmaceutical Press, Great Britain, 2004, 654.
- Erturk, S., Aktas, E.S., Ersoy, L., Ficicioglu, S., J. Pharm. Biomed. Anal. , 2003, 33, 1017.
- Yadav, S.S., Mhaske, D.V., Kakad, A.B., Patil, B.D., Kadam, S.S. and Dhaneshwar, S.R., Indian J. Pharm. Sci. , 2005, 67, 182.
- Maryadele, S., Eds., In; The Merck Index, 13th Edn. , Merck and Co., Inc., Whitehouse Station, NJ, 2001, 3949.
- Sistla, R., Tata, V.S., Kashyap, Y.V., Chandrashekhar, D and Diwan, P.V., J. Pharm. Biomed. Anal. , 2005, 39, 517.
- Sankar, D.G., Pawar, A.K.M., Sumnath, S.K and Latha, M.P.V., Asian J. Chem. , 2005, 17, 2025.


