- Corresponding Author:
- R. R. Jivani
Department of Pharmaceutics, C. U. Shah College of Pharmacy and Research, Wadhwan-363 030, India
E−mail: hellorishad@yahoo.com
| Date of Submission | 27 August 2011 |
| Date of Revision | 06 August 2012 |
| Date of Acceptance | 11 August 2012 |
| Indian J Pharm Sci, 2012, 74 (4): 302-311 |
Abstract
The current study involves the fabrication of oral bioadhesive bilayer matrices of narrow absorption window drug baclofen and the optimisation of their in vitro drug release and characterisation. Statistical design of experiments, a computerâ??aided optimisation technique, was used to identify critical factors, their interactions and ideal process conditions that accomplish the targeted response(s). A central composite design was employed to systematically optimise the drug delivery containing a polymer, filler and compression force. The values of ratio of different grades of hydroxypropyl methylcellulose, microcrystalline cellulose and compression force were varied to be fitted in design. Drug release at 1 h (Q1), 4 h (Q4), 8 h (Q8), 12 h (Q12), and hardness were taken as responses. Tablets were prepared by direct compression methods. The compressed tablets were evaluated for their hardness, weight variation, friability, content uniformity and diameter. Counter plots were drawn and optimum formulation was selected by desirability function. The formulations were checked for their ex vivo mucoadhesion. The experimental value of Q1, Q4, Q8, Q12 and hardness for checkâ??point batch was found to be 31.64, 45.82, 73.27, 98.95% and 4.4 kg/cm2, respectively. The release profile indicates Highuchi kinetics (Fickian transport) mechanism. The results of the statistical analysis of the data demonstrated significant interactions amongst the formulation variables, and the desirability function was demonstrated to be a powerful tool to predict the optimal formulation for the bilayer tablet.
Keywords
Desirability function, narrow absorption window drug, statistical design of experiments
The traditional approach to drug−design experimentation requires that only one factor at a time be changed while keeping all other variables constant. This approach has many major flaws, but the two most egregious ones are: It cannot assess factor interactions, which in pharmaceutical processes must be anticipated and it covers a small fraction of the total feasible factor space. Statistical design of experiments (DoE), a matrix−based multifactor method, measures interaction effects and it encompasses the entire multidimensional experimental region [1]. Aided by the software programmed for this purpose, DoE has become recognised as an important tool for more rapid pharmaceutical process and product development [2]. The rotatable central composite design is widely employed for optimisation problems [3,4] and has the advantage over the orthogonal design, that the variance of the predicted response is a function of only the distance from the centroid irrespective of direction.
Oral sustained−release formulations have drawn back with respect to gastric emptying time. Variation in gastric emptying results in variable drug absorption. Too rapid gastrointestinal transit can lead to inadequate drug release from dosage form above the absorption zone, results in to diminish effectiveness of the given dose when the drug presents an absorption window. Prolongation of gastric residence time of a rate−controlled oral drug delivery system can rectify these problems by minimising the intersubject variability known as ‘peak and trough’ effect, and also improve the bioavailability, specially for drugs having a narrow absorption window in the upper part of the gastrointestinal (GI) tract [5]. Drugs absorbed in the upper part of the GIT may exhibit variability in absorption due to inter− and intra−individual variability in gastric emptying and gastrointestinal motility [6]. This variation in absorption may be addressed by administering a dosage form comprising the drug such that a small part of the drug is available as immediate release, and a large part is available as sustained or controlled release [7].
The main approaches to prolonging the gastric residence time of pharmaceutical dosage forms include bioadhesive delivery systems, which adhere to mucosal surfaces; devices that rapidly increase in size once they are in the stomach to retard the passage through the pylorus; and density−controlled delivery systems [8,9]. If the bioadhesive interactions occur primarily with the mucous layer of a mucous membrane, the phenomenon is referred to as ‘mucoadhesion’. The goals of mucoadhesive drug delivery systems are to increase the absorption of drugs into the circulation and to prolong direct pharmacological action for mucin and/or epithelial cell membranes [10,11]. Mucoadhesion can be obtained by either nonspecific or specific interactions with surface ligands at a mucosal surface. Over the last two decades, there has been considerable interest in bioadhesive/mucoadhesive drug delivery systems for its potential to optimise localised drug delivery, by retaining a dosage form at the site of action, or systemic delivery, by retaining a formulation in intimate contact with the absorption site [12].
Baclofen possesses low bioavailability as its absorption window is the upper gastrointestinal tract [13]. It has a short biological half−life (3−4 h) and high physicochemical stability (stable at gastric condition) [14]. It is difficult to formulate a sustained−release product of baclofen because it has a limited site of absorption. It means, to improve its absorption at the site of absorption, its gastric emptying time should be decreased. To achieve delayed gastric emptying time and thereby improved drug absorption, it was decided to fabricate a site−specific drug delivery system containing baclofen.
To achieve the optimised site−specific dosage form containing baclofen, HPMC was used as a mucoadhesive and drug release retardant [15,16]. Microcrystalline cellulose was used as a diluent as well as a release modifier [17]. It was further objective of present investigation to understand the influence of above excipient/s on drug release and floating time. Hence, statistical tools like rotatable central composite design and desirability function were utilised to get the optimised formualtion.
The major objective of the present investigation was to develop a bilayered mucoadhesive drug delivery system containing baclofen using rotatable central composite design as an optimisation technique and its in vitro evaluation.
Materials and Methods
Baclofen was received as a gift sample from Sun Pharmaceutical Ltd., Vadodara, India. Methocel K4M CR (4000 mPa.s), and Methocel K100M CR (100 000 mPa.s) were received as a gift samples from Colorcon Asia Pvt. Ltd., Goa, India. Sodium bicarbonate was purchased from S. D. Fine chemicals, Mumbai, India. All other ingredients were procured from Lesar chemicals, Vadodara, India and were of analytical grade. All materials used throughout the study conformed to USP XXIV standards.
Preparation of bilayer tablet of baclofen
Various preliminary trial batches were taken to get concentrations of independent variables to be used in rotatable central composite design having 2 levels and 3 factors. Table 1 shows the level of variables according to the experimental design. All the excipients were passed through sieve no. 72, and mixed thoroughly for 10 min by geometrical mixing. The preparation process involved two steps. First, loading dose of the drug (13 mg) was mixed with required quantity of sodium starch glycolate (super disintegrating agent) and di−calcium phosphate (DCP) by mixing in laboratory cube blender for 15 min., the powder blend was then lubricated with magnesium stearate (1%).
Second, maintenance dose of baclofen (27 mg) was mixed along with excipients in a formulation, by mixing in laboratory cube blender for 15 min. Then, the powder blend was lubricated with magnesium stearate (1%). Loading and maintenance dose of baclofen was calculated using pharmacokinetics parameters of baclofen.
| Ingredients | Quantity per tablet (mg) |
|---|---|
| Immediate release layer | |
| Baclofen | 13 |
| Sodium starch glycolate | 3 |
| Di-calcium basic phosphate (DCP) | 81 |
| Sustained release layer* | |
| Baclofen | 27 |
| Sodium bicarbonate | 30 |
Table 1: Quantitative formula for preparation of bilayer baclofen tablet.
For fabrication of bilayer tablet of baclofen initially, immediate release part of formulation was compressed by applying 10 kg/cm2 pressure then sustained−release layer was placed and compressed by applying different pressures as mentioned in Table 2 by hydraulic pellet press (Type: KP−587, PCI services, Mumbai, India). Each bilayer tablet contained 13 mg of loading dose and 27 mg of maintenance dose. Quantitative formula for each bilayer tablet is shown in Table 1. Prior to compression, powders were evaluated for their characteristic parameters, such as bulk density, tapped density, Carr’s index and angle of repose [18], Carr’s compressibility index (CI) was calculated from the bulk and tapped densities [19] using a tap density apparatus (Galaxy Scientific Equipments, Dombivli, India). After compression of bilayer tablets, friability was measured using Roche friabilator (Electrolab, Bangalore, India) and hardness was measured using Monsanto type hardness tester (IEC, Mumbai, India). The diameter of tablet was measured using vernier calipers (Data Scientifics, Bangalore, India).
Rotatable central composite design
Preliminary experiments were performed to select the levels of constraints of the formulation variables. For the optimisation of the bilayer tablet formulation, a randomised rotatable central composite design was employed (α=1.68) for three independent factors, the ratio of HPMC K100M: HPMC K4M (A), the amount of microcrystalline cellulose (B) and the compression force (C). The dependent response variables measured were percentage of baclofen release at 1, 4, 8, 12 h and hardness. The formulations in coded form are listed in Table 2. The experiments were conducted in a random sequence. Based on preliminary investigation, the range of each independent variable was selected. The transformation to physical units is summarised in Table 2, centre points are repeated six times (Formulations nos. 15−20 in Table 2) in order to evaluate the experimental error.
Ex vivo mucoadhesion study
Mucoadhesion studies were conducted using a modification of the assembly described earlier. All the experiments were conducted as per local licensing regulations. Rat stomach tissue was used to carry out mucoadhesion study [20]. The stomach tissue was used immediately after sacrificing the animal for this study. The stomach mucosal membrane was excised by removing the underlying connective and adipose tissue and was equilibrated at 37±1° for 30 min in HCl buffer pH 1.2 before the mucoadhesion evaluation study [21]. The tablets were lowered on mucosa under a constant weight of 5 g for a total contact period of 1 min. The detachment force, force required for separating the tablet from the tissue surface was determined.
| No | A | B | C | Q1±SD (%) | Q4±SD (%) | Q8±SD (%) | Q12 ±SD (%) | Hardness (kg/cm2) | |||
|---|---|---|---|---|---|---|---|---|---|---|---|
| F1 | –1 | –1 | –1 | 27.73±3.31 | 55.22±3.29 | 87.82±2.19 | 100±3.00 | 4.3±3.3 | |||
| F2 | 1 | –1 | –1 | 28.22±2.26 | 46.33±2.67 | 78.24±2.04 | 94.44±2.27 | 5.8±2.3 | |||
| F3 | –1 | 1 | –1 | 27.66±2.18 | 44.00±2.65 | 72±2.18 | 92.22±2.18 | 3.5±1.2 | |||
| F4 | 1 | 1 | –1 | 26.63±2.20 | 37.55±2.05 | 61.25±1.25 | 82.29±2.19 | 6.2±1.37 | |||
| F5 | –1 | –1 | 1 | 31.88±2.27 | 52.39±2.71 | 77.09±1.64 | 98.22±2.72 | 5.3±2.13 | |||
| F6 | 1 | –1 | 1 | 29.71±2.18 | 43.62±2.96 | 76.55±2.18 | 87.83±2.11 | 5.7±1.27 | |||
| F7 | –1 | 1 | 1 | 31.19±0.93 | 48.34±1.95 | 69.94±2.55 | 89.04±2.14 | 5±1.22 | |||
| F8 | 1 | 1 | 1 | 28.73±2.11 | 43.62±1.70 | 64.89±2.10 | 86.35±2.87 | 5.7±1.65 | |||
| F9 | –α | 0 | 0 | 30.95±2.19 | 42.52±2.19 | 71.28±2.51 | 93±2.63 | 5.3±1.39 | |||
| F10 | +α | 0 | 0 | 28.86±1.69 | 52.88±2.77 | 74.7±2.11 | 93.7±2.59 | 5.9±1.27 | |||
| F11 | 0 | -α | 0 | 28.2±2.01 | 56.75±2.81 | 48.67±2.19 | 100±2.27 | 4.9±1.83 | |||
| F12 | 0 | +α | 0 | 31.00±1.52 | 56.34±0.49 | 85.72±2.15 | 99.12±2.65 | 5.4±1.66 | |||
| F13 | 0 | 0 | -α | 25.73±1.96 | 57.88±3.20 | 79.04±2.12 | 100±2.54 | 4.5±1.52 | |||
| F14 | 0 | 0 | +α | 27.00±1.77 | 48.7±2.57 | 83.76±2.43 | 96.83±2.22 | 4.9±1.59 | |||
| F15 | 0 | 0 | 0 | 31.44±1.09 | 48.76±2.81 | 73.27±2.71 | 98.95±2.65 | 4.7±1.74 | |||
| F16 | 0 | 0 | 0 | 32.20±0.92 | 47.00±2.73 | 72.64±2.14 | 97.53±2.95 | 4.3±1.38 | |||
| F17 | 0 | 0 | 0 | 32.11±0.98 | 48.29±2.99 | 74.5±2.54 | 99.85±2.29 | 4.1±1.29 | |||
| F18 | 0 | 0 | 0 | 32.2±1.22 | 47.00±2.15 | 71.08±2.28 | 96.48±2.07 | 4.3±1.76 | |||
| F19 | 0 | 0 | 0 | 31.76±2.06 | 48.95±2.20 | 74.44±2.42 | 96.44±2.73 | 4.2±1.54 | |||
| F20 | 0 | 0 | 0 | 31.84±1.17 | 49.76±2.12 | 72.22±2.38 | 97.33±2.05 | 4.5±1.56 | |||
| Factors* | |||||||||||
| –α | –1 | 0 | +α | ||||||||
| A | 1:2.65 | 1:3 | 1:3.5 | 1:4 | |||||||
| B | 76.59 | 80 | 85 | 90 | |||||||
| C | 16.59 | 20 | 25 | 30 | |||||||
Table 2: Experimental matrix for the central composite design and results
In vitro drug release study
The in vitro drug release study was performed using USP XXIV type II paddle apparatus using 900 ml 0.1 N HCl (pH=1.2) at 50 rpm at 37±0.5°. The samples were withdrawn at predetermined time intervals for a period of 12 h and replaced with the fresh medium. The samples were filtered through 0.45 μm membrane filter, suitably diluted and analysed at 267 nm using double beam UV/Vis spectrophotometer. The content of drug was calculated using the equation generated from a standard calibration curve. The test was performed in triplicate. High reproducibility of data was obtained (SD±3%), hence only average values were considered.
Mechanism of the in vitro release
The drug release data were evaluated by the model−dependent (curve fitting) method. In the present study, the Korsmeyer−Peppas model describing drug release from polymeric system was used. This model takes into account that the drug−release mechanism often deviates from the Fick’s law and follows anomalous behaviour described by the following Eqn [22], Mt/M∞=k.tn...(1), where, Mt is the drug released at time t, M∞ the quantity of drug released at infinite time, k the kinetic constant and n is the release exponent. The value of n is related to the geometrical shape of the delivery systems and determines the release mechanism.
The release data were further treated according to Higuchi equation: Q = k.t1/2.... (2), where, Q is the percent of drug released at time t and k is the kinetic constant.
The value of n in Eqn. (1) determines the mechanism of drug release. When n approximates to 0.5, a Fickian/diffusion−controlled release is implied, where 0.5<n<1.0 nonFickian transport and for n=1 zero order (case II transport). When n approaches 1.0, phenomenologically, one may conclude that the release is approaching zero order [23].
Optimisation process by desirability function
The main aim of formulation development was to determine the optimum levels of variables, which affect a process and finished product gets the best possible characteristics. The application of desirability function combines all the responses in one measurement and gives possibility to predict the optimum levels for the independent variables [24]. The combination of the responses in one desirability function requires the calculation of the individual desirability functions. Global desirability represents the quality of the compromise individual desirability functions using the Stat Ease Inc. (Minneapolis, MN, USA) Design Expert® 7.6.1 software.
Statistical analysis
The statistical analysis of the central composite design batches was performed using Sigma Stat software. To evaluate the contribution of each factor to the effects on the responses, two−way analysis of variance (ANOVA) was performed using the Sigma State software (Sigma State 3.5. SPSS, Chicago, USA). To graphically show the influence of each factor on the responses, the contour plots were generated using Stat Ease, Inc. (Minneapolis, MN, USA) Design Expert® 7.1.6 software. The significance level was considered to be P<0.05.
Results and Discussion
Prior to compression, various parameters were evaluated for physical properties. The bulk densities for the powders of various formulations ranged between 0.721±0.063 g/ml and 1.364±0.64 g/ml, as determined by the tap method. This value of bulk density is indicative of good packing character. The CI for all the formulations was found to be below 17%, indicating good flow properties. The flow properties of granules were further analysed by determining the angle of repose for all granules which ranged between 25.98±0.63º and 31.96±0.79º. The value indicates good flow property of powders.
The pharmacokinetic parameters of baclofen [25] were used to calculate a theoretical drug release profile for 12 h dosage form. The immediate−release part and sustained−release part (maintenance dose) for baclofen bilayer tablet was calculated using Eqns. 3 and 4 [26] and was found to be 13 mg and 27 mg, respectively, hence total dose is 40 mg.
Immediate release part = (Css×Vd)/F....(3), Maintenance dose = (Ci ×Tc×τ)/F....(4), where, Css is steady−state plasma concentration (average Cmax) (ng/ml), Vd is volume of distribution (L/kg), and F is fraction bioavailable, Ci is clearance, ? is time up to which sustain release is required. Hence, the formulation should release 13 mg (32.5%) of drug in 1 h. In the remaining 11 h, the drug release should be (40−13) = 27 mg. So every 1 h, 2.45 mg (6.12%) drug is released till 12 h thereafter. Considering the above facts, theoretical release profile was generated. To match theoretical release profile, the criteria for optimisation of various responses like, Q1, Q4, Q8, Q12 and hardness were kept as, 33, 51, 75.5, 98% and 4.5 kg/cm2, respectively.
Different immediate−release formulations were prepared and optimised. These optimised formulations of immediate−release dose were then mixed with sustained−release formulations at central composite design. The compressed tablets were evaluated for their hardness, weight variation, friability, content uniformity and diameter. As shown in Table 3, all the parameters were found to be within range.
Methocel® K4M, and K100M was used because it was reported that with increase in molecular weight of HPMC matrix, increase matrix thickness within 30 min [27]. Apart from its swelling properties, higher molecular weight HPMC did not erode to a significant extent due to its higher intrinsic water−holding capacity [28]. Such properties rectified the burst effect and enhanced prolonged release.
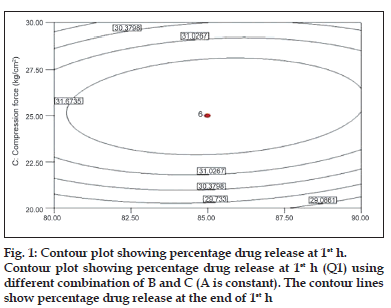
To describe the entire dissolution profile, four time points were considered. Percentages of drug release at 1, 4, 8 and 12 h. Fig. 1 shows the contour plot for the effect of each parameter on the drug release at 1 h. Examining the sign of the effects, it is possible to determine the necessary condition to obtain maximum responses. In addition, when a factor has a positive effect, the response is higher at the higher levels of the factor, and vice versa. The analysis of overall data indicated that the compression force (C) had the most pronounced positive effect on the drug release at 1 h with statistically significant P value (P<0.05).
was observed that at low compression force, drug released from bilayer tablet increases, this could be due to initial release of immediate part of tablet formulation at 1 h. However, drug release becomes slower with increasing the applied force. At 1 h, observed effect may be attributed to fact that the increasing compression force reduces the porosity of matrix leading to slower water uptake and water front movement into the matrix, which in turn, may lead to slower drug release [29].
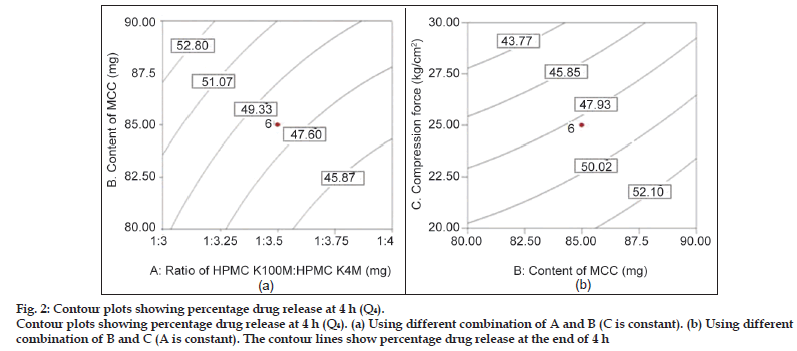
Fig. 2 shows the influence of all three independent factors on percentage drug release at 4 h (Q4). From the ANOVA and regression analysis, it was observed that all three factors contributed significantly to Q4 (P<0.05) (Table 4). The drug release at 4 h (Q4 ) was found to be decreased with increased ratio of HPMC K100M: HPMC K4M, and increased with increased amount of microcrystalline cellulose (MCC). This period is generally termed as the period of establishment of fully swollen gel layer depending upon the concentration of polymer present and other component of the system mainly filler. In present study, it was observed that applied compression forces influence the drug release rate (P<0.05). An increase in compression force results in slower drug release because the porosity of the matrices may be reduced with increasing compression force by changing the dimensions of interparticulate voids, leading to slower water uptake and water front movement into the matrix, which in turn, may lead to slower drug release [30]. Observed effect is shown in contour plot of factor AB (C is constant) and BC (A is constant).
| Formulation code | Disintegrationtime (s) | Hardness(kg/cm2) | Weightvariation (mg) | Friability (%) |
|---|---|---|---|---|
| F1 | 1.4±0.15 | 4.3±0.007 | 300±0.76 | 0.71±0.0028 |
| F2 | 1.8±0.20 | 5.8±0.15 | 305±0.516 | 0.82±0.0026 |
| F3 | 2.0±0.23 | 3.5±0.133 | 305±0.517 | 0.62±0.0021 |
| F4 | 1.4±0.11 | 6.2±0.13 | 302±0.70 | 0.49±0.0020 |
| F5 | 1.5±0.24 | 5.3±0.23 | 305±0.50 | 0.63±0.0045 |
| F6 | 2.6±0.19 | 5.7±0.13 | 310±0.426 | 0.80±0.0021 |
| F7 | 2.4±0.18 | 5±0.18 | 308±0.902 | 0.72±0.0045 |
| F8 | 1.6±0.18 | 5.7±0.004 | 296±0.510 | 0.50±0.0027 |
| F9 | 2.3±0.32 | 5.3±0.05 | 301±0.28 | 0.63±0.0022 |
| F10 | 1.7±0.25 | 5.9±0.11 | 295±0.790 | 0.49±0.0032 |
| F11 | 1.2±0.29 | 4.9±0.14 | 304±0.379 | 0.63±0.0059 |
| F12 | 2.7±0.42 | 5.4±0.23 | 308±0.271 | 0.51±0.0042 |
| F13 | 1.7±0.32 | 4.5±0.03 | 290±0.267 | 0.42±0.0027 |
| F14 | 2.4±0.27 | 4.9±0.18 | 300±0.51 | 0.29±0.0029 |
| F15 | 3.2±0.31 | 4.7±0.03 | 300±0.627 | 0.64±0.0020 |
| F16 | 1.7±0.17 | 4.3±0.36 | 305±0.29 | 0.69±0.0011 |
| F17 | 2.5±0.20 | 4.1±0.12 | 295±0.983 | 0.72±0.0020 |
| F18 | 2.8±0.15 | 4.3±0.03 | 295±0.541 | 0.80±0.0028 |
| F19 | 3.1±0.19 | 4.2±0.02 | 300±0.70 | 0.52±0.0023 |
| F20 | 2.8±0.16 | 4.5±0.15 | 303±0.26 | 0.39±0.0056 |
| RJ1 | 2.6±0.17 | 4.6±0.19 | 302±0.21 | 0.35±0.0050 |
Table 3: Postcompression parameters of all formulation.
Figure 2:Contour plots showing percentage drug release at 4 h (Q4).
Contour plots showing percentage drug release at 4 h (Q4). (a) Using different combination of A and B (C is constant). (b) Using different combination of B and C (A is constant). The contour lines show percentage drug release at the end of 4 h.
| Regression model | R2 | Adjusted R2 | Model P value | % CV | Adequate precision |
|---|---|---|---|---|---|
| Q 1 =24.96+0.47C-2.28C2 | 0.9358 | 0.886 | 0.00 | 3.21 | 14.00 |
| Q4=44.30-2.79A+2.41B-3.84C | 0.9061 | 0.8297 | 0.000 | 6.68 | 13.50 |
| Q 8 =72.99-3.10A+4.95B-2.08C+2.95B2 | 0.9846 | 0.9494 | 0.000 | 4.26 | 11.05 |
| Q 12 =97.78-1.89A+2.21B-0.98A2 | 0.9494 | 0.9050 | 0.000 | 1.29 | 11.25 |
| Hardness=6.05+0.72C+0.16BC | 0.9422 | 0.9268 | 0.000 | 3.51 | 19.19 |
Table 4: Reduce response models and statistical parameters obtainded from anova (after backward elimination)
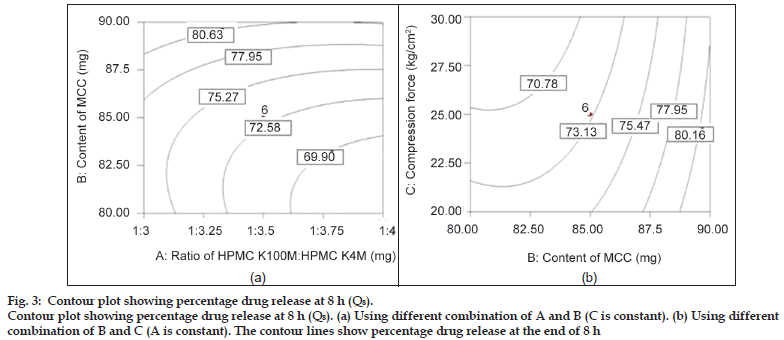
Fig. 3 shows the influence of all three independent factors on percentage drug release at 8 h (Q8). From the ANOVA and regression analysis, it was observed that all the three factors contributed to Q8 (P<0.05), (Table 4). This period may be generally termed as the period of dominance of erosion as it is expected that the water−front may reach the central core of the matrices for rapidly hydrating the highly hydrophilic polymer. The degree of erosion was dependent on the strength of the gel layer formed depending upon the content of HPMC and the filler. However, the major factor influencing drug release at 8 h was the amount of diluent MCC and compared to other factors; the compression force had the least effect at 8 h. It could be due to enough hydrophilicity of matrix which governs the drug release.
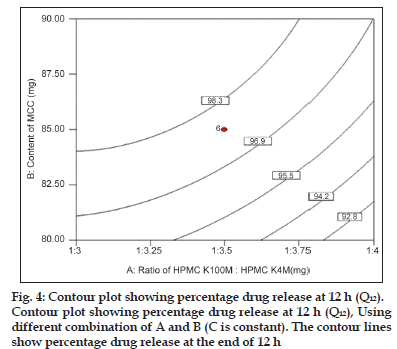
Fig. 4 shows the contour plot for the effect of parameters on the drug release at 12 h (end phase of dissolution profile). The analysis of overall data indicated that the HPMCs and content of MCC had the most influencing effect on the drug release at 12 h with statistically significant P value (P<0.05). It was observed that drug release at 12 h was inversely proportional to ratio of polymer and proportional to content of MCC.
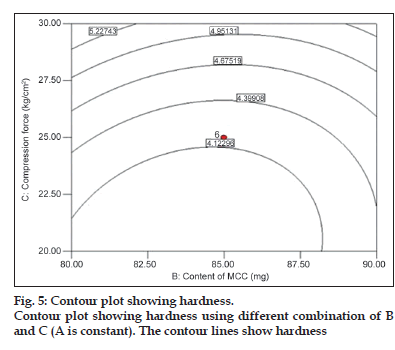
Among the three independent factors, only compression force had significant role on hardness (P<0.05). It shows a nearly linear ascending pattern for the values of hardness, as the compression force is increased (fig. 5).
Figure 3:Contour plots showing percentage drug release at 4 h (Q4).
Contour plots showing percentage drug release at 4 h (Q4). (a) Using different combination of A and B (C is constant). (b) Using different combination of B and C (A is constant). The contour lines show percentage drug release at the end of 4 h.
To obtain a simple yet realistic model, the insignificant terms (P>0.05) are eliminated from the model through ‘backward elimination’ process. The statistical data obtained from ANOVA for the reduced models are given in Table 4. Since R2 always decreases when a regressor variable is eliminated from a regression model, in statistical modelling, the adjusted R2 which takes the number of regressor variables into account, is usually selected [31]. In the present study, the adjusted R2 were well within the acceptable limits of R2≥0.80 [32] which revealed that the experimental data show a good fit with the second−order polynomial equations. For all the reduced models, P value of <0.05 is obtained, implying these models are significant. The adequate precision value is a measure of the ‘signal (response) to noise (deviation) ratio.’ A ratio greater than 4 is desirable [33]. In this study, the ratio was found to be in the range of 11.05−20.85, which indicates an adequate signal and therefore the model is significant. The coefficient of variation (CV) is a measure of reproducibility of the model and as a general rule, a model can be considered reasonably reproducible if it is less than 10% [33].
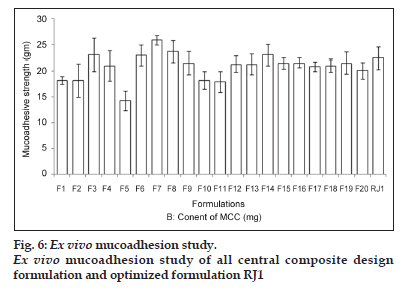
As the concentration of HPMC was increased in the formulation, the mucoadhesion was also found to increase (fig. 6). It could be due to a glass−rubbery transition which provides plasticisation to hydrogel resulting in a large adhesive surface for maximum contact with mucin and flexibility to the polymer chains for interpenetration with mucin resulting consequently in the augmentation of bioadhesive strength.
The release kinetics of all the formulations were checked by fitting the release data to various kinetic models, and the release was best fitted to nonFickian diffusion mechanism. It was further confirmed by fitting the data to the Korsmeyer−Peppas equation and the n value for all the formulations obtained between 0.173 and 0.473, and this revealed that the release followed the nonFickian diffusion mechanism (i.e. diffusion coupled with erosion). The R2 values for all the models are shown in Table 5.
The procedure followed in this work for simultaneous optimisation of the three responses is a modification of the method developed by Derrin and Suich [34,35]. The method involves transformation of each predicted response to a dimensionless partial desirability function (di) which includes the researcher’s priorities and desires when building the optimisation procedure. One or two−sided functions are used, depending on whether each n responses has to be maximised or minimised, or has an allotted target value. The partial desirability functions are then combined into a single composite response, the so−called global desirability function (D) defined as the geometric mean of the different (di). This means the desirability function combines all the responses in one measurement and gives possibility to predict the optimum levels of all the independent variables. In the present work, global desirability function was calculated using the Stat Ease, Inc. (Minneapolis, MN, USA) Design Expert® 7.1.6 software.
| Formulation | Zeroorder R2 | Firstorder R2 | Higuchi R2 | Korsemeyer-Peppas | |
|---|---|---|---|---|---|
| N | R2 | ||||
| F1 | 0.966 | 0.857 | 0.980 | 0.408 | 0.846 |
| F2 | 0.968 | 0.969 | 0.989 | 0.361 | 0.873 |
| F3 | 0.954 | 0.846 | 0.991 | 0.386 | 0.878 |
| F4 | 0.966 | 0.857 | 0.970 | 0.343 | 0.810 |
| F5 | 0.945 | 0.812 | 0.982 | 0.312 | 0.836 |
| F6 | 0.973 | 0.885 | 0.975 | 0.366 | 0.820 |
| F7 | 0.972 | 0.874 | 0.985 | 0.405 | 0.843 |
| F8 | 0.965 | 0.858 | 0.993 | 0.378 | 0.853 |
| F9 | 0.968 | 0.953 | 0.955 | 0.473 | 0.780 |
| F10 | 0.970 | 0.944 | 0.971 | 0.382 | 0.812 |
| F11 | 0.981 | 0.931 | 0.994 | 0.319 | 0.771 |
| F12 | 0.971 | 0.917 | 0.985 | 0.343 | 0.800 |
| F13 | 0.963 | 0.928 | 0.994 | 0.288 | 0.839 |
| F14 | 0.960 | 0.956 | 0.970 | 0.282 | 0.820 |
| F15 | 0.963 | 0.957 | 0.980 | 0.370 | 0.833 |
| F16 | 0.959 | 0.943 | 0.981 | 0.362 | 0.864 |
| F17 | 0.969 | 0.848 | 0.985 | 0.366 | 0.853 |
| F18 | 0.956 | 0.945 | 0.986 | 0.355 | 0.864 |
| F19 | 0.969 | 0.795 | 0.977 | 0.173 | 0.890 |
| F20 | 0970 | 0.924 | 0.981 | 0.188 | 0.901 |
Table 5: Correlation coefficients of different pharmacokinetics models for baclofen release
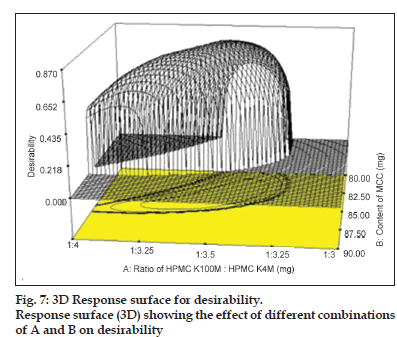
Figure 7:3D Response surface for desirability.
Response surface (3D) showing the effect of different combinations of A and B on desirability
A value different from zero implies that all responses are in a desirable range simultaneously and consequently, for a value of D close to 1, the combination of the different criteria is globally optimal, so as the response value are near target values. The criteria for optimisation of various responses like Q1, Q4, Q8 and Q12 were kept as maximum, 33, 51, 75.5 and 98%, respectively. Criteria have been proposed based on theoretical release profile obtained using pharmacokinetics parameters for baclofen. The relative importance is a comparative scale for weighting each of the resulting individual desirability in the global desirability. Relative importance varies from the minimum (=1) to the maximum (=5). In the present study, the software takes the relative importance medium (=3) for all the independent variables for set target. As can be seen under criteria, all the responses were targeted in order to get desired release profile consideration in range. Following the conditions and restrictions above, the optimisation procedure was carried out. The coordinates produce the maximum desirability value (D=1) with amounts of various independent variables as shown in Table 6. The partial desirability functions di of each of the responses and the calculated geometric mean as the maximum global desirability function (D=0.8648) are presented in fig. 7 in which di varies from 0 to 1, depending upon the closeness of the responses to its target value. The predicted response values corresponding to the global desirability function were: Q1=32.02%, Q4=49.88%, Q8=75.50%, Q12=98.65% and hardness=4.5 kg/cm2. This formulation was further checked practically to compare the predicted values and it showed 31.64, 45.82, 73.27, 98.95%, 4.4 kg/cm2 for Q1, Q4, Q8, Q12 and hardness, respectively, which were very close to the predicted values obtained from desirability function. The optimised formulation (RJ1) also passed the precompression and postcompression parameters (Table 2). The response surfaces showed that the highest values for desirability could be obtained at a medium level of ratio of HPMC K100M:HPMC K4M, moving from low to medium level of content of MCC and moving from low to medium level of compression force. Moreover, medium ratio of polymer was necessary for high desirability, medium concentration of MCC and medium compression force also gives higher desirability
| Optimum conditions | A | B | C | Q 1(%) | Q4(%) | Q8(%) | Q12(%) | Hardness (kg/cm2) | ||||||||
|---|---|---|---|---|---|---|---|---|---|---|---|---|---|---|---|---|
| Desirability value (D)=0.8648 | ||||||||||||||||
| 1 | 1:3.51 | 85.45 | 26.20 | |||||||||||||
| Predicted | 32.02 | 49.88 | 75.50 | 98.65 | 4.5 | |||||||||||
| Experimental | 31.64 | 45.82 | 73.27 | 98.95 | 4.4 | |||||||||||
Table 6: Comparison of predicted and experimental values of variables under the optimum conditions
This study demonstrates a use of a central composite design, global desirability function in optimisation of mucoadhesive dosage form containing the narrow absorption window drug baclofen. The amount of HPMC and amount of microcrystalline cellulose has significant influence on mucoadhesion and in vitro drug release. Statistical model generated using the multiple linear regression and global desirability function showed good predicative power for the experimental value. Based on the results, it can be concluded that the statistical tools like global desirability and central composite design are quite helpful in understanding the interaction/s between different independent variables and for rapid formulation development.
References
- Anderson MJ. Trimming the FAT out of experimental methods. USA: Optical Engineering Magazine; 2005. p. 29.
- Bolton S, Bon C. Pharmaceutical Statistics – Practical and Clinical Applications. 4th ed. New York: Marcel Dekker Inc.; 2004. p. 212-8.
- Kollipara S, Bende G, Movva S, Saha R. Application of rotatable central composite design in the preparation and optimization of poly (lactic-co-glycolic acid) nanoparticles for controlled delivery of paclitaxel. Drug DevInd Pharm 2010;36:1377-87.
- Abu-Izza KA, Garcia-Contreras L, Lu DR. Preparation and evaluation of sustained release AZT-loaded microspheres: Optimization of the release characteristics using response surface methodology. J Pharm Sci 1996;85:144-9.
- Hoffman A, Stepensky D, Lavy E, Eyal S, Klausner E, Friedman M. Pharmacokinetic and pharmacodynamic aspects of gastroretentive dosage forms. Int J Pharm 2004;277:141-53.
- Hwang SJ, Park H, Park K. Gastric retentive drug-delivery systems. Crit Rev Ther Drug Carrier Syst 1998;15:243-84.
- Singh B, Ahuja N. Development of controlled-release buccoadhesive hydrophilic matrices of diltiazem hydrochloride: Optimization of bioadhesion, dissolution, and diffusion parameters. Drug DevInd Pharm 2002;28:431-42.
- Bardonnet PL, Faivre V, Pugh WJ, Piffaretti JC, Falson F. Gastroretentive dosage forms: Overview and special case of Helicobacter pylori. J Control Release 2006;111:1-18.
- Streubel A, Siepmann J, Bodmeier R. Gastroretentive drug delivery systems. Expert Opin Drug Deliv 2006;3:217-33.
- Liu H, Pan W, Ke P, Dong Y, Ji L. Preparation and evaluation of a novel gastric mucoadhesive sustained-release acyclovir microsphere. Drug DevInd Pharm 2010;36:1098-105.
- Peppas NA. Devices based on intelligent biopolymers for oral protein delivery. Int J Pharm 2004;277:11-7.
- Bruschi ML, de Freitas O. Oral bioadhesive drug delivery systems. Drug DevInd Pharm 2005;31:293-310.
- Davis SS. Formulation strategies for absorption windows. Drug Discov Today 2005;10:249-57.
- Ahuja S. Analytical Profiles of Drug Substances. Vol. 14. London: Elsevier Publishers; 1995. p. 527-47.
- Singh B, Ahuja N. Development of controlled-release buccoadhesive hydrophilic matrices of diltiazem hydrochloride: Optimization of bioadhesion, dissolution, and diffusion parameters. Drug DevInd Pharm 2002;28:431-42.
- Chowdary KP, Suresh B. Design and evaluation of diltizemmucoadhesive tablets for oral controlled release. Saudi Pharm J 2003;11:201-5.
- Lee BJ, Ryu SG, Cui JH. Formulation and release characteristics of hydroxypropyl methylcellulose matrix tablet containing melatonin. Drug DevInd Pharm 1999;25:493-501.
- Aulton ME. Powder flow. Pharmaceutics – The Science of Dosage form Design. 2nd ed. London: Churchill Livingston; 2002. p. 207-8.
- Martin A, Bustamante P, Chun A. Micromeritic. In: Physical Pharmacy-Physical Chemical Principles in the Pharmaceutical Sciences. 4th ed. Baltimore: Lippincott Williams and Wilkins; 2002. p. 446-8.
- Jivani RR, Patel CN, Jivani NP. Design and development of a self correcting monolithic gastroretentive tablet of baclofen. Sci Pharm 2009;7:651-67.
- Singh B, Ahuja N. Development of controlled-release buccoadhesive hydrophilic matrices of diltiazem hydrochloride: Optimization of bioadhesion, dissolution, and diffusion parameters. Drug DevInd Pharm 2002;28:431-42.
- Singh BN, Kim KH. Floating drug delivery systems: An approach to oral controlled drug delivery via gastric retention. J Control Release 2000;63:235-59.
- Yang GM, Kuo JF, Woo EM. Preparation and control-release kinetics of isosorbidedinitrate microspheres. J Microencapsul 2006;23:622-31.
- Lewis GA, Mathieu D, Phan-Tann-Luu R. Pharmaceutical Experimental Design. New York: Marcel Dekker; 1999. p. 265-76.
- Kochak GM, Rakhit A, Wagner WE, Honc F, Waldes L, Kershaw RA. The pharmacokinetics of baclofen derived from intestinal infusion. Clin PharmacolTher 1985;38:251-7.
- Dave BS, Amin AF, Patel MM. Gastroretentive drug delivery system of ranitidine hydrochloride: Formulation and in vitro evaluation. AAPS PharmSciTech 2004;5:77-82.
- Wan LS, Heng PW, Wong LF. Matrix swelling: A simple model describing extend of swelling of HPMC matrices. Int J Pharm 1995;116:159-68.
- Chaibva FA, Khamanga SM, Walker RB. Swelling, erosion and drug release characteristics of salbutamol sulfate from hydroxypropylmethylcellulose-based matrix tablets. Drug DevInd Pharm 2010;36:1497-510.
- Levina M. Influnce of fillers, compression force, film coating and storage condition on performance of Hypromellose matrix. Drug Dev Tech 2004;4:34-42.
- Gupta P, Bansal AK. Patent opportunities in matrix-based oral controlled release drug delivery systems, Part II. Pharm Tech Eur 2002;10:47-54.
- Parajo JC, Alonso JL, Lage MA, Vazquez D. Empirical modeling of eucalyptus wood processing. Bioprocess Eng 1992;8:129-36.
- Lundstedt T, Seifert E, Abramo L, Thelin B, Nystro A, Pettersen J, et al. Experimental design and optimization. ChemomIntell Lab Syst1998;42:3-40.
- Beg Q, Sahai V, Gupta R. Statistical media optimization and alkine protease production from Bacillus mojavensis bioreactor. Process Biochem 2003;39:203-9.
- Derringer G, Suich R. Simultaneous optimization of several response variables. J QualTechnol 1980;12:214-9.
- Holm R, Jensen IH, Sonnergaard J. Optimization of self-microemulsifying drug delivery systems (SMEDDS) using a D-optimal design and the desirability function. Drug DevInd Pharm 2006;32:1025-32.
