- *Corresponding Author:
- Hongzhang Li
Department of Gastroenterology, Sanmen People’s Hospital, Sanmen, Zhejiang 317100, People’s Republic of China
E-mail: zhongcvrpdjy063@163.com
| This article was originally published in a special issue, “Role of Biomedicine in Pharmaceutical Sciences” |
| Indian J Pharm Sci 2023:85(2) Spl Issue “17-22” |
This is an open access article distributed under the terms of the Creative Commons Attribution-NonCommercial-ShareAlike 3.0 License, which allows others to remix, tweak, and build upon the work non-commercially, as long as the author is credited and the new creations are licensed under the identical terms
Abstract
The present study aims to explore the clinical value of pepsinogen II and gastritis detection. Firstly, serum expressions of pepsinogen II in patients with Helicobacter pylori-caused gastritis, gastric ulcer and atrophic gastritis were detected using enzyme-linked immunosorbent assay, followed by statistical analysis. In comparison with the normal group, serum pepsinogen II levels were increased in the above groups (p<0.01). Next, the positive cut-off value for pepsinogen II in detecting gastritis was obtained by the receiver operating characteristic curve. When the value of pepsinogen II was 10.55 μg/l, the specificity and sensitivity was 83.6 % and 74.4 % in the diagnosis of Helicobacter pylori-causing gastritis, 81.6 % and 80.0 % in gastric ulcer and 81.6 % and 53.1 % in atrophic gastritis. Thus, pepsinogen II at 10.55 μg/l was recommended as the positive cut-off value in gastritis detection. Besides, we observed that the ribonucleic acid and protein expressions of pepsinogen II in different gastritis groups were up-regulated by Western blotting and real-time polymerase chain reaction. Moreover, the immunohistochemistry indicated that pepsinogen II was highly expressed in gastritis tissues compared with normal controls. In conclusion, pepsinogen II could be an independent indicator in gastritis detection.
Keywords
Pepsinogen II, gastritis, Helicobacter pylori, serological screening, enzyme-linked immunosorbent assay
Gastritis is histologically defined as the inflammation of the gastric mucosa and it is a frequent, severe and occult disease in human life. In clinic, it generally can be divided into chronic and acute ones. Based on etiology, it contains Helicobacter pylori (H. pylori) related, atrophic and autoimmune gastritis [1] and so on [2]. There is a wealth of information that gastric atrophy is a substantial risk for the incidence of Gastric Cancer (GC)[3]. Over 50 % people in the world are affected by this disease and millions of people pass away each year as a sresult of GC or ulcers caused by gastritis[4,5]. These indicate that gastritis is ruining the health of hundreds of millions of people globally.
Currently, serological screening of stomach, especially for Pepsinogen (PG), gastrin-17 and H. pylori antibodies, is a non-invasive, simple and low- cost technique that has been widely used in screening for GC and precancerous lesions. In some countries like Japan and China, serological screening has been listed in the national plan for GC prevention and control[6,7]. PG is an inactive precursor of pepsin. Based on biochemistry and immune activity, human PG could be further classified into two subgroups, namely PG I and PG II. PG I is chiefly produced by main cells and mucus neck cells in gastric glands, whereas PG II by gastric glands, pyloric glands and Brunner’s glands in proximal duodenum[8,9]. Previously, only the ratio between PG II and PG I is applied in clinical tests and few studies have reported the clinical significance of PG II in gastric diseases[10-14].
Herein, this study aims to explore the clinical value of PG II in different gastritis. We analyzed the differential expressions of PG II in patients with H. pylori caused gastritis, gastric ulcer, atrophic gastritis and set normal people as controls and the relative expressions of PG II were also detected in gastritis samples by functional experiments. This study will update the knowledge of gastritis pathogenesis and offer a scientific foundation for the exploration of new diagnostic biomarkers in gastritis.
Materials and Methods
General information:
All the patients involved in this study received gastroscopy in Anhui province and Zhejiang province between 2014 and 2018, diagnosed by gastroscopy and pathological examination. No patient had a history of special medication in 2 w before the examination and patients with acute upper gastrointestinal hemorrhage could not participate in this study. These patients were classified into 3 groups; H. pylori caused gastritis (n=853), gastric ulcer (n=121) and atrophic gastritis (n=188), compared with healthy control (n=929). For serum PG II detection, 3 ml of fasting blood was collected and the serum was immediately isolated and preserved at -20°. The Enzyme-Linked Immunosorbent Assay (ELISA) kit from Biohit (Finland) was used for the measurement (Table 1). Then, all the data were analyzed by Receiver Operator Characteristic (ROC) curve analysis to calculate the sensitivity and specificity of the diagnosis indicators.
Quantitative Real-Time Polymerase Chine Reaction (qRT-PCR):
qRT-PCR was conducted by SYBR Premix Extaq (Takara, United States of America (USA)). Endogenous Beta (β)-actin expression was the standardized control. The primers were listed below; PG II, 5′-TCACCAGCATTCCTCAAGGT-3′ and 5′-CCAAGTGAAGCTCCCTCAGA-3′; β-actin, 5′-CCCTGGAGAAGAGCTACGAG-3′ and 5′-GGAAGGAAGGCTGGAAGAGT-3′. The
2-ΔΔCt method was adopted to calculate pertinent expression. qRT-PCR was conducted in H. pylori caused gastritis, gastric ulcer, atrophic gastritis and healthy control groups and each had 30 samples.
Western Blot (WB) analysis:
In Radioimmunoprecipitation Assay (RIPA) buffer, the entire protein was lysed and extracted. The proteins were separated using a 10 % Sodium Dodecyl Sulphate (SDS) polyacrylamide gel. The membranes were maintained overnight at 4° with antibodies to PG II (Affinity, DF6543, 1:1000) or β-actin (Zs-BIO, TA-09, 1:1000) after adding 5 % fat-free milk for 1 h. Phosphate Buffered Saline With Tween 20 (PBST) was applied to rinse blots and then they were cultured with the secondary antibody for 1 h. Each group with 5 samples, respectively.
Immunohistochemistry (IHC) analysis:
IHC was performed on paraffin-embedded tissue slices. After dewaxing with xylene, dehydration with gradient ethanol and antigen retrieval with sodium citrate buffer solution in a microwave, the peroxidase was blocked with a 3 % Hydrogen peroxide (H2O2) blocker. Sections were sealed in 5 % Bovine Serum Albumin (BSA) with the primary antibody (PG II, BIOHIT Healthcare, China, diluted at 1:500) and put in a humid incubator at 4° overnight. The next day, Phosphate-Buffered Saline (PBS) was adopted to wash the slices for 3 times and the prepared universal secondary antibody was cultured. Then, color development was achieved via Diaminobenzidine (DAB). The images were collected under a microscope.
Statistical analysis:
Statistical Package for Social Sciences (SPSS) 17.0 software was applied to analyze the statistics. The data were presented as mean±Standard Deviation (SD). Intergroup comparison was made by Analysis of Variance (ANOVA). p<0.05 indicated significance in statistics.
Results and Discussion
According to the study, the level of serum PG II in H. pylori caused gastritis group (16.24±8.60 μg/l) was substantially higher compared with healthy control (7.48±4.89 μg/l). The other two groups, gastric ulcer (17.79±9.28 μg/l) and atrophic gastritis (13.20±9.72 μg/l), were also significantly higher (p<0.01, Table 1).
| Group | No. | PG II (μg/l) |
|---|---|---|
| Healthy control | 929 | 7.48±4.89 |
| H. pylori caused gastritis | 853 | 16.24±8.60* |
| Gastric ulcer | 121 | 17.79±9.28* |
| Atrophic gastritis | 188 | 13.20±9.72* |
Note: *p<0.01, when compared with the healthy control
Table 1: Serum Expressions of PG II in Different Groups by ELISA
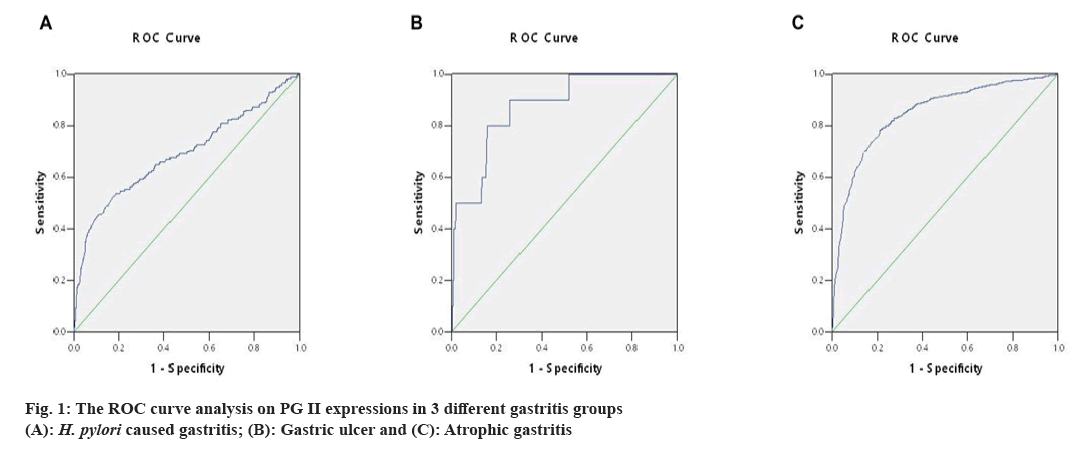
The ideal cut-off value was chosen as the point closest to the upper-left corner of the ROC curve, so the ROC curve's Area Under Curve (AUC) was determined. The above measurement data were then analyzed by ROC curve. When the value of PG II was 10.55 μg/l, the specificity and sensitivity were 83.6 % and 74.4 % in H. pylori caused gastritis group (AUC=0.848, fig. 1A), 81.6 % and 80.0 % in gastric ulcer group (AUC=0.872, fig. 1B) and 81.6 % and 53.1 % in atrophic gastritis group (AUC=0.691, fig. 1C). Thus, 10.55 μg/l PG II was consistent in detecting gastritis due to three different causes, it was recommended as the positive cut-off value in gastritis detection.
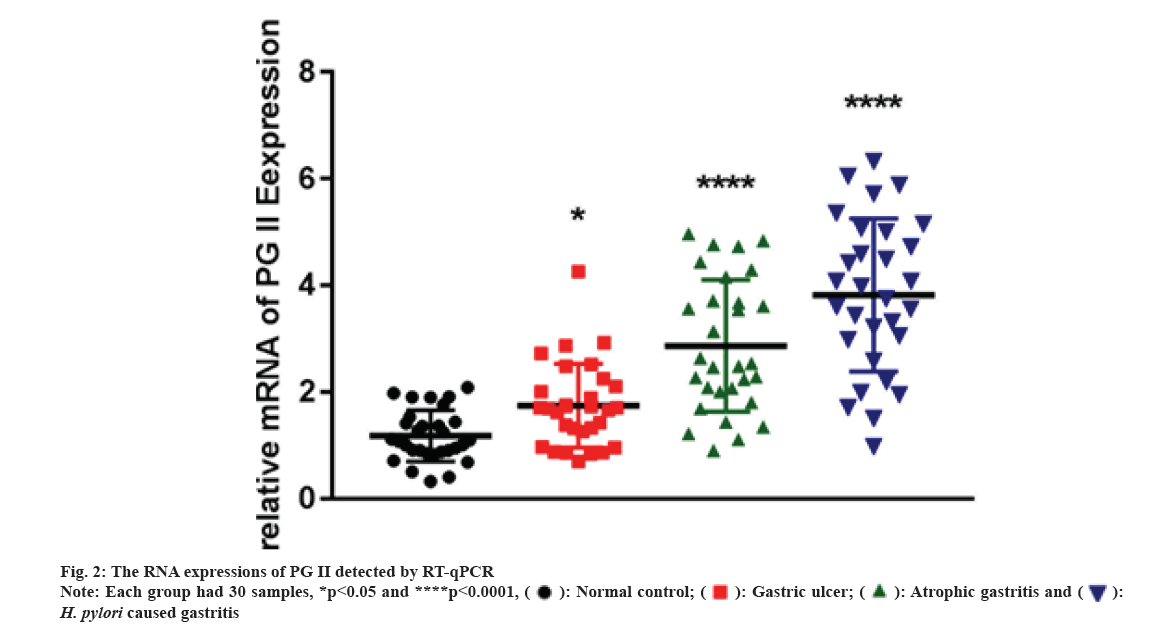
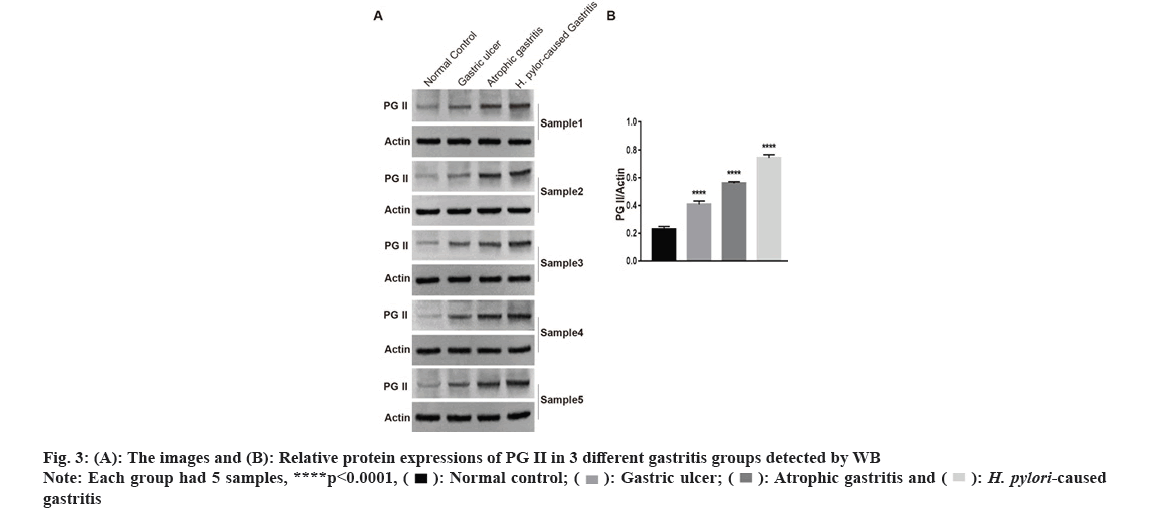
We carried out qRT-PCR assays to measure its expressions in gastritis samples (3 different groups) and normal tissues. As fig. 2 indicated, PG II, Ribonucleic Acid (RNA) expression was significantly up-regulated in the gastritis samples than that in normal tissues, especially in H. pylori caused gastritis group. In order to further explain the relationship between gastritis and PG II, WB was for measuring the protein expressions of PG II in 3 different groups of gastritis samples and normal tissues. The results showed that PG II protein expression levels were also significantly up-regulated in gastritis samples (fig. 3A and fig. 3B). Besides, the expression level of PG II was detected in different tissues by IHC. PG II was found to be highly expressed in tissue samples of 3 groups as shown in fig. 4A-fig. 4D.
PG is an inactive precursor of pepsin in gastric juice, as a polypeptide chain consisting of 375 amino acids. PG is synthesized by ribosome, secreted by the Golgi body and activated by hydrochloric acid to form pepsin[15]. Stomach is likely to be the only source of PG and the secretion volume varies at different stages. After synthesis, most PG would enter the gastric cavity and convert into pepsin after being activated by acidic gastric fluid. Moreover, a small amount of PG (about 1 %) would penetrate the mucosa and enter serum. When pathological changes occur in the gastric mucosa, the level of serum PG also changes. Thus, serum PG can reflect the secretion level of PG.
Based on biochemistry, immunogenicity, cellular origin and tissue distribution, there are two PG I (groups 1-5) and PG II (groups 6-7) subgroups[16,17]. As mentioned above, the serum levels of PG I and PG II could reflect the functions of gastric mucosa at different locations. Serum PG I and PG I/PG II ratio are significantly associated with atrophic gastritis and have been used for GC screening among high-risk populations in many countries[18-22]. For example, Biasco et al.[23] reported the decrease in the PG I:PG II ratio might be utilized to predict H. pylori infection and the Immunoglobulin G (IgG) antibody response to H. pylori in the blood. Su et al.[24] found that a low PG I/II ratio was not just a sign of atrophic gastritis, but of nutritional and metabolic health. However, the clinical application of PG II as an independent indicator has been rarely reported.
In this study, we analyzed the PG II levels in gastritis patients and the results suggested that patients with H. pylori caused gastritis (16.24±8.60 μg/l), gastric ulcer (17.79±9.28 μg/l) and atrophic gastritis (13.20±9.72 μg/l) all had significantly higher serum PG II as compared to the control (7.48±4.89 μg/l). By plotting the ROC curve, we defined the cut-off value for PG II in gastritis diagnosis by calculating AUC.
According to our results, when the value of PG II was 10.55 μg/l; the specificity and sensitivity was 83.6 % and 74.4 % with an AUC of 0.848 in diagnosing H. pylori caused gastritis, 81.6 % and 80.0 % with an AUC of 0.872, in diagnosing gastric ulcer and 81.6 % and 53.1 % with an AUC of 0.691 in diagnosing atrophic gastritis. For 3 different groups, the positive cut-off value of PG II was consistent in gastritis detection. Thus, 10.55 μg/l PG II is recommended as the positive cut-off value in gastritis diagnosis.
Besides, we found PG II had a high RNA and protein expressions in tissue samples of H. pylori caused gastritis, gastric ulcer and atrophic gastritis, especially H. pylori caused gastritis. H. pylori are a kind of spiral-shaped, micro-anaerobic bacteria only known microbial species surviving in stomach. The bacterial infection will cause chronic gastritis, which can lead to ulcers and atrophic stomach atrophy and even GC. Currently, it is believed that early detection and timely treatment of H. pylori infection is of importance for the prevention and controlling of GC.
This study demonstrates that PG II expression is closely related to the pathogenesis of H. pylori caused gastritis, gastric ulcer and atrophic gastritis. The findings confirm that PG II could be a critical value standard for gastritis diagnosis and offer a scientific foundation for the application of PG II in clinical test as an independent biomarker.
Funding:
This study was supported by the Research Programs of Zhejiang Provincial Medicine and Health Science and Technology Plan Project (2020KY1068), Basic Public Welfare Research Project of Zhejiang Province (LY19C010006), Project of Sanmen County Science and Technology Planning (No.16310) and Project of Hefei Health Commission (No. Hwk2020zd003).
Ethics approval:
This study was approved by the Department of Gastroenterology, Sanmen County People's Hospital and Ethics Committee of Third Affiliated Hospital of Anhui Medical University (Hefei, China). Signed informed consents were obtained from all participants before the study.
Author’s contributions:
Dongmei Gao and Jiaoe Chen have contributed equally to this work and Jun Zhao was considered as the co-corresponding author.
Conflict of interests:
The authors declared no conflict of interests.
References
- Lenti MV, Rugge M, Lahner E, Miceli E, Toh BH, Genta RM, et al. Autoimmune gastritis. Nat Rev Dis Primers 2020;6(1):56.
- Bacha D, Walha M, Slama B, Romdhane B, Bouraoui S, Bellil K, et al. Chronic gastritis classifications. La Tunisie Med 2018;96(7):405-10.
- Rugge M, Pennelli G, Pilozzi E, Fassan M, Ingravallo G, Russo VM, et al. Gastritis: The histology report. Dig Liver Dis 2011;43(4):S373-84.
[Crossref] [Google Scholar] [PubMed]
- Xie Y, Liu L. Analysis of correlation between HP infection and activation of PI3K/Akt pathway in mucosal tissues of gastric cancer and precancerous lesions. Oncol Lett 2018;16(5):5615-20.
[Crossref] [Google Scholar] [PubMed]
- Sipponen P, Maaroos HI. Chronic gastritis. Scand J Gastroenterol 2015;50(6):657-67.
[Crossref] [Google Scholar] [PubMed]
- Cai Q, Zhu C, Yuan Y, Feng Q, Feng Y, Hao Y, et al. Development and validation of a prediction rule for estimating gastric cancer risk in the Chinese high-risk population: A nationwide multicentre study. Gut 2019;68(9):1576-87.
[Crossref] [Google Scholar] [PubMed]
- Yanaoka K, Oka M, Mukoubayashi C, Yoshimura N, Enomoto S, Iguchi M, et al. Cancer high-risk subjects identified by serum pepsinogen tests: Outcomes after 10 y follow-up in asymptomatic middle-aged males. Cancer Epidemiol Biomarkers Prev 2008;17(4):838-45.
[Crossref] [Google Scholar] [PubMed]
- Samoff IM, Varis K, Ihamaki T, Siurala M, Rotter JI. Relationships among serum pepsinogen I, serum pepsinogen II and gastric mucosal histology. Gastroenterology 1982;83(1-2):204-9.
[Crossref] [Google Scholar] [PubMed]
- Gritti I, Banfi G, Roi GS. Pepsinogens: Physiology, pharmacology pathophysiology and exercise. Pharmacol Res 2000;41(3):265-81.
[Crossref] [Google Scholar] [PubMed]
- Chu S, Schubert ML. Gastric secretion. Curr Opin Gastroenterol 2012;28(6):587-93.
- Miki K, Urita Y. Using serum pepsinogens wisely in a clinical practice. J Dig Dis 2007;8(1):8-14.
[Crossref] [Google Scholar] [PubMed]
- Yu G, Wang GX, Wang HG, Mo FF, Tang BB. The value of detecting pepsinogen and gastrin-17 levels in serum for pre-cancerous lesion screening in gastric cancer. Neoplasma 2019;66(4):637-40.
[Crossref] [Google Scholar] [PubMed]
- Kishino T, Oyama T, Tomori A, Takahashi A, Shinohara T. Usefulness and limitations of a serum screening system to predict the risk of gastric cancer. Int Med 2020;59(12):1473-80.
[Crossref] [Google Scholar] [PubMed]
- di Mario F, Cavallaro LG. Non-invasive tests in gastric diseases. Dig Liver Dis 2008;40(7):523-30.
[Crossref] [Google Scholar] [PubMed]
- Kageyama T. Pepsinogens, progastricsins and prochymosins: Structure, function, evolution and development. Cell Mol Life Sci 2002;59:288-306.
[Crossref] [Google Scholar] [PubMed]
- Kang JM, Kim N, Yoo JY, Park YS, Lee DH, Kim HY, et al. The role of serum pepsinogen and gastrin test for the detection of gastric cancer in Korea. Helicobacter 2008;13(2):146-56.
[Crossref] [Google Scholar] [PubMed]
- Miki K. Gastric cancer screening using the serum pepsinogen test method. Gastric Cancer 2006;9(4):245-53.
[Crossref] [Google Scholar] [PubMed]
- Miki K. Gastric cancer screening by combined assay for serum anti-Helicobacter pylori IgG antibody and serum pepsinogen levels-“ABC method”. Proc Jpn Acad Ser B Phys Biol Sci 2011;87(7):405-14.
[Crossref] [Google Scholar] [PubMed]
- Cao Q, Ran ZH, Xiao SD. Screening of atrophic gastritis and gastric cancer by serum pepsinogen, gastrin-17 and Helicobacter pylori immunoglobulin G antibodies. J Dig Dis 2007;8(1):15-22.
[Crossref] [Google Scholar] [PubMed]
- Zhang X, Xue L, Xing L, Wang J, Cui J, Mi J, et al. Low serum pepsinogen I and pepsinogen I/II ratio and Helicobacter pylori infection are associated with increased risk of gastric cancer: 14-year follow up result in a rural Chinese community. Int J Cancer 2012;130(7):1614-9.
[Crossref] [Google Scholar] [PubMed]
- Mansour-Ghanaei F, Joukar F, Baghaee M, Sepehrimanesh M, Hojati A. Only serum pepsinogen I and pepsinogen I/II ratio are specific and sensitive biomarkers for screening of gastric cancer. Biomol Concepts 2019;10(1):82-90.
[Crossref] [Google Scholar] [PubMed]
- Kwon H, Lee SY, Kim JH, Lee SP, Kim JH, Sung IK, et al. ABC classification is less useful for older Koreans born before 1960. Gut Liver 2019;13(5):522.
[Crossref] [Google Scholar] [PubMed]
- Biasco G, Paganelli GM, Vaira D, Holton J, di Febo G, Brillanti S, et al. Serum pepsinogen I and II concentrations and IgG antibody to Helicobacter pylori in dyspeptic patients. J Clin Pathol 1993;46(9):826-8.
[Crossref] [Google Scholar] [PubMed]
- Su W, Zhou B, Qin G, Chen Z, Geng X, Chen X, et al. Low PG I/II ratio as a marker of atrophic gastritis: Association with nutritional and metabolic status in healthy people. Medicine 2018;97(20):e10820.
[Crossref] [Google Scholar] [PubMed]


 H. pylori caused gastritis
 gastritis


