- *Corresponding Author:
- Qilong Song
Department of Hepatobiliary and Pancreatic Surgery, The Affiliated Hospital of Xuzhou Medical University, Xuzhou, Jiangsu Province 221000, China
E-mail: 15952221573@163.com
| This article was originally published in a special issue, “Drug Discovery and Repositioning Studies in Biopharmaceutical Sciences” |
| Indian J Pharm Sci 2024:86(4) Spl Issue “1-11” |
This is an open access article distributed under the terms of the Creative Commons Attribution-NonCommercial-ShareAlike 3.0 License, which allows others to remix, tweak, and build upon the work non-commercially, as long as the author is credited and the new creations are licensed under the identical terms
Abstract
The clinical and follow-up data of 118 patients after hepatocellular carcinoma liver transplantation who met the three criteria were retrospectively analyzed. Predictive model scores were obtained using R3.4.3 software, and the cutoff values of the model were determined using the survival decision tree approach. Kaplan-Meier survival curves of the predictive model for patients after hepatocellular carcinoma liver transplantation under the three liver transplantation criteria were plotted and group-to-group differences were analyzed using log-rank tests. The predictive efficacy of the prediction model was examined using subject work characteristics curves. The support vector machine model is useful for meeting the up-to-seven criterion, the University of California, San Francisco criterion, and the Milan criterion. In addition to clinical and follow-up data, a pharmacologic perspective could provide important additional information for this study. Pharmacologic therapy is crucial in patients after liver transplantation, especially the use of anti-rejection and anti-cancer drugs. After liver transplantation, patients' liver function may be affected to varying degrees. The metabolic pathways of drugs may be altered, which is also important for developing personalized treatment plans and predicting survival. Different drugs may cause different side effects after liver transplantation, such as liver injury and abnormal kidney function. These side effects may affect patient survival rates and the prediction results of support vector machine model. Regular monitoring of drug concentrations and patients' drug responses can help to adjust the treatment regimen and thus improve survival and prognosis.
Keywords
Factor analysis, hepatocellular carcinoma, Kaplan-Meier, liver transplantation, survival prediction, support vector machine
Hepatocellular Carcinoma (HCC) stands as a prevalent malignancy in the digestive system, with its occurrence and death rates ranking 5th and 3rd in the category of all malignant tumors, respectively. Due to the lack of distinct symptoms and signs in the initial stage, the majority of patients are diagnosed in the last stage, and the prognosis is extremely poor[1]. Today’s chemotherapeutic drugs for the treatment of liver cancer include sorafenib, which is used as an oral multi-targeted inhibitor for the treatment of advanced HCC and inhibits the growth of tumor cells and angiogenesis. Rituximab, another targeted therapy drug, is used for patients with advanced liver cancer who have not received systemic therapy before. Targeted therapy drugs include trastuzumab, which targets the vascular endothelial growth factor receptor and is used to treat advanced liver cancer.
Afatinib is targeted at the immunological checkpoint Programmed Death Ligand-1 (PD-L1) for the treatment of late-stage hepatocellular cancer. Liver transplantation is currently the only effective means of treating middle- and late-stage HCC, and its clinical application has been widely recognized[2,3]. Early death after liver transplantation is a major cause of overall graft outcome, and most recipients die within 3 mo after transplantation[4]. Given the ongoing acute scarcity of donor livers and the growing patient wait for these livers, there is an urgent need for some ideal survival prediction models for liver transplantation patients to assess patient outcomes through post-liver transplantation and to further identify patients who are most likely to benefit from liver transplantation. In recent years, in addition to the Model for Endstage Liver Disease (MELD) score[5], the Albumin-Bilirubin (ALBI) score and the Easy Albumin-ALBI (EZ-ALBI) score have been reported to be used as scoring models to accurately predict long-term survival after liver transplantation[6,7]. However, with the improvement of medical technology, patients' signs and symptoms are detected, which makes the traditional models have some limitations.
Nakayama et al.[8] constructed novel prognostic algorithms for patients with Acute Liver Failure (ALF) that may be helpful in determining the indications for liver transplantation. In determining the indicators for pre-transplant evaluation of HCC, the optimal threshold value for each test remains uncertain. Bertsimas et al.[9] constructed a mortality prediction model using machine learning techniques, i.e., prioritizing liver transplantation waiting list more accurately and objectively based on the severity of the disease, which led to a more equitable allocation of livers and a significant saving of healthcare resources. Zhong et al.[10] built an Artificial Neural Network (ANN) model based on the ALBI and Child-Pugh scoring systems, which showed good properties in assessing the efficacy of treatment.
Cucchetti et al.[11] used an ANN to build a predictive model based on HCC nuclear grading and microvascular infiltration data, and the findings indicated that compared with the traditional linear model, an ANN based on preoperative variables to more accurately identify HCC nuclear grading and microvascular infiltration, providing a clinical basis for treatment. Kavur et al.[12] used a deep learningbased automated segmentation algorithm to greatly improve the accuracy and reproducibility of liver segmentation and volume measurements. Jain et al.[13] retrospective cohort study included 1459 patients undergoing liver transplantation, and built a machine learning model to predict the cardiovascular events and mortality after transplantation and showed that the main factors influencing cardiovascular events were age, presence of diabetes mellitus, serum creatinine level, presence of cirrhosis due to nonalcoholic steatohepatitis, right ventricular systolic pressure, and left ventricular ejection fraction. Ji et al.[14] Machine-learning based augmented Computed Tomography (CT) findings can accurately predict partial hepatectomy in patients with HCC post recurrence, and it was found that machine learning combined with imaging and pathology could effectively evaluate and accurately predict HCC after partial hepatectomy.
In this study, based on the analysis of clinical liver transplantation case data, we constructed a Support Vector Machine (SVM)-based survival prediction model for liver transplantation patients, and further carried out multi-center and large-sample clinical validation. Using R3.4.3 software, the training and validation of the vector machine algorithm model were realized. Based on clinical parameters, liver transplant recipients meeting Up-to-Seven (Up7) criteria, University of California, San Francisco (UCSF) criteria and Milan criteria were included in the analysis. The ability of each clinical parameter to predict the survival of liver transplant recipients was evaluated by the average precision decrease value during the modeling process, and the average Gini coefficient decrease value. The predictive value of the prediction model for early postoperative survival in liver transplant recipients was explored by plotting Kaplan-Meier curves of overall postoperative survival of patients.
Materials and Methods
General information:
A retrospective analysis was conducted on the clinical records of 215 patients who received liver transplants due to liver failure between January 2013 and December 2022 in our medical facility. The group consisted of 148 males and 67 females, with an age range of (38±12) y. All liver transplant recipients and their families signed an informed consent form before liver transplantation.
Inclusion criteria: Recipients were aged 21 y-50 y. Liver transplant recipients with HCC met the Milan criteria. Recipients underwent abdominal CT within 3 mo before surgery. Recipients underwent serum total cholesterol examination within 2 w before surgery.
Exclusion criteria: Recipients of 2, multiple, or salvage liver transplantation; recipients with preoperative combined severe pneumonia and recipients with preoperative combined cardiovascular and cerebrovascular disease. Borderline donor livers (including advanced age donor livers, fatty liver donor livers, split liver transplant donor livers, viral hepatitis donor livers, hypernatremic donor livers, hemodynamically unstable, and preoperative presence of potential donor-derived infected donor livers)[15]. Multiple organ failure and combined other organ transplant recipients.
Immunosuppression program:
Postoperative recipients were treated with an immunosuppressive regimen based on calmodulin phosphatase inhibitors+mescaline analogs+glucocorticoids.
Research methodology:
Information about recipients was obtained by reviewing electronic medical records, outpatient clinics, and telephone counseling follow-up. Initial liver transplantation treatment was used as the starting point, and death within 3 mo or 3 mo postoperatively was used as the follow-up endpoint. Clinical data of the recipients were collected. General data included gender and age, and preoperative data included Hepatitis B surface Antigen (HBsAg), Total Bilirubin (TB), ALB, Gamma-Glutamyltransferase (GGT), Aspartate Aminotransferase (AST), Alanine Aminotransferase (ALT), serum sodium, Platelet (PLT), Plasminogen Time (PT), and the international standardized ratio of PT. PT-International Normalized Ratio (PT-INR), serum creatinine, Up7 score, UCSF score, and Milan score.
Indicators of HCC liver transplantation:
The currently recognized criteria for liver transplantation for HCC are the Up7 criteria[16], the UCSF criteria[17], and the Milan, Italy (Milan) criteria. HCC patients with liver transplantation who meet these criteria have a better prognosis than those who do not; therefore, HCC patients are usually evaluated preoperatively and those who meet the criteria are prioritized for liver transplantation.
Up7 criteria: The sum of the maximum diameter of the tumor (cm) and the number of tumors ≤7.
UCSF criteria: The maximum diameter of a single tumor ≤6.5 cm or the number of tumors is 2-3 and the maximum diameter of a single tumor ≤4.5 cm, and the sum of the maximum diameters of all tumors ≤8 cm. Not accompanied by large vessel invasion and lymph node metastasis.
Milan criteria: The maximum diameter of a single tumor is <5 cm, or the number of tumors is 2-3 and the maximum diameter of a single tumor is ≤3 cm. Not accompanied by Microvascular Invasion (MVI) and extrahepatic metastasis.
SVM prediction model:
In this paper, the researchers pre-tested the performance of various machine learning algorithms such as ANN, SVM, Categorical Regression Tree (CART), neighbourhood algorithms, and Random Forest (RF) algorithm in predicting the survival prediction after liver transplantation for HCC on a small portion of the dataset. Ultimately SVM showed the highest accuracy in the preliminary tests, so in this paper we chose the SVM algorithm for predictive model construction.
We utilized the RF package in R3.4.3 to implement the training and validation of the vector machine algorithm model. Every patient fulfilling the enrollment requirements is randomly allocated to both the training and trial sets in a proportion of 7/3. The whole process of training and validation of the model is divided into three main steps; predictive performance evaluation and screening of clinical features. Thirty-two clinical parameters were selected from the collected data that were completed with complete information and could be associated with tumor recurrence after liver transplantation[18]. Specifically, the following categories were included; basic information of liver transplant recipients, specifically including recipient's gender, recipient’s age, and recipient's ABO blood type. Recipient’s medical history, specifically, history of cardiovascular disease, history of hypertension, history of diabetes mellitus, whether or not it was a second liver transplant, history of systemic chemotherapy treatment for HCC, history of radiofrequency ablation treatment for HCC, history of hepatic arterial embolization chemotherapy treatment, and history of varicose vein hemorrhage. Recipient liver function, specifically protein synthesis function, progressive hyperbilirubinemia, hepatic encephalopathy condition, hepatorenal syndrome, creatinine, albumin, TB, Up7 standardized rate, UCSF standardized rate, and Milan standardized rate. Tumor characteristics, specifically plasma Alpha- Fetoprotein (AFP), number of tumors, maximal tumor length, maximal tumor width, sum of tumor diameters, venous invasion, presence or absence of encapsulation of the tumor, encapsulation invasion, metastasis to hepatic hilar lymph node nodes, and invasion of the right or left branch of the portal vein.
Incorporating liver transplant patients with HCC to adhere to the Up7 standardization, UCSF standardization, and Milan standardization rate was subsequently counted on the basis of the above clinical parameters, and the same three derived parameters were included in the analysis. The aim of this first analysis was to find the clinical parameters that were strong predictors of survival in liver transplant recipients in the SVM model. The ability of each clinical parameter to predict the survival of liver transplant patients was evaluated by means of the average precision decrease value during the modeling process as well as the average Gini coefficient decrease value, and all clinical parameters were ranked in terms of their predictive ability. A recursive feature elimination-like approach was used to determine the number of clinical parameters that would be included in the final model and to identify the clinical parameters that would be included in the final modeling.
In this step, the important clinical parameters screened in the previous step are used for the training of the SVM model, and the efficacy of the SVM model in forecasting outcomes is progressively enhanced by tweaking parameters, culminating in the development of the model that predicts patient survival post-liver transplant.
In this step, the predictive effect of the SVM model generated in the previous step is evaluated in the test set. It will also be compared with the traditional screening criteria for liver transplant recipients to test the clinical application value of the SVM model. In this study, the predictive power of different models will be evaluated using the Receiver Operating Characteristic (ROC) curve and Area Under the Curve (AUC). The accuracy gap between different prediction models will be quantified by the Net Reclassification Index (NRI), and the Kaplan-Meier survival analysis will be used to compare the survival of high-risk recipients vs. low-risk recipients after liver transplantation under different classification criteria.
Statistical processing:
R3.4.3 software was applied for statistical analysis. Firstly, the measurement data were tested for normality, and if they obeyed normal distribution, they were expressed as x±s. Comparisons between groups were analyzed by Analysis of Variance (ANOVA). In cases where it deviated from a normal distribution, the data was presented as a median (in the lower and upper quartiles), utilizing the non-parametric Kruskal-Wallis H test for intergroup comparisons. Count data were expressed as cases and percentages, and the test was used for comparison between groups. Preoperative serological and imaging parameters of the patients were analyzed by a SVM algorithm to identify predictors of survival prognosis.
SVM model scores were obtained by simulation using R3.4.3 software, and survival decision trees were used to determine model cutoff values. Kaplan- Meier graphs depicting patient survival rates postsurgery were created, and the log-rank test was employed to examine the disparities between groups with high and low risk.
Using pathology results as the gold standard, subject’s work characteristics (ROC) curves were plotted and analyzed for the proportion of annual deaths and non-deaths using R3.4.3 software with a test level (α) of 0.05.
Results and Discussion
This research included 215 patients, with their fundamental clinical information presented in Table 1. After screening by Up7 standardization, UCSF standardization and Milan standardized rate, a total of 118 patients (54.88 %) in conformity group A and 97 patients (45.12 %) in withdrawal group B were obtained. Among all patients in the compliant group, 41 patients were female, accounting for 34.75 % of the total, with a mean Body Mass Index (BMI) of 21.15±4.79 and a mean age of 37.75 y. Total Bilirubin (TBIL) is a model of end-stage liver disease. Fibrosis-4 (FIB-4) is tumor-lymph node-distant metastasis, and Asia Pacific Research Integrity (APRI) is Japanese comprehensive staging system[19].
| Characteristic | Total amount (215) | Coincidence group (118) | Exit group (97) |
|---|---|---|---|
| Age (year) | 37.89±12.05 | 37.75±3.16 | 42.22±6.5 |
| Sex (female/male) | 67/148 | 41/77 | 26/71 |
| Height (m) | 1.64±0.22 | 1.66±0.29 | 1.64±0.24 |
| Weight (kg) | 54.2±8.57 | 56.99±8.29 | 55.72±6.26 |
| BMI (kg/m2) | 22.98±3.38 | 21.15±4.79 | 22.81±3.15 |
| WBC (×109/l) | 5.26±5.91 | 5.39±5.65 | 5.43±6.11 |
| RBC (×109/l) | 4.38±7.83 | 4.08±4.28 | 5.08±3.43 |
| Hb (g/l) | 120.63±11.6 | 122.96±19.91 | 112.66±19.66 |
| PLT (×109/l) | 153.3±59.75 | 169.47±59.3 | 126.15±59.50 |
| Monocyte (×109/l) | 0.49±0.16 | 0.44±0.16 | 0.52±0.05 |
| Lymphocyte (×109/l) | 1.37±0.14 | 0.71±0.33 | 1.99±3.09 |
| Neutrophil (×109/l) | 2.89±0.74 | 2.65±0.71 | 3.22±1.02 |
| RDW-CV (%) | 13.9±2.01 | 13.48±2.60 | 14.74±1.76 |
| RDW-SD (%) | 49.06±1.92 | 52.28±1.47 | 48.44±2.17 |
| HCT (%) | 37.65±4.85 | 35.68±5.8 | 41.41±5.94 |
| MPV (fl) | 14.6±2.74 | 12.99±2.22 | 16.14±3.43 |
| PDW (fl) | 15.72±2.66 | 15.24±2.64 | 16.69±2.31 |
| ALT (U/l) | 193.50±307.1 | 243.45±236.07 | 181.15±228.77 |
| AST (U/l) | 199.8±261.61 | 191.86±262.39 | 219.95±299.64 |
| ALP (U/l) | 162.37±54.41 | 154.57±87.01 | 174.77±92.64 |
| GGT (U/l) | 153.92±94.87 | 163.79±92.74 | 135.24±91.81 |
| TBIL (μmol/l) | 51.15±93.26 | 43.87±87.7 | 81.74±84.32 |
| TBA (μmol/l) | 57.16±86.39 | 58.15±84.28 | 48.87±78.38 |
| GLB (g/l) | 32.08±5.17 | 34.18±6.02 | 30.99±4.78 |
| ALB (g/l) | 39.57±8.68 | 42.47±5.17 | 35.49±8.88 |
| PT (sec) | 12.71±2.13 | 11.97±2.05 | 13.51±2.87 |
| APTT (sec) | 37.82±7.14 | 39.05±8.84 | 37.17±10.52 |
| UTST (mm) | 37.17±7.02 | 36.36±5.98 | 41.17±9.52 |
| FIB-4 | 4.59±1.22 | 4.34±1.58 | 11.67±11.31 |
| AAR | 1.88±2.54 | 2.97±3.41 | 1.43±1.57 |
| APRI | 3.86±0.67 | 3.56±5.27 | 2.85±4.77 |
Table 1: Basic Clinical Data Characteristics
The widespread clinical use of borderline donor livers increases the risk of developing Early Graft Insufficiency (EAD) after liver transplantation. The most commonly used diagnostic criteria for EAD after liver transplantation in main indicators are the highest value of alanine ALT or AST within 7 d after surgery, TB on the 7th d after surgery, and the INR on the 7th d after surgery. Various factors can influence the occurrence of EAD after liver transplantation, which can be mainly categorized into donor factors, and recipient factors. Early diagnosis of EAD is of great clinical value for its prevention and treatment. In this study, we propose to establish an individualized prediction model that can be easily extended to clinical practice by retrospectively analyzing the clinical data of a large sample of liver transplantation cases from multiple centers, so as to provide preoperative early warning of EAD.
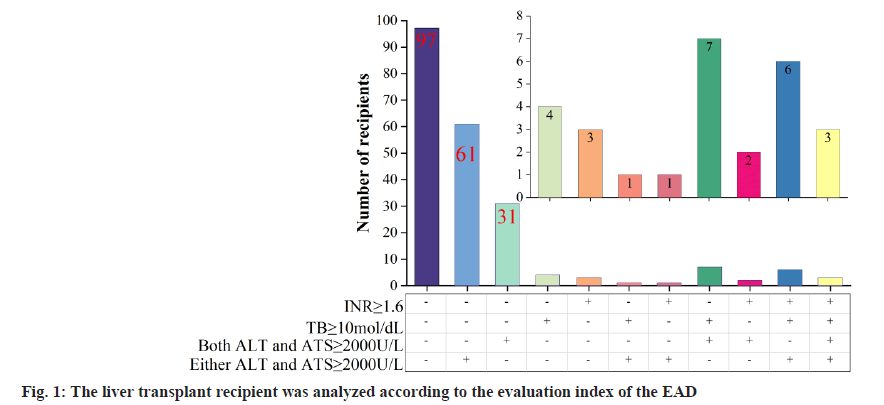
In the training set of 215 liver transplants, 97 liver transplant recipients did not develop EAD and 118 liver transplant recipients developed EAD, and the recipients were further categorized into subgroups based on the 3 indicators of EAD diagnosis as shown in fig. 1, where - and + indicate decrease and increase, respectively. Of the 118 liver transplant recipients who developed EAD, 61 liver transplant recipients had elevated ALT or AST alone, which is referred to as type A EAD-A, and the remaining 57 liver transplant recipients who developed EAD are referred to as type B EAD-B.
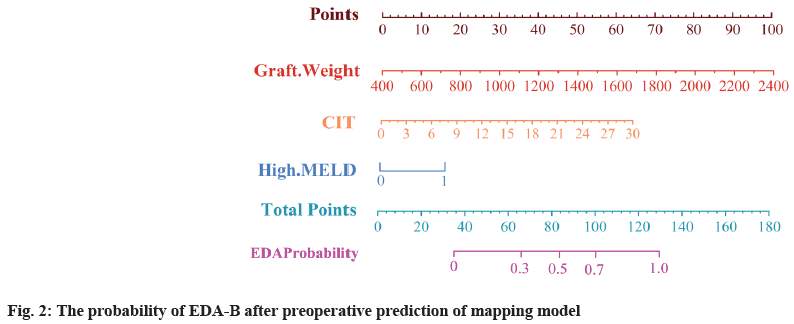
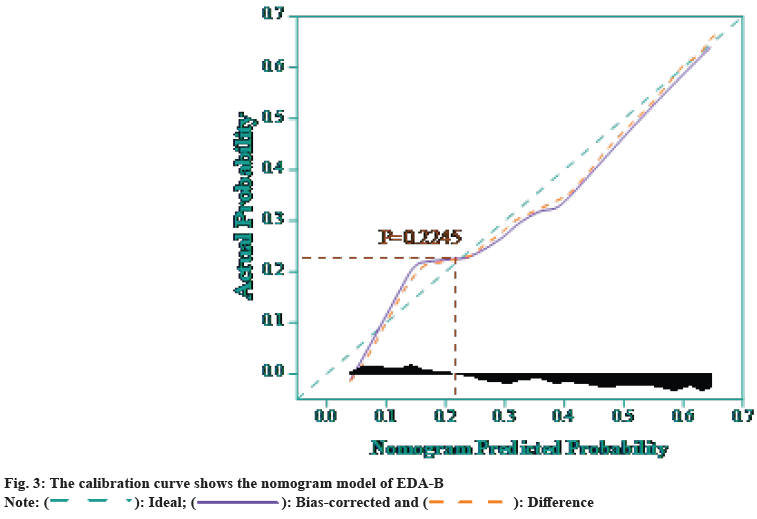
The study was further analyzed by the SVM model constructed in the previous section, and the results of univariate and multivariate analysis of poor prognosis EAD-B are shown in Table 2. Where GRWR is expressed as the proportion of graft weight to recipient weight, CIT is expressed as cold ischemia time, and high MELD score is defined as preoperative MELD score >40. Multifactorial analysis revealed that graft weight (p=0.000), cold ischemia time (p=0.021), and high MELD score (p=0.015) were independent risk factors for the development of EAD-B. A columnlinear graphical model for preoperative prediction of EAD-B was developed as shown in fig. 2, which had good discrimination with a C-index of 0.803 (0.681, 0.825). Finally, the calibration curves were obtained as shown in fig. 3, and it was found that the predicted results of the SVM model had a good fit with the actual occurrence results, and the Hosmer- Lemeshow (HL) goodness-of-fit test indicated that the prediction model had a good fit (p=0.2245).
| Feature | Single factor analysis | Multifactor analysis | |
|---|---|---|---|
| p | OR (95 % CI) | p | |
| Donor characteristics | |||
| Age (years) | 0.4349 | — | |
| Gender | 0.7409 | — | |
| BMI (kg/m2) | 0.1218 | — | |
| Bubbly fat change | 0.2568 | — | |
| The weight of the graft (g) | 0.0008 | 1.001 (1.000,1.003) | 0.0000 |
| GRWR (%) | 0.0005 | — | |
| The donor blood sodium (mmol/l) | 0.2296 | — | |
| CIT (h) | 0.0003 | 1.213 (1.017,1.255) | 0.0021 |
| Acceptor characteristic | |||
| Age (y) | 0.2244 | — | |
| Gender | 0.6129 | — | |
| BMI (kg/m2) | 0.4154 | — | |
| High meld score | 0.0000 | 2.037 (1.105,3.271) | 0.0015 |
Table 2: Multi-Factor Analysis of the Risk Factors of the EDA-B

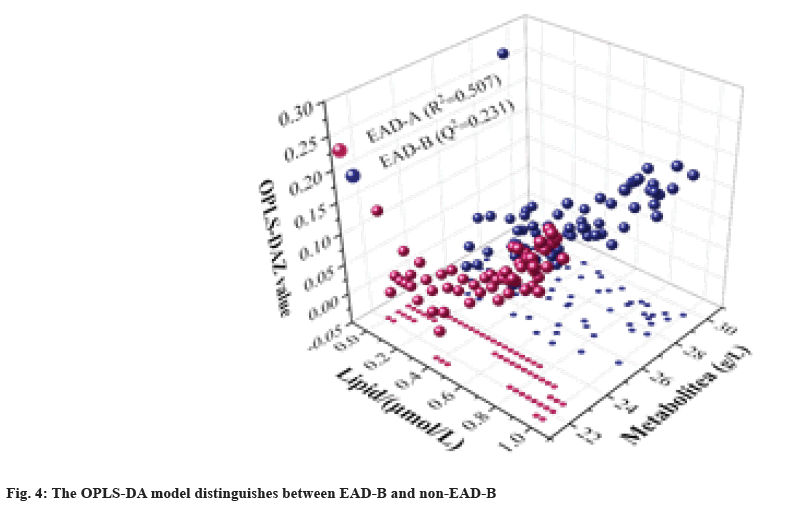
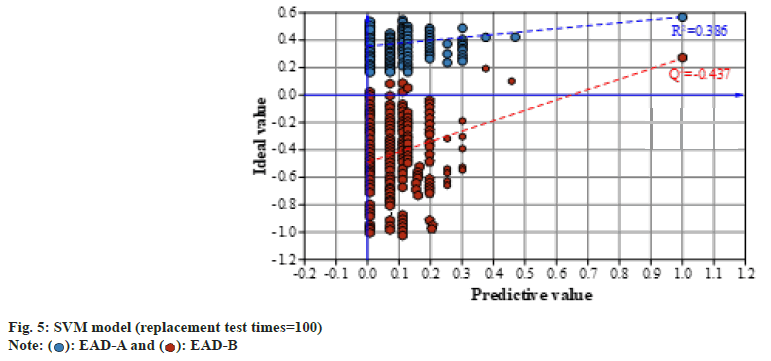
To further explore lipid metabolites in the development of poor prognostic EAD subtypes, lipid metabolites were compared between the EAD-B (n=57) and non-EAD-B (n=61) groups. The dataset was analyzed by Orthogonal Partial Least Squares- Discriminant Analysis (OPLS-DA) through SVM modeling, and the results are shown in fig. 4. It was found that there was a significant difference in the Metabolite dimension between the two groups on the 3D score map, and the EAD-B group was distributed in the interval. While the non-EAD-B group, i.e., EAD-A group was less than 24. OPLS-DA score distinction was significant (R2=0.507, Q2=0.231). The SVM prediction model was subjected to a 100 permutation test to obtain the robustness results of the model as shown in fig. 5. It can be found that the goodness of fit for the EAD-B group and non-EAD-B is R2=0.361, Q2=-0.459, respectively, indicating that the predictive model is robust and good.
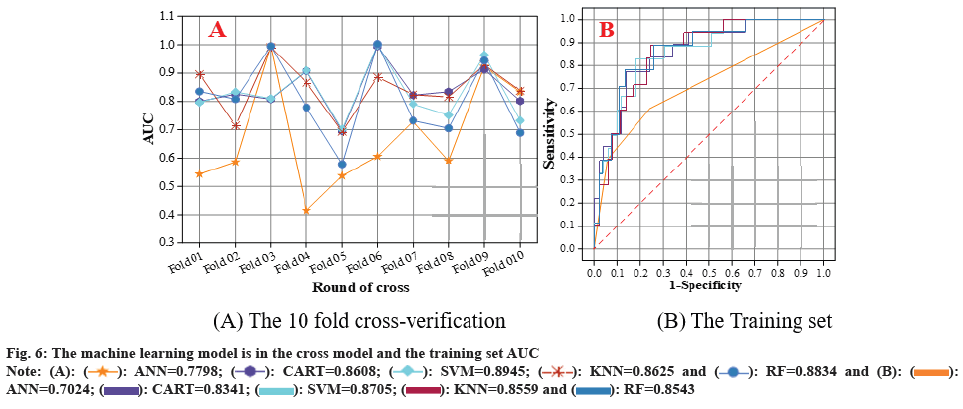
This research led to the creation of five distinct machine learning models ANN, SVM, CART, Neighborhood Algorithm (KNN), and RF were established for survival prediction of liver transplantation patients, and the results of the models obtained on the 10- fold cross validation and the training set are shown in fig. 6. The results show that the ability of SVM in predicting the survival of liver transplant patients achieved the optimum (AUC=0.8945, 0.8705) in both 10-fold cross-validation and training set. In 10-fold cross-validation, followed by RF (AUC=0.8834), KNN (AUC=0.8625) and CART (AUC=0.8608) had comparable predictive efficacy. ANN had the worst predictive efficacy (AUC=7798). The standard error SE of the AUC of the SVM model was smaller than that of the other four models (SE=0.0218), which proved that its predictive efficacy was more stable than that of the other models.
This research categorized 118 group A eligible recipients into two groups; a training group (n=71) and a testing group (n=47), based on a 6:4 case ratio, and the prediction performance of different machine learning models on training cohort and testing cohort was demonstrated respectively, and the relevant diagnostic metrics of different machine learning models are shown in Table 3. It can be seen that SVM has the best prediction efficacy on both the training and test cohorts. In the training cohort, SVM has AUC=0.9572, sensitivity 92.71 %, specificity 86.68 %, accuracy 86.33 %, and recall 92.05 %. SVM in the test cohort has AUC=0.8575, sensitivity 83.16 %, specificity 84.04 %, accuracy 76.22 %, and recall 82.66 %. The above findings suggest that SVM modeling can be used as the best predictive tool for the survival of HCC liver transplantation patients and can be applied among the clinics of general surgery.
| Group | Diagnostic value | ANN | SVM | CART | KNN | RF |
|---|---|---|---|---|---|---|
| Training set (n=71) | AUC | 0.8409 | 0.9572 | 0.8843 | 0.9013 | 0.8978 |
| Sensitivity | 0.8206 | 0.9271 | 0.8332 | 0.8958 | 0.8437 | |
| Specificity | 0.8018 | 0.8668 | 0.8003 | 0.7932 | 0.8099 | |
| Accuracy | 0.7334 | 0.8633 | 0.8687 | 0.8104 | 0.7706 | |
| Recall | 0.7767 | 0.9205 | 0.8103 | 0.8729 | 0.8119 | |
| Testing set (n=47) | AUC | 0.7106 | 0.8575 | 0.7691 | 0.8052 | 0.8071 |
| Sensitivity | 0.6003 | 0.8316 | 0.7832 | 0.8307 | 0.7408 | |
| Specificity | 0.6733 | 0.8404 | 0.7288 | 0.8172 | 0.7882 | |
| Accuracy | 0.675 | 0.7622 | 0.7271 | 0.7009 | 0.7595 | |
| Recall | 0.7141 | 0.8266 | 0.7427 | 0.7887 | 0.7779 |
Table 3: The Survival and Prediction of Machine Learning Model
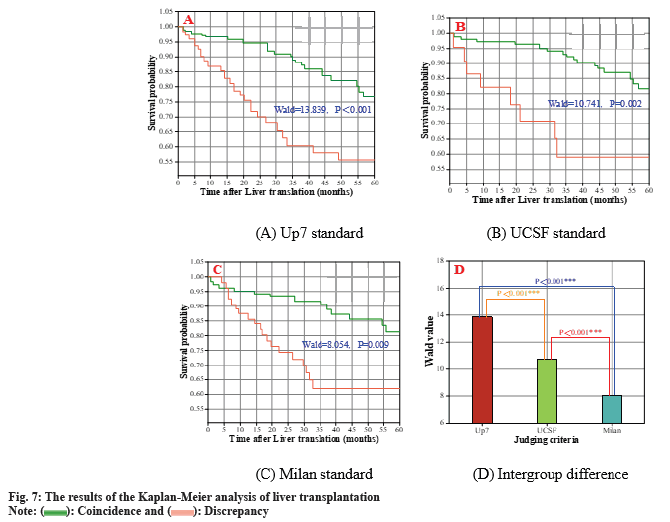
All patients included in the compliant group were scored with ATMD and the cutoff value of the SVM model was set to 1.504 based on the discriminant survival tree. Liver transplantation patients meeting the Up7 criteria were categorized into two groups, the high-risk group and the low-risk group. The number of patients meeting the UCSF criteria was 23 and 95 for the high-risk group and the low-risk group, respectively. The number of patients meeting the UCSF criteria was 32 and 86 in the high-risk and low-risk groups, respectively. In the highrisk and low-risk categories, 23 and 95 patients respectively fulfilled the Milan criteria. The results of the Kaplan-Meier analysis of survival of postliver transplantation patients based on the SVM model for the different criteria are shown in fig. 7. The log-rank test found that the standard errors of the three discriminatory criteria, SE Wald of Chi-square values were 13.839, 10.741 and 8.054, respectively, and the survival of liver transplant patients could be significantly differentiated in both high-risk and low-risk groups (p<0.001, p=0.002, p=0.009). The results of intergroup differences indicated that the prediction model constructed in the study was able to significantly differentiate between the high-risk group and the low-risk group, indicating that the model effectively forecasted the survival rates of patients who underwent liver transplants based on varied distinguishing factors.
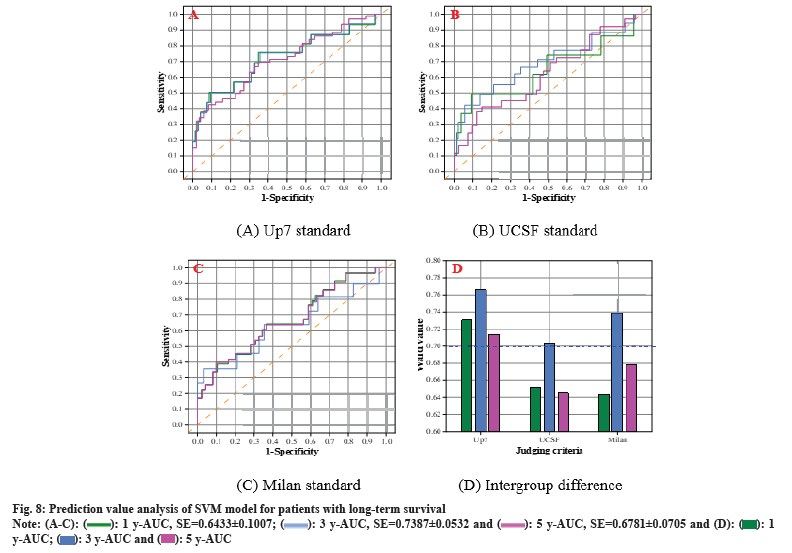
The AUC results of the SVM model for predicting 1 y, 3 y, and 5 y survival of liver transplant patients under three different discriminant criteria are shown in fig. 8. Utilizing the Up7 standard, the SVM model forecasted the AUC for 1 y, 3 y, and 5 y survival rates at 0.7305, 0.7658, and 0.7134, in that order. Under the UCSF criterion, the SVM model predicted the AUC of 1 y, 3 y, and 5 y survival as 0.7658, 0.7034, and 0.7387, respectively. Under the Milan criterion, the SVM model predicted the AUC of 1 y, SVM model under Milan criterion for 1 y, 3 y, and 5 y patient survival predicted AUCs of 0.7134, 0.6447, and 0.6781, respectively. It was found that the AUCs of liver transplantation patient survival predicted in three of the years were >70 %, and a more stable prediction result was obtained.
China is a major country with a high incidence of HCC, with at least 500 000 people dying of HCC each year, accounting for approximately 50 % of global HCC deaths, and liver transplantation has been gradually recognized as one of the therapeutic options for HCC, in addition to surgery and other comprehensive treatment options. Presently, the primary criteria for considering liver transplants for HCC include the Up7, UCSF, and Milan criteria, each relying on distinct threshold values for tumor size and quantity.
Zhang et al.[20] constructed a decision analysis model to use liver supply more rationally and efficiently.
Abdel et al.[21] applied machine learning techniques to the matching of donor-recipient models for liver transplantation[22], which optimized the process, improved the efficiency, and better adherence to the principle of fairness. Yang et al.[23] used machine learning techniques to construct a mortality prediction model, i.e., to prioritize liver transplantation waiting list more accurately and objectively according to the severity of the disease, which led to a fairer allocation of livers, and saved a large amount of healthcare resources. Dolan et al.[24] found that the machine learning techniques have the transplantation clinical practice guidance potential, thereby favoring national organ allocation policies.
Moreover, integrating advancements in drug therapies for HCC is crucial. Chemotherapeutic agents such as sorafenib and lenvatinib are pivotal in treating advanced stages of liver cancer by inhibiting tumor cell growth and angiogenesis. Targeted therapies like ramucirumab and atezolizumab, which target specific receptors or immune checkpoints, have also shown efficacy in treating advanced HCC.
Conflict of interests:
The authors declared no conflict of interests.
References
- Zaccherini G, Weiss E, Moreau R. Acute-on-chronic liver failure: Definitions, pathophysiology and principles of treatment. JHEP Rep 2021;3(1):100176.
[Crossref] [Google Scholar] [PubMed]
- Thüring J, Rippel O, Haarburger C, Merhof D, Schad P, Bruners P, et al. Multiphase CT-based prediction of child-Pugh classification: A machine learning approach. Eur Radiol Exp 2020;4:1-9.
[Crossref] [Google Scholar] [PubMed]
- Piardi T, Gheza F, Ellero B, Woehl-Jaeglè ML, Ntourakis D, Cantù M, et al. Number and tumor size are not sufficient criteria to select patients for liver transplantation for hepatocellular carcinoma. Ann Surg Oncol 2012;19:2020-6.
[Crossref] [Google Scholar] [PubMed]
- Feng R, Kan K, Sticht C, Li Y, Wang S, Liu H, et al. A hierarchical regulatory network ensures stable albumin transcription under various pathophysiological conditions. Hepatology 2022;76(6):1673-89.
[Crossref] [Google Scholar] [PubMed]
- Lischalk JW, Repka MC, Unger K. Radiation therapy for hepatobiliary malignancies. J Gastrointest Oncol 2017;8(2):279.
[Crossref] [Google Scholar] [PubMed]
- Morita Y, Kariya T, Nagai S, Itani A, Isley M, Tanaka K. Hepatic vein flow index during orthotopic liver transplantation as a predictive factor for postoperative early allograft dysfunction. J Cardiothorac Vasc Anesth 2021;35(11):3275-82.
[Crossref] [Google Scholar] [PubMed]
- Hudcova J, Scopa C, Rashid J, Waqas A, Ruthazer R, Schumann R. Effect of early allograft dysfunction on outcomes following liver transplantation. Clin Transplant 2017;31(2):e12887.
[Crossref] [Google Scholar] [PubMed]
- Nakayama N, Oketani M, Kawamura Y, Inao M, Nagoshi S, Fujiwara K, et al. Algorithm to determine the outcome of patients with acute liver failure: A data-mining analysis using decision trees. J Gastroenterol 2012;47:664-77.
[Crossref] [Google Scholar] [PubMed]
- Bertsimas D, Kung J, Trichakis N, Wang Y, Hirose R, Vagefi PA. Development and validation of an optimized prediction of mortality for candidates awaiting liver transplantation. Am J Transplant 2019;19(4):1109-18.
[Crossref] [Google Scholar] [PubMed]
- Zhong BY, Ni CF, Ji JS, Yin GW, Chen L, Zhu HD, et al. Nomogram and artificial neural network for prognostic performance on the albumin-bilirubin grade for hepatocellular carcinoma undergoing transarterial chemoembolization. J Vasc Interv Radiol 2019;30(3):330-8.
[Crossref] [Google Scholar] [PubMed]
- Cucchetti A, Piscaglia F, Grigioni AD, Ravaioli M, Cescon M, Zanello M, et al. Preoperative prediction of hepatocellular carcinoma tumour grade and micro-vascular invasion by means of artificial neural network: A pilot study. J Hepatol 2010;52(6):880-8.
[Crossref] [Google Scholar] [PubMed]
- Kavur AE, Gezer NS, Barış M, Şahin Y, Ozkan S, Baydar B, et al. Comparison of semi-automatic and deep learning-based automatic methods for liver segmentation in living liver transplant donors. Diagn Interv Radiol 2020;26(1):11.
[Crossref] [Google Scholar] [PubMed]
- Jain V, Bansal A, Radakovich N, Sharma V, Khan MZ, Harris K, et al. Machine learning models to predict major adverse cardiovascular events after orthotopic liver transplantation: A cohort study. J Cardiothoracic Vasc Anesthesia 2021;35(7):2063-9.
[Crossref] [Google Scholar] [PubMed]
- Ji GW, Zhu FP, Xu Q, Wang K, Wu MY, Tang WW, et al. Machine-learning analysis of contrast-enhanced CT radiomics predicts recurrence of hepatocellular carcinoma after resection: A multi-institutional study. EBioMedicine 2019;50:156-65.
[Crossref] [Google Scholar] [PubMed]
- Yang M, Peng B, Zhuang Q, Li J, Liu H, Cheng K, et al. Models to predict the short-term survival of acute-on-chronic liver failure patients following liver transplantation. BMC Gastroenterol 2022;22(1):80.
- Tanemura A, Maeda K, Shinkai T, Ito T, Hayasaki A, Gyoten K, et al. Postoperative donor liver damage can predict recipient short-term survival in living donor liver transplantation. Transplant Proc 2022;54(2):18-423.
[Crossref] [Google Scholar] [PubMed]
- Liukkonen VH, Nordin AJ, Farkkila MA, Mirtti TK, Arola JT, Aberg FO. Protocol liver biopsy predicts graft survival after liver transplantation. Clin Transplant 2024;38(3):e15286.
[Crossref] [Google Scholar] [PubMed]
- Saito H, Masuda T, Tada S, Ebinuma H, Yamagishi Y, Ojiro K, et al. Hepatocellular carcinoma in Keio affiliated hospitals-diagnosis, treatment, and prognosis of this disease. Keio J Med 2009;58(3):161-75.
[Crossref] [Google Scholar] [PubMed]
- Mehta S, Asrani SK. The computer will see you now: Prediction of long-term survival in patients with cirrhosis. Hepatology 2022;76(3):544-5.
[Crossref] [Google Scholar] [PubMed]
- Zhang Q, Wei Y, Li Y, Jiao X. Low marco expression is associated with poor survival in patients with hepatocellular carcinoma following liver transplantation. Cancer Manag Res 2022;14:1935-44.
- Abdel-Wahab M, Sultan AM, Fathy OM, Salah T, Elshobary MM, Elghawalby NA, et al. Factors affecting recurrence and survival after living donor liver transplantation for hepatocellular carcinoma. Hepato Gastroenterol 2013;60(128):1847-53.
[Crossref] [Google Scholar] [PubMed]
- Lim WH, Ng CH, Tan DJ, Xiao J, Fu CE, Ong C, et al. Donor diabetes and steatosis affects recipient survival following liver transplantation based on etiology of liver cirrhosis. Transplantation 2024;108(2):473-82.
[Crossref] [Google Scholar] [PubMed]
- Yang Y, Wang X, Cao J, Li J. Clinical characteristics and survival analysis of liver transplantation in patients with alcoholic liver disease: A single-center retrospective study. Transplant Immunol 2022;72:101569.
[Crossref] [Google Scholar] [PubMed]
- Dolan KJ, Arikan A, Banc-Husu AM, Mian MU, Thadani S, Lee JQ, et al. Intraoperative renal replacement therapy during liver transplantation in children: Safety, efficacy and impact on survival. Clin Transplant 2024;38(4):e15306.
[Crossref] [Google Scholar] [PubMed]
