- *Corresponding Author:
- S. Mallick
School of Pharmaceutical Sciences, Siksha O Anusandhan (Deemed to be University), Bhubaneswar-751003, India
E-mail: profsmallick@gmail.com
| Date of Received | 04 December 2019 |
| Date of Revision | 17 January 2020 |
| Date of Acceptance | 03 February 2020 |
| Indian J Pharm Sci 2020;82(2):306-314 |
This is an open access article distributed under the terms of the Creative Commons Attribution-NonCommercial-ShareAlike 3.0 License, which allows others to remix, tweak, and build upon the work non-commercially, as long as the author is credited and the new creations are licensed under the identical terms
Abstract
In this investigation, the effect of kaolin on hydration kinetics and swelling behavior of hydroxypropyl methylcellulose ocular film was studied. Gradual reduction in the extent of and rate of swelling of the film was noticed with increasing the content of kaolin. Peppas model revealed that the diffusion coefficient was increased in the presence of kaolin and also increased for the film of higher viscosity polymeric film. Peppas model suggested that the polymeric film followed the diffusion-controlled swelling mechanism. The Peleg rate constant was increased from 1.69 to 44.39 h/g indicating the initial water adsorption rate in the decreasing order while Peleg capacity constant did not vary significantly in the presence and absence of kaolin indicating lack of remarkable change of water adsorption capacity. The presence of kaolin in the film could maintain a safe corneal hydration level.
Keywords
Kaolin; corneal hydration level; swelling and erosion; Peleg’s kinetic model
Swelling of polymer plays an important role in hydrogel-based transmucosal drug delivery systems. Swelling facilitates patterned drug release from matrix due to water penetration into matrix and polymer chain relaxation. Intimate contact between polymer and mucosal tissue brings about bioadhesion via swelling by entanglement of polymer and mucin chains of mucosal membrane lining[1]. The mucoadhesion with the mucus layer covered the mucosal epithelial surface depends on the interaction capability of the natural and synthetic polymers, which further effects the controlled release of drug substances[2]. Swelling is an important phase for ocular polymeric film as swelling of film assist to adhere to the corneal mucous layer and improve ocular residence time. Hydroxypropyl methylcellulose (HPMC) is widely used in mucosal drug delivery systems due to its biodegradability and biocompatibility. HPMC undergoes hydration followed by swelling when comes in contact with aqueous media. Films prepared by HPMC transform hydrogel like structure by cross-linking of polymer after swelling and allow aqueous biological fluid absorption. Hydrogel has been used for drug delivery[3,4] and also in tissue engineering, biosensors and in biomedical field[5,6]. The swelling of hydrogel is an important parameter in influencing the controlled release of a drug. Clay minerals like kaolin are valuable industrial minerals and of considerable importance in drug delivery. The major elemental features of kaolin such as, sorption capacity, rheological properties, swelling capacity, high specific surface area and chemical inertness could be explored in designing hydrogel based drug delivery devices. The quality and functionality of the hydrogel could further be investigated by controlling the swelling process with kaolin incorporation and not too many studies have been published this area. In the present study hydration and swelling pattern of dexamethasone (DXA) incorporated HPMC hydrogel in presence and absence of kaolin have been investigated. The swelling behavior of the HPMC matrix films was characterized using Peleg’s kinetic model. Experimental data of swelling value was compared with the predictive value of swelling obtained from the model fitting.
Materials and Methods
DXA was supplied by Sigma Company as a gift. Ethanol (absolute for analysis) was purchased from Merck (Germany). HPMC E5 and HPMC K15M, kaolin and triethanolamine were procured from Burgoyne Co. (India), Qualikems Fine Chem Ltd., (Vadodara) and Merck Pvt Ltd (Mumbai), respectively.
Hydrogel film preparation:
The DXA polymeric hydrogel film was prepared by solvent casting and solvent evaporation technique[7,8]. Polymeric dispersions of HPMC E5 and HPMC K15M were prepared by continuous stirring of swollen polymer at room temperature for 24 h. Kaolin powder was dispersed in distilled water by stirring for 24 h at room temperature and the upper layer was incorporated into aqueous gel of HPMC E5 and HPMC K15M and stirring continued for 1 h. DXA acetate and triethanolamine (as plasticizer)[4] were dissolved in ethanol and incorporated into the polymer-kaolin dispersion by continuous stirring for 3 h. The film was produced by casting the final dispersion followed by drying in an incubator at 60º for 24 h.
Moisture content and moisture uptake:
Small pieces of the film (0.25 g) were weighed (W1) and placed in desiccators containing activated silica at room temperature for 24 h or more. The films were removed from desiccators and weighed (W2) until it showed a constant weight. Moisture content was determined using the formula (W1-W2)/(W2) for each film and expressed as a percent value. Dried films were taken out of the desiccators and placed in desiccators over the supersaturated solution of sodium nitrite, sodium chloride and potassium chloride, to maintain 65, 75, and 85 % relative humidity, respectively. The films were weighed periodically at respective humidity condition until three measurement of constant weight for the films were obtained. Moisture uptake was evaluated as the difference between final and initial weight with respect to initial weight and expressed as a percent value.
Fourier transform infrared (FTIR) spectroscopy:
FTIR spectra of DXA and the formulated samples were run using the KBr pressed-disk method on a Jasco FT/IR-4100. The FTIR spectra were recorded in transmission mode by accumulating 80 scans at a resolution of 4 cm-1 in the range of 400–4000 cm-1.
Scanning electron microscopy (SEM):
The morphology of the crystalline DXA, kaolin and samples were investigated using scanning electron microscopy with a Jeol/EO$CM_Version 1.0 Scanning Electron Microscope JSM-6390, operating at 5 kV. Prior to imaging, all samples were sputter-coated with a gold layer under argon atmosphere by a sputter apparatus. The film surfaces were viewed at different between 1000–10,000 magnification.
Swelling and erosion studies:
Swelling test was carried out at room temperature using following Eqn[9]. A piece (2 by 2 cm) of all prepared dry film formulation has been weighed (Wo) and placed in each separate petri dishes containing 25 ml of phosphate buffer pH 7.4. Then the samples were removed at predetermined time intervals up to 6 h from buffer and dabbed with a filter paper to remove excess water. Films were reweighed (Ws) and swelling content (g/g)[10,11] was calculated using the Eqn., S=Ws-W0 /W0. Where S is the swelling content (g/g) of film, Ws is the final weight of swollen film at time t, and Wo is the initial weight of the dry film.
For erosion studies these films from swelling studies were dried at 40º in a hot air oven overnight. Films were cooled to room temperature and weighed again (We) and erosion index was calculated from swelling studies, E= W0-We/W0. Swelling rate demonstrated the change in swelling content per unit time of film and calculated using the Eqn., Sr=St+Δt- St/Δt, where Sr is the swelling rate of the film, St is the swelling content of the film at any time t, and St+Δt is the swelling content at t+Δt based on dry content. Swelling of polymer involves diffusion of water, the swelling kinetics and diffusion of polymer structure have been explained by Peppas law, Higuchi model[12] for understanding of the mechanism of solvent diffusion. F = St/Smax= Ktn Q = KH × √t, where, F is the fraction of swelling content, Smax is the maximum swelling content of the film, St is the swelling content of the film at any time t, K is constant depends upon the changing of gel network structure and n is the diffusion exponential of solvent. The type of diffusion can be decided from the n value. Swelling kinetics examined by another important parameter as coefficient of diffusion. Coefficient of diffusion (D) of square shape film can be calculated from the Eqn. arranged form of Fick’s II law, which is, D = a2 (k/4)1/n. Where D is the coefficient of diffusion expressed as cm2/s, and a is the side of square film in cm. Mathematical modeling for swelling kinetics has been described by two-parameter based Peleg’s model[13] as, St = So ± t/ K1+K2t, where So is the swelling content at time 0 (g/g), St is the swelling content (g/g) at time t, k1 is the Peleg rate constant (h/g) and k2 is the Peleg capacity constant of the model (g). In the Eqn. ± indicates the process followed by absorption and/or adsorption (+), or the process followed by drying and/or desorption (–). The positive swelling process followed by polymer matrix induced by water uptake can be expressed by rewriting the above equation in linearized form. The linearized form of Peleg Eqn. plotted as the regress of swelling content vs. time using the Eqn., t/(st-S0) = K1+ K2t.
Measurement of corneal hydration level:
The whole eye ball of goat was collected from local butcher’s market and rinsed in saline water within 1 h after sacrificing the goat. Each test cornea was carefully removed from the scleral ring and weighed (Ww). Corneal hydration level (HL) of the film formulations was investigated gravimetrically by measuring total water content by desiccation at 100º for 6 h to determine dry corneal weight (Wd). The corneal hydration level (HL %), defined as (1-(Ww/Wd))×100 was determined both on untreated and treated corneas using film formulation.
Statistical analysis:
The statistical fitting of a model to the experimental data was analyzed using Origin Pro 8.0 (OriginLab, Northampton, MA) software[14] using the nonlinear regression analysis. The 3 values of R2, χ2, and root mean square error (RMSE) were utilized to evaluate the fitness of the model to the experimental data. RMSE = (1/NΣNi=1(SRpre,i – SRexp,i)2)1/2.
Results and Discussion
Table 1 shows moisture content at 25º and moisture uptake at 65, 75, and 85 % relative humidity of DXA film composed of HPMC and kaolin. A progressive diminution of both moisture content and moisture uptake was observed with increasing kaolin content in the formulations. Moisture uptake has also been enhanced gradually when RH was increased from 65 to 85 % in all the respective formulations[8]. It was observed that the % moisture uptake of the films with highest kaolin content of HPMC E5 and HPMC K15M matrices decreased from 5.34±0.011 to 3.50±0.019 and 6.52±0.032 to 4.54±0.049, respectively at 65 % RH when compared to those without kaolin. Kaolin content (1:1) in the film significantly decreased % moisture content in comparison to its absence from 2.27±0.006 to 1.16±0.011, and 3.29±0.006 to 2.19±0.011 in HPMC E5 and HPMC K15M films, respectively. These results suggested that the presence of kaolin improved the water resistance of HPMC matrix formulation. As kaolin possessed certain level of hydrophilicity[15] and capability of hydrogen bond formation, the interaction site availability for water retention was less due to the affinity between kaolin and DXA and between kaolin and HPMC. It has also been observed that the moisture content and uptake varied for different HPMC grades.
| Film | Polymer | DXA: kaolin | % Moisture uptake at RH (mean±SD, n=3) |
% Moisture content (mean±SD, n=3) | ||
|---|---|---|---|---|---|---|
| 65 | 75 | 85 | ||||
| DM5C0 | HPMC E5 | No kaolin | 5.34±0.011 | 12.21±0.019 | 17.55±0.020 | 2.40±0.006 |
| DM5C1 | HPMC E5 | 1:0.25 | 4.65±0.013 | 10.46±0.021 | 16.27±0.019 | 2.38±0.009 |
| DM5C2 | HPMC E5 | 1:0.5 | 4.20±0.020 | 10.92±0.029 | 16.80±0.031 | 2.27±0.005 |
| DM5C3 | HPMC E5 | 1:0.75 | 4.16±0.025 | 10.11±0.027 | 15.47±0.023 | 1.19±0.007 |
| DM5C4 | HPMC E5 | 1:1 | 3.50±0.019 | 9.94±0.033 | 14.61±0.030 | 1.16±0.011 |
| DM15C0 | HPMC K15M | No kaolin | 6.52±0.032 | 13.04±0.029 | 23.91±0.031 | 3.29±0.006 |
| DM15C1 | HPMC K15M | 1:0.25 | 5.59±0.039 | 12.42±0.049 | 21.73±0.052 | 3.14±0.009 |
| DM15C2 | HPMC K15M | 1:0.5 | 4.90±0.041 | 11.76±0.053 | 19.60±0.037 | 2.94±0.003 |
| DM15C3 | HPMC K15M | 1:0.75 | 4.80±0.047 | 11.53±0.038 | 19.23±0.082 | 2.83±0.014 |
| DM15C4 | HPMC K15M | 1:1 | 4.54±0.049 | 11.36±0.091 | 18.18±0.079 | 2.19±0.011 |
Table 1: Moisture Content and Moisture Uptake of the Film Formulation
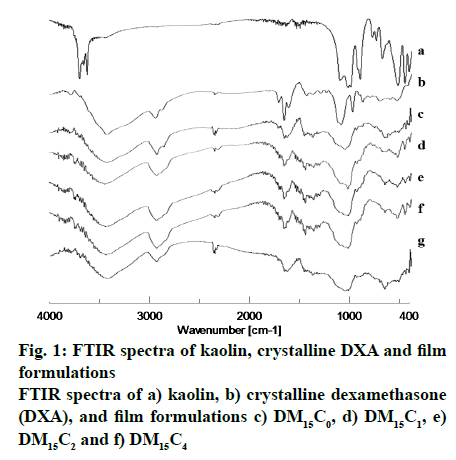
Infrared spectroscopy is the most appropriate universal technique for analyzing pharmaceutical solids. The appearance of new and disappearance of existing absorption bands, broadening of bands, and alteration in intensity are the main evidences to the nature of drug-excipient interaction[16,17]. Infrared spectroscopy provides valuable information about the peak positions, intensities, widths and shapes, in a spectrum. Fig. 1 shows IR spectra of DXA, kaolin, and film containing different amount of kaolin. The IR spectrum of DXA showed the characteristic absorption bands of important functional groups such as 3000-2800 for CH2 group, 885 for axial deformation of C-F group, 1718 for carbonyl of aliphatic ester, 1665 for C=O group, 1621 C≡C[18]. The broadening of absorption band such as 3000-2800 was observed in spectra of all formulations due to polymer. The characteristic absorption band of DXA at 1665 could be observed clearly in IR spectra of all formulations. These result indicated that DXA was incorporated successfully in to the films. The main chemical property of DXA remained unchanged during the entire process. The spectrum of pure kaolin showed an intense absorption band at 1032 due to Si-O stretching in clay[19]. This absorption band shifted to higher wavelength in spectra of all formulations.
The IR spectra of DXA, kaolin and formulation demonstrated evidence for the interaction between kaolin and DXA. The absorption band shifting might occur due to hydrogen bonding of DXA with kaolin. Kaolin contains hydroxyl groups, outer hydroxyl group (OuOH) positioned in the upper unshared plane and inner hydroxyl group (InOH) to be found in the lower unshared plane of the octahedral sheet. The observed absorption bands at 3693, 3669, 3649 cm-1 associated with the stretching of OuOH and at 3619 associated with the stretching of InOH in Al-OH[19]. Whereas the deformation band of OH linked to 2Al3- observed at 913 cm-1[20]. The characteristic absorption band of kaolin at 1032 was broadened in the spectra of all formulations and this broadening was more with increasing content of kaolin in films. This result suggested the relatively stronger binding to DXA with increasing kaolin content.
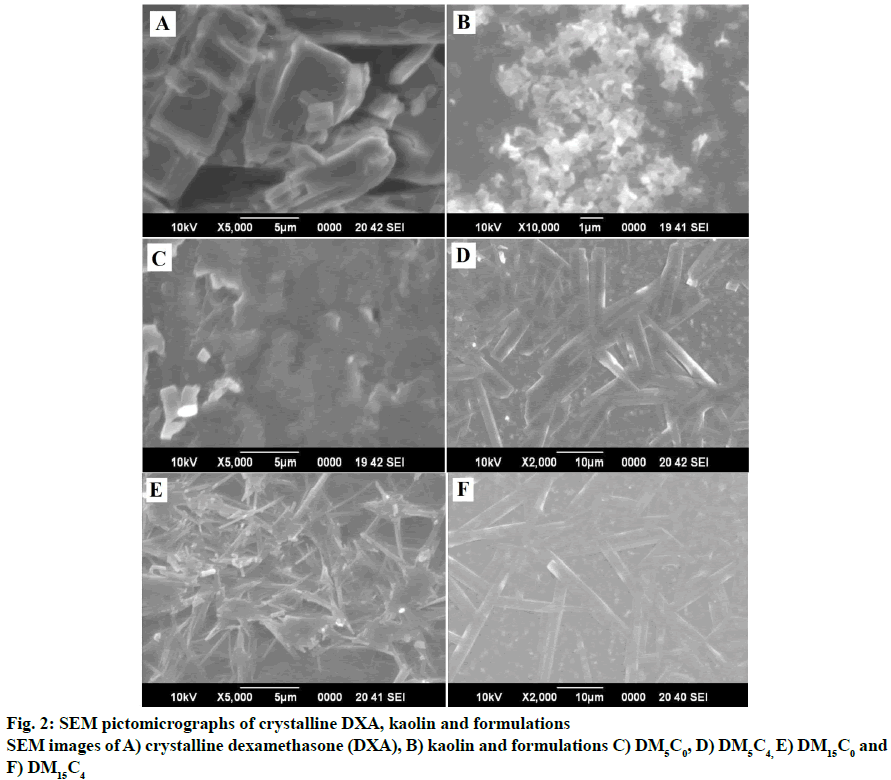
Fig. 2 showed the scanning electron micrograph of pure DXA and kaolin, films in presence and absence of kaolin of both HPMC E5 and HPMC K15M matrices. The nano-sized kaolin particle was distinctly distributed into the film as confirmed by the SEM images (figs. 2D and 2F). The DXA crystals were observed in geometric plate shape. The plate shape of DXA has been converted to thin submicron and nanomicron fiber tubular shape of DXA. The tubular shape of DXA appeared comparatively thinner in presence of kaolin than absence of kaolin in film. The pseudohexagonalshape of kaolinite crystal was observed in fig. 2B, as it is reported in literature[21]. The intercalation kaolin particle with DXA might be the reason of the conversion of kaolin particle to tubular form. The result of intercalation of potassium acetate with kaolinite was revealed the nanotubular behavior of kaolinite[22].
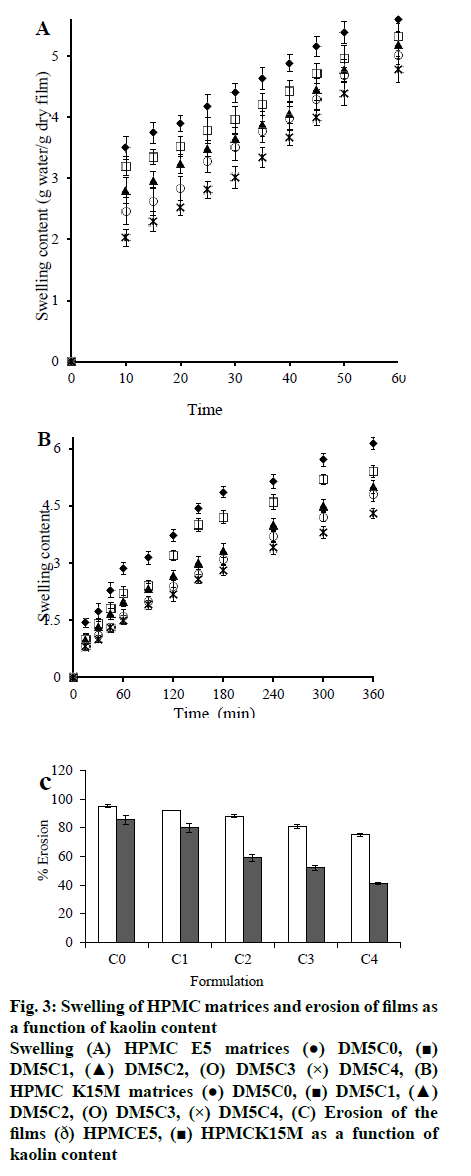
Swelling of polymer plays an important role in hydrogel-based transmucosal drug delivery systems. In this study swelling content of film measured to analyze the swelling capacity of polymer and kaolin in phosphate buffer saline (pH 7.4), which have been related to the permeation of DXA from the film matrix. Swelling involves the process of water uptake followed by erosion or degradation of the polymer matrix of film. Hence, swelling proceeded faster than erosion which resulted in still remaining of incorporated DXA molecules in the film matrix. Fig. 3 shows the swelling content vs. time graph with varied kaolin content of HPMC E5 and HPMC K15M matrices. It has been observed that the maximum swelling occurred after 60 min and 6 h from the film matrix of HPMC E5 and HPMC K15M respectively. Swelling content of the film gradually decreased with increased content of kaolin in film. Presence of kaolin in the film sustained the swelling more when compared with its absence. This result indicated that the kaolin has the ability to improve the water resistance of the film matrix. Swelling was driven by water uptake, which depends upon the hydrophilicity and also morphology as macro voids, free volume, and crystal size. Kaolin caused the production of tortuous pathway and also formation of denser cross-linking network[23], which led to decrease the length of free way for water uptake due to its certain level of hydrophilicity[24]. Film of HPMC K15M matrix showed increased swelling content compared to the films of HPMC E5 matrix. This observation has been related to the polymer viscosity and molecular weight. Nominal viscosities of HPMC E5 and HPMC K15M are 5 and 15000 mPa s respectively. High viscosity polymer matrix of HPMC K15M did not permit easy water uptake as a result of more compactly packed higher molecular weight molecules of polymer.
Fig. 3: Swelling of HPMC matrices and erosion of films as a function of kaolin content
Swelling (A) HPMC E5 matrices (●) DM5C0, (■) DM5C1, (▲) DM5C2, (O) DM5C3 (×) DM5C4, (B)
HPMC K15M matrices (●) DM5C0, (■) DM5C1, (▲)
DM5C2, (O) DM5C3, (×) DM5C4, (C) Erosion of the
films (ð) HPMCE5, (■) HPMCK15M as a function of
kaolin content
Erosion of polymeric matrix is commonly slower than the swelling or hydration process. Erosion causes diffusion of the loaded drug through the micropores of the polymer matrix induced by water uptake[1]. The extent of erosion at the end of 6 h of swelling in phosphate buffer (pH 7.4) decreased progressively with increasing kaolin content in the films (fig. 3). Erosion of polymer becomes difficult in presence of kaolin because of entrapment of kaolin particle in the network of the HPMC-matrices. Kaolin-polymer affinity becomes relatively stronger with the increased kaolin content and resists the erosion and degradation of polymer of the film more and more.
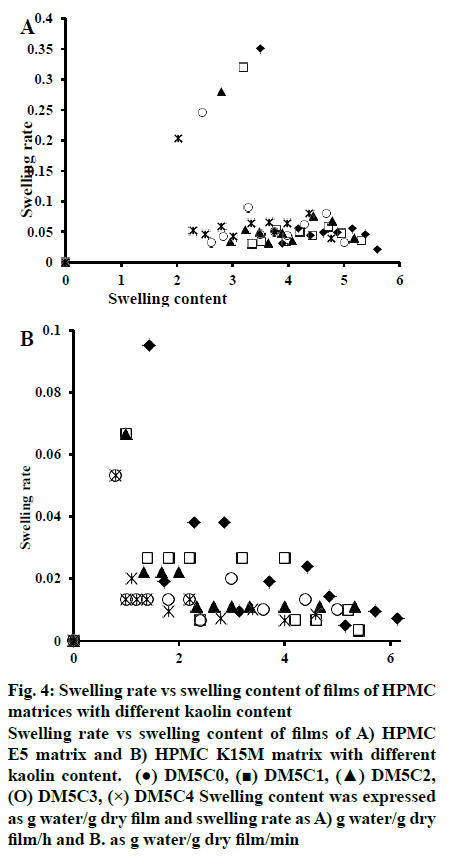
The changes in the swelling rate as a function of swelling content of HPMC E5 and HPMC K15M films were shown in fig. 4. These plots demonstrated that both the swelling content and swelling rate were decreased with increasing kaolin content of the films. Maximum swelling content in absence of kaolin was shown by DH5C0 and DH15C0, which were 5.6 and 6.14 g water/g dry film with corresponding swelling rates of 0.021 and 0.0071 g water/g dry film/min, respectively. Whereas the presence of maximum kaolin content in DH5C4 and DH15C4, caused decrease in the swelling content to the maximum extent, 4.78 and 4.6 g water/g dry film, with a consequent decrease in the swelling rate of 0.039 and 0.0083 g water/g dry film/min, respectively.
Fig. 4: Swelling rate vs swelling content of films of HPMC
matrices with different kaolin content
Swelling rate vs swelling content of films of A) HPMC
E5 matrix and B) HPMC K15M matrix with different
kaolin content. (●) DM5C0, (■) DM5C1, (▲) DM5C2,
(O) DM5C3, (×) DM5C4 Swelling content was expressed
as g water/g dry film and swelling rate as A) g water/g dry
film/h and B. as g water/g dry film/min
Peppas Eqn. was used to investigate the mechanism of water diffusion into the hydrogel film. Table 2 represents the value of Peppas parameter (n, k and coefficient of determination) calculated from the slopes and intercepts of the plot of lnFvsln t of all films. The type of diffusion was determined by the n value defined as the Fick’s diffusion transport. The swelling exponent (n) value of this study showed 0.277-0.446 and 0.485-0.58 of films of HPMC E5 and HPMC K15M matrix, respectively. Hence, it could be concluded that the films of HPMC E5 matrix followed Fickian diffusion mechanism whereas films of HPMC K15M matrix followed anomalous diffusion. Diffusion coefficient (D), one of the major parameter also used for the characterization of swelling of film. Swelling experiments suggested that D value increased with increasing kaolin content in the film for both categories of HPMC matrix (Table 2). The diffusion coefficient varied from 4.51×10⁻⁶ to 7.86 ×10⁻⁵, and 1.94×10⁻⁴ to 3.06×10⁻⁴ m2/s for HPMC E5 and HPMC K15M matrix, respectively. Higuchi model was utilized for determination of swelling kinetics and the parameters depicted in Table 2.
| Film | n | Kp (R2) |
D (cm2/s) |
KH (R2) |
|---|---|---|---|---|
| DM5C0 | 0.277 | 1.155 (0.967) | 3.75×10⁻⁶ | 0.487 (0.985) |
| DM5C1 | 0.294 | 1.253 (0.947) | 5.21×10⁻⁶ | 0.524 (0.986) |
| DM5C2 | 0.348 | 1.490 (0.951) | 1.68×10⁻⁵ | 0.526 (0.966) |
| DM5C3 | 0.422 | 1.770 (0.966) | 5.11×10⁻⁵ | 0.588 (0.978) |
| DM5C4 | 0.446 | 1.936 (0.971) | 9.44×10⁻⁵ | 0.618 (0.972) |
| DM15C0 | 0.485 | 2.819 (0.987) | 1.94×10⁻⁴ | 0.324 (0.987) |
| DM15C1 | 0.558 | 3.212 (0.988) | 2.70×10⁻⁴ | 0.311 (0.982) |
| DM15C2 | 0.559 | 3.301 (0.996) | 2.31×10⁻⁴ | 0.268 (0.996) |
| DM15C3 | 0.566 | 3.396 (0.994) | 3.06×10⁻⁴ | 0.266 (0.993) |
| DM15C4 | 0.58 | 3.426 (0.999) | 2.75×10⁻⁴ | 0.235 (0.995) |
Table 2: Effect of Kaolin on Hydration and Kinetics of Swelling of the Film as Per Peppas and Higuchi Model
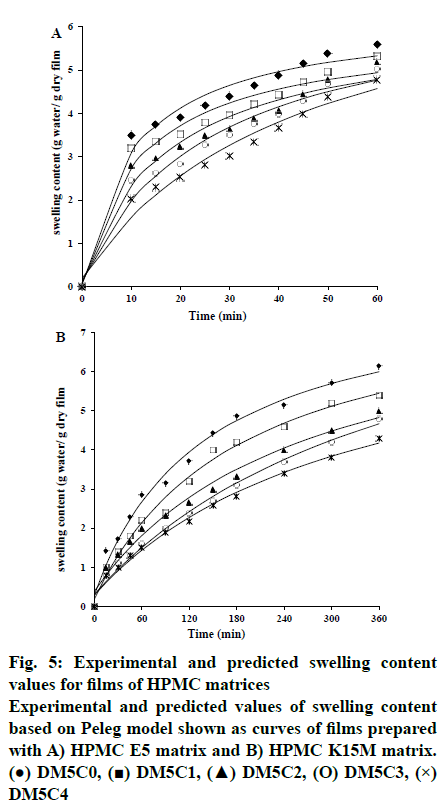
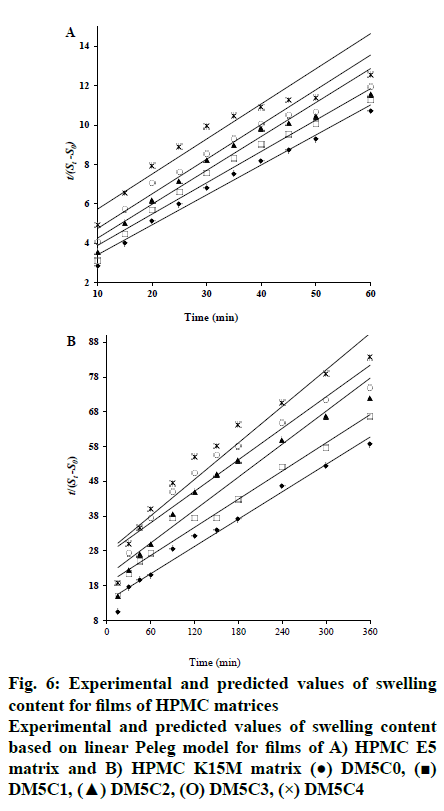
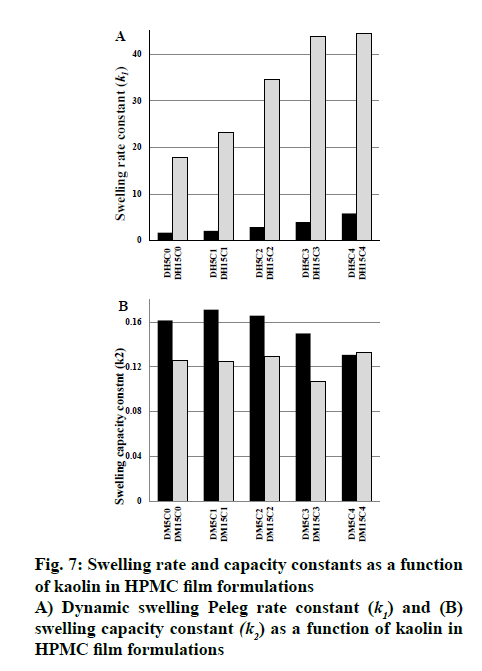
The swelling kinetics of films in presence and absence of kaolin were described by Peleg model and the constants k1, k2, R2, RMSE and χ2 were listed in Table 3. Mass transfer rate and maximum solvent absorption capacity explained by the assessment of the constant k1 and Peleg capacity constant (k2), respectively. k1 increased from 2.07 to 5.86 and 23.28 to 44.39 with the gradual increase in kaolin content compared to its absence (DH5C0, 1.6919 and DH15C0, 17.7602) for HPMC E5 and HPMC K15M matrix, respectively. Whereas, reduction of k2 observed from 0.181 to 0.131 and 0.134 to 0.108 for HPMC E5 and HPMC K15M matrix, respectively. It has been established that lower k1 and k2 value represented the higher initial solvent absorption rate and higher solvent absorption capacity, respectively[25]. The water absorption capacity of film increased in presence of increasing kaolin content may be due to the hydrophilicity level of kaolin. Kaolin resulted higher water absorption capacity of films, confirmed by the lower k2 value. The k1raised as the kaolin content increased suggesting the decreased initial water absorption rate correspondingly. Also the water absorption capacity of HPMC K15M matrix observed higher than HPMC E5 matrix, confirmed by the reduced k2 value of HPMC K15M matrix film rather than corresponding HPMC E5 film. The experimental and predicted values of swelling content based on Peleg model is depicted in fig. 5. R2 (0.9632 to 0.9914), RMSE (0.1241 to 0.2517) values revealed a good agreement of the predicted value with the experimental data of swelling content. The fitting of linearized form of Peleg model (Eqn, 8) demonstrated in fig. 6 as regress of swelling vs time. The results showed that the obtained parameter values were moderately matched to the Peleg model value and the calculated RMSE value appeared higher than the curve form of Peleg model (nonlinear curve fit in original software). k1 was increased markedly from 1.692 to 44.391 h/g in presence of gradual increase of kaolin in the films indicating the initial water absorption rate in the decreasing order. And swelling capacity of HPMC (k2) only varied slightly in the range of 0.107 to 0.171 g in presence and absence of kaolin indicating without remarkable change of water adsorption capacity fig. 7.
| Film | S0 | k1 | k2 | R2 | RMSE | χ2 |
|---|---|---|---|---|---|---|
| DM5C0 | 0.0563 | 1.692 | 0.161 | 0.9781 | 0.2152 | 0.0640 |
| DM5C1 | 0.0754 | 2.070 | 0.171 | 0.9680 | 0.2416 | 0.0806 |
| DM5C2 | 0.1131 | 2.893 | 0.166 | 0.9632 | 0.2517 | 0.0874 |
| DM5C3 | 0.1430 | 3.979 | 0.150 | 0.9735 | 0.2126 | 0.0625 |
| DM5C4 | 0.1971 | 5.863 | 0.131 | 0.9730 | 0.2061 | 0.0586 |
| DM15C0 | 0.3009 | 17.762 | 0.126 | 0.9888 | 0.1896 | 0.0487 |
| DM15C1 | 0.1905 | 23.280 | 0.125 | 0.9895 | 0.1703 | 0.0392 |
| DM15C2 | 0.3886 | 34.525 | 0.129 | 0.9841 | 0.1785 | 0.0428 |
| DM15C3 | 0.3079 | 43.835 | 0.107 | 0.9914 | 0.1281 | 0.0221 |
| DM15C4 | 0.2891 | 44.391 | 0.133 | 0.9899 | 0.1241 | 0.0207 |
Table 3: Effect of Kaolin on Kinetics of Swelling of the Film as Per Peleg Model
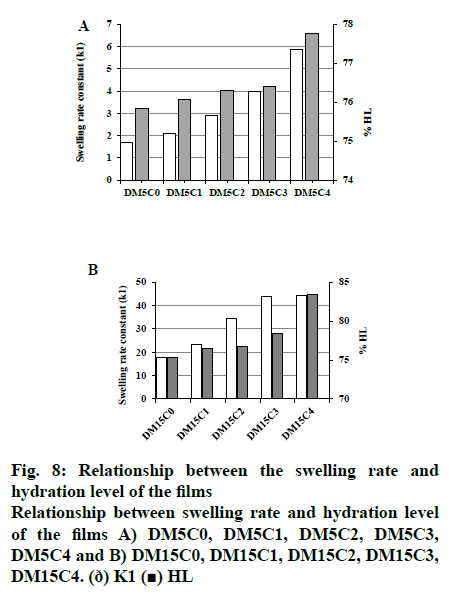
Assessment of corneal hydration is used frequently for measuring damage to the corneal tissue. Normal hydration level of cornea is 76-80 % and the level above 83 % is an indication of damage to the epithelium and/ or endothelium of the corneal tissue[9,22]. The result of the corneal hydration level on the corneas treated with film formulation was found to be not exceeding 83 % (fig. 8). This indicated that the presence of kaolin in the drug delivery film can maintain a safe corneal hydration level after topical application.
Swelling behaviour of DXA incorporated HPMC ocular film in presence and absence of kaolin was investigated. FTIR spectra of films showed evidence for uniform distribution of kaolin in the HPMC matrix and interaction between kaolin and DXA. SEM micrographs confirmed the plate shaped DXA converted to wire-like shape in presence of kaolin in the film. The gradual reduction of swelling content and swelling rate were observed with corresponding increased loading of kaolin in both HPMC matrices. The Peleg’s rate constant (k1) increased with increasing kaolin content in films whereas the capacity constant (k2) decreased. Patterned swelling of the ocular film in presence of kaolin could maintain a safe hydration level without damaging endothelium of the corneal tissue.
Conflicts of interest
The authors declare that there is no conflict of interest.
Acknowledgements
The authors are grateful to the president, Siksha‘O’Anusandhan (Deemed to be University) Prof. (Dr.) Monojranjan Nayak for financial support and laboratory facilities. Authors grateful to the Pharmacia Upjohn Company and Birla Institute of Technology, Mesra, Ranchi, for gift sample and instrumentation facility, respectively.
References
- Panda B, Subhadarsini R, Mallick S. Biointerfacial phenomena of amlodipine buccomucosal tablets of HPMC matrix system containing polyacrylate polymer/β-cyclodextrin: correlation of swelling and drug delivery performance. Expert Opin Drug Del 2016;13(5):633-43.
- Birsan M, Cojocaru IC, Stamate MI, Teodor V, Tuchilus C. Antifugal action of imidazole derivatives from new pharmaceutical forms on various strains of candida. Rev Chim 2016;67:1385-8.
- Mohapatra R, Mallick S. Transient and steady state characterization of permeation kinetics of diclofenac through ocular tissue. Asian J Chem 2016;28:1149-54.
- Mohapatra R, Mallick S, Nanda A, Sahoo RN, Pramanik A, Bose A et al. Analysis of steady state and non-steady state corneal permeation of diclofenac. RSC Adv 2016;6(38):31976-87.
- Sang J, Li X, Shao Y, Li Z, Fu J. Controlled tubular unit formation from collagen film for modular tissue engineering. ACS Biomater Sci Eng 2016;3(11):2860-8.
- Mateescu A, Wang Y, Dostalek J, Jonas U. Thin hydrogel films for optical biosensor applications.Membranes 2012;2(1):40-8.
- Swain K, Pattnaik S, Sahu SC, Mallick S. Feasibility assessment of ondansetron hydrochloride transdermal systems: physicochemical characterization and in vitro permeation studies. Lat Am J Pharm 2009;28:706-14.
- Panda B, Parihar AS, Mallick S. Effect of plasticizer on drug crystallinity of hydroxypropyl methylcellulose matrix film. J Biol Macromol 2014;67:295-302.
- Pinto FCH, Silva-Cunha A, Pianetti GA, Ayres E, Orefice RL, Da Silva GR. Montmorillonite clay-based polyurethane nanocomposite as local triamcinolone acetonide delivery system. J Nanomater 2011;2011:1-11.
- Mali KK, Dhawale SC, Dias RJ, Dhane NS, Ghorpade VS. Citric acid crosslinked carboxymethyl cellulose-based composite hydrogel films for drug delivery. Indian J Pharm Sci 2018;80(4):657-67.
- Kawarkhe S, Poddar SS. Designing of the mucoadhesive intravaginal spermicidal films. Indian J Pharm Sci 2010;72(5):652-5.
- Peppas NA, Bures P, Leobandung W, Ichikawa H. Hydrogels in pharmaceutical formulations. Eur J Pharm Biopharm2000;50(1):27-46.
- Peleg M. An empirical model for the description of moisture sorption curves. J Food Sci 1988;53(4):1216-7.
- http://www.originlab.com/OriginProLearning.aspx
- Mallick S, Pattnaik S, Swain K, De PK, Saha A, Ghosal G, et al, Formation of physically stable amorphous phase of ibuprofen by solid state milling with kaolin. Eur J Pharm Biopharm 2008;68(2):346-51.
- Tita B, Morgovan C, Tita D, Neag TA. Anti-inflammatory drugs interacting with Zn(ii) metal ion synthesis, characterization and thermal behaviour of the complex with ketoprofen. Rev Chim 2016;67:38-41.
- Tita B, Furau G, Marian E, Tita D, Furau C. Anti-inflammatory drugs interacting with Cu(ii) metal ion synthesis, characterization and thermal behaviour of the complex with ketoprofen. Rev Chim 2016;67:706-10.
- Doile MM, Fortunato AK, Schmücker IC, Schucko SK, Silva MA, Rodrigues PO. Physicochemical properties and dissolution studies of dexamethasone acetate-β-cyclodextrin inclusion complexes produced by different methods. AAPS Pharm Sci Tech 2008;9(1):314-21.
- Saikia BJ, Parthasarathy G. Fourier transform infrared spectroscopic characterization of kaolinite from Assam and meghalaya, northeastern India. J Mod Phys 2010;1(4):206-10.
- Kristo J, Frost RL, Felinger A, Mink J. FTIR spectroscopic study of intercalated kaolinite. J Mol Struct 1997;410-1:119-22.
- Pruett RJ, Murray HH. The mineralogical and geochemical controls that source rocks impose on sedimentary kaolins. In: Murray HH, Bundy WM, Harvey CC, editors, Kaolin genesis and utilization. vol 16 The Clay Minerals Society. Boulder: Colorado; 1993. p. 149-70.
- Wiewiora A, Brindley GW. Potassium acetate intercalation in kaolinite and its removal: effect of material characteristics. Proc Int Clay Con Tokyo 1969;1:723-9.
- Ghebaur A, Garea SA, Cecoltan S, Iovu H. Development and characterization of novel freeze-thawed polyvinyl alcohol/ halloysite hydrogels an approach for drug delivery application. Mater Plast 2017;1:8-13.
- Saada A, Siffert B, Papirer E. Comparison of the hydrophilicity/hydrophobicity of illities and kaolinites. J Colloid Interface Sci 1995;174(1):185-90.
- Turhan M, Sayar S, Gunasekaran S. Application of peleg model to study water absorption in chickpea during soaking.J Food Eng 2002;53(2):153-9.
