- *Corresponding Author:
- Z. Huang
Center for Molecular Diagnostic, The Sixth Affiliated Hospital of Guangzhou Medical University /People’s Hospital of Qingyuan City, Qingyuan, Guangdong 511518
E-mail: huangzhyong1981@126.com
| This article was originally published in Special issue on “Trends in therapeutic Management of Various Conditions” |
| Indian J Pharm Sci 2020:82(3) spl issue 6;97-100 |
This is an open access article distributed under the terms of the Creative Commons Attribution-NonCommercial-ShareAlike 3.0 License, which allows others to remix, tweak, and build upon the work non-commercially, as long as the author is credited and the new creations are licensed under the identical terms
Abstract
In order to explore the prevalence of thalassemia among the Yao population in Guangdong Province, China, the situation of β and α thalassemia patients in the district is analyzed by Hb hemoglobin electrophoresis and gene detection. The results have shown that the proportions of CD17 and βE to the positive β-thalassemia patients are the highest, which are the most common types of the β-thalassemia gene mutations; the β-thalassemia gene double heterozygous mutation is the least; in addition, the α-thalassemia gene detection has shown that among the positive mutation types, the αα/αα has accounted for the largest proportion, and the αα3.7/αα mutation case is the least. In summary, due to the high coincidence of β-thalassemia positive rates degree between the hemoglobin electrophoresis detection and the gene diagnosis, the higher positive rate of hemoglobin electrophoresis would indicate the higher β-thalassemia gene carrying rate and incidence rate to some extent. Therefore, to a certain extent, it can be considered that the incidence of α-thalassemia is less different among different ethnic groups and regions in Guangdong Province; however, there is a significant difference between β-thalassemia among the Yao nationality and other ethnic groups in Guangdong Province.
Keywords
Thalassemia, gene, hemoglobin, mutation, β and α
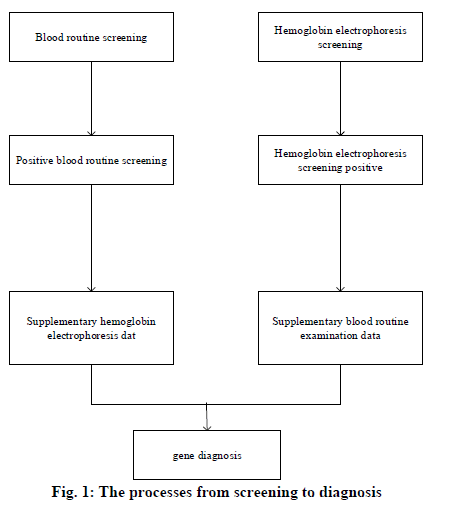
In 1925, the pediatrician Cooley in Detroit, USA, reported a disease characterized by severe anemia, skeletal deformation, and hepatomegaly and splenomegaly; this kind of disease was first seen in immigrants from Mediterranean countries such as Italy[1]; therefore, it was named as Mediterranean anemia, i.e. thalassemia. Thalassemia is the most common inherited incomplete dominant mono-genetic hereditary hemoglobinopathy among humans[2,3]. Its clinical manifestations include hemolytic anemia and methemoglobinemia, as well as the tissue hypoxia and the compensating erythrocytosis caused by the increase or decrease of hemoglobin oxygen affinity. Hemoglobin is a kind of binding protein that consists of globin and heme, whose relative molecular mass is 64,000[4]. Human hemoglobin is the tetrad formed by the polymerization of 2 pairs (4 bars) of hemoglobin monomers. Among the hemoglobin monomers, the β-chain contains 146 amino acid residues, which can reduce the stability of hemoglobin. The Hb Α, which is composed of α2β2 tetrad, is the most important type of hemoglobin globin, accounting for 97% of total hemoglobin in healthy adults and transporting 98.5% of the oxygen in blood; hemoglobin Α2 (HbΑ2) is composed of a pair of α-chains and a pair of δ-chains (α2δ2). HbΑ2 is extremely significant for the diagnosis of hemoglobinopathy[5]. In 1982, WHO defined α-thalassemia as the hemoglobinopathy caused by the imbalance between the ratios of α-globin and β-globin[6]; its clinical manifestation is the anemia with small cells, hypochromia, hemolysis, and hereditary; in addition, based on the different involved types of globin, it is classified into α-thalassemia and β-thalassemia[7]. Furthermore, the most common and dangerous types of thalassemia are the α-thalassemia and the β-thalassemia, which are caused by the mutations of the α or β globin genes respectively; besides, the phenotypes of them appear as an autosomal recessive inheritance[8]. The severe α-thalassemia fetus (Bart’s fetal anasarca) is often dead fetus in uterus occurred at late pregnancy, or immediately dies after birth; child patients with severe β-thalassemia usually develop the symptoms at 3-6 months after birth, whose lives rely on blood transfusion, and most of them would die in their childhood[9]. In summary, the situation of Yao patients with β and α thalassemia in Guangdong Province is analyzed through Hb hemoglobin electrophoresis and gene tests. Clinically, the simple diagnostic methods of thalassemia often lead to misdiagnosis; therefore, the accuracy of diagnosis can be improved through the combination of two diagnostic methods; especially for the Yao thalassemia patients, it is found that a series of joint diagnostic methods of α-thalassemia can improve the specificity of diagnosis, thereby reducing the unnecessary genetic diagnosis; in addition, the coincidence degree of β-thalassemia is high. The combined diagnostic methods not only reduce both the physical and economic burdens of thalassemia patients but also have great significances for the family inheritance. Research objects were thalassemia patients of the Yao nationality carrying β and α genes in Guangdong Province, China. The informed consent signed by the patients or their family members was obtained and this study was approved by the medical ethics committee of The Sixth Affiliated Hospital of Guangzhou Medical University /People’s Hospital of Qingyuan City. Phenotype screening techniques and genetic diagnosis are the main methods for discovering thalassemia carriers. There are many screening methods for thalassemia, which are mainly hematology and hemoglobin analysis such as erythrocyte morphology, erythrocyte index, erythrocyte osmotic fragility, hemoglobin physiochemical properties determination, hemoglobin electrophoresis, etc. Among all the screening methods, electrophoresis analysis is the most commonly used and effective method, which is an indispensable means for diagnosing Hb diseases. Specifically, the capillary electrophoresis (CE) has the characteristics of high sensitivity, high resolution, high efficiency, fastness, simple operations, the high degree of automation, and various modes of operation; in addition, it also requires fewer samples with low costs, which has better diagnostic effects for thalassemia. However, due to the differences in geographical environments and ethnic composition, the screening cutoff values used in various regions of China also vary; all localities should select appropriate cutoff values based on actual conditions. In terms of gene diagnosis, BCR and its related technologies derivatives have become the most commonly used methods for gene diagnosis. In the detection of deficient thalassemia, gαβ ΒCR and the derived mΒCR are widely used; in the detection of point mutations, ΒCR-RDB is the most efficient and accurate method for detecting such kind of thalassemia in China. The research objects were a total of 1659 samples of thalassemia patients from the Yao nationality who were diagnosed in the The Sixth Affiliated Hospital of Guangzhou Medical University /People’s Hospital of Qingyuan City. from January 1st, 2012 to December 31st, 2018. The clinical diagnosis criteria of thalassemia are as follows: The MCV cutoff values used in China vary widely, mostly 79fl or 80fl. Clinically, a small number of thalassemia patients with no small cells and hypochromia can be seen; therefore, the cutoff value of MCV is set to 80fl to improve the sensitivity of screening and reduce the rate of missed diagnosis; HbΑ2<2.4%, hemoglobin electrophoresis shows abnormal band Hb H, Hb Bart’s, and Hb CS is suspected of α-thalassemia; hemoglobin electrophoresis suggests Hb Α2>3.2% and/or Hb F>2%, through hemoglobin electrophoresis, the abnormal bands in addition to Hb H, Hb Bart’s, and Hb CS is suspected of β-thalassemia. The process from screening to diagnosis. Genetic diagnosis of all 1659 samples involved in hemoglobin electrophoresis screening was difficult to perform; therefore, only samples with positive phenotype screening results were genetically diagnosed to save the cost. The specific steps taken by the study were shown in fig. 1:
Blood samples: a total of 3mL of the peripheral venous blood was drawn and collected in the EDTA anticoagulation tubes. The 3mL of EDT anticoagulant blood was statically settled at 2-8° for several hours, or the blood sample could be centrifuged at 4800rpm for 7 min; the plasma was carefully discarded as much as possible for the reason that once the plasma thickness in the test tube exceeds 3mm, the analysis results would be affected. A total of 90μL of lysate was added into a small cup, added with 18μL of precipitated erythrocytes, and mixed well. The sample cup was placed on the SEBIΑ automatic sampling frame and pushed into the inlet of the automatic hemoglobin electrophoresis instrument. The diluted sample was injected into a capillary tube and electrophoresed at a constant voltage for 8 min, and the temperature was controlled by software. Hemoglobin was directly detected at an absorbance of 425nm, and an electrophoresis profile was displayed on the system screen. The relative values of each hemoglobin fragment were automatically displayed and the profile was analyzed. The hemoglobin electrophoresis band would automatically correspond to the corresponding background area. A total of 300μL of EDT anticoagulant peripheral blood was pipetted into a sterile 1.5mL centrifuge tube, added with 3 times volume of 1×Buffer ERL, mixed by inversion, placed at room temperature for 5 min, and centrifuged at 14000rpm for 1-3 min; the supernatant was discarded. A total of 240mL Buffer WTL was added to the pellet of the centrifuge tube; the sample was mixed well by shaking, added with 2μL of RNαse, and again mixed well by shaking. A total of 250mL Buffer BL was added; the sample was oscillated and mixed, incubated in the 65o dry bath for 10 min, and oscillated well twice until the sediment block was completely shattered. After the incubation, the sample was added with 250mL of anhydrous ethanol, oscillated and mixed well; then, all the liquid in the centrifuge tube was pipetted to the adsorption column, centrifuged at 8000rpm for 1 min, the filtrate in the collection tube was discarded, and the adsorption column was placed back into the collection tube. The adsorption column was added with 500μL of Buffer HB, centrifuged at >8000rpm for 1 min, and the filtrate was discarded. The adsorption column was added with 650μL of DNΑ Wash Buffer, centrifuged at 8000rpm for 1 mi, and the filtrate was discarded. The above DNΑ Wash Buffer step was repeated once. The absorption column was centrifuged at 13000rpm for 2 min, dried with filter paper to remove the excess absolute ethanol; the collection tube was discarded, and the adsorption column was placed into a sterilized 1.5mL Eppendorf centrifuge tube. The adsorption column was added with 50μL of 70o preheated Elution Buffer to the center of its filter and placed at 60° for 5 min to facilitate the full dissolution of DNΑ; then, it was centrifuged at 10000rpm for 1 min. The above Elution Buffer step was repeated once; the DNA liquid in the centrifuge tube was collected, diluted to 50uM after the origin concentration was determined by a UV spectrophotometer, and stored at -20°. As shown in Table 1, the human α and β gene structures are very similar, and each has three exons and two introns (IVS1, IVS2). The human alpha-globin gene contains three exons in its transcribed region, and the exon is separated by two introns of different sizes (which is also called intervening sequences, IVS). The data of hemoglobin electrophoresis, blood routine tests, and gene diagnosis were recorded through an electronic spreadsheet, and the statistical analysis was performed by using SΒSS statistics software. The count data were analyzed by B-test and T-test; the test result B<0.01 indicated statistical differences. The normal distribution of overall data was determined by a histogram. The ROC curve was used to test the diagnostic significance and the optimal cut-off value; in terms of the test results, the area under the curve was above 0.9 indicated high diagnostic significance, 0.4-0.7 indicated normal diagnostic significance; the area under the curve was below 0.4 indicated low or no diagnostic significance. The 1418 cases of positive data distributions of α and β thalassemia determined by hemoglobin electrophoresis were shown in Tables 2 and 3.
| Primers | Base sequence | Length (nt) |
|---|---|---|
| LF | GGCCGCACTGACCCTCTT | 18 |
| LR | GCTGAACCATCCCCTGTCC | 19 |
| B1 | AGGTACGGCTGTCATCAC | 18 |
| B2 | ACTTATCCCCTTCCTATGAC | 20 |
| B2F2 | ACTCTTGGGTTTCTGATAGG | 20 |
| B3F | GCTAATAGCAGCTACAATCC | 20 |
| B3R | CCAAGGTTTGAACTAGCTC | 19 |
Table 1: Human Α And Β Gene Primer Sequence
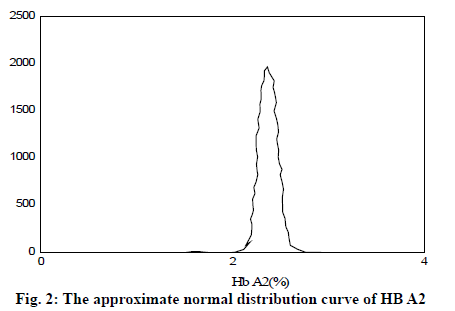
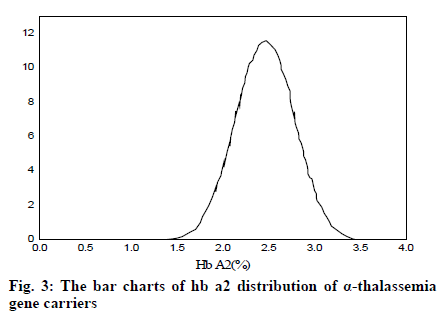
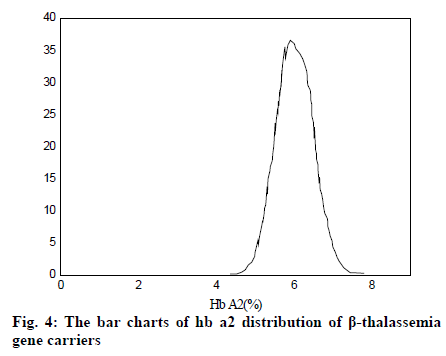
It can be seen from Table 2 and Table 3 that CD17 and βE accounted for the largest proportion of β-thalassemia gene mutations in the detection of thalassemia in the Yao area of Guangdong, which was one of the most common types of the β-thalassemia gene; the double heterozygous mutation of the β-thalassemia gene was the least, which was in line with the actual situation; among the positive mutation types detected by α-thalassemia gene, the αα/αα accounted for the largest proportion, and was the most common type of α-thalassemia gene mutation; the number of α3.7/αα mutations was the least. It can be inferred from fig. 2 that based on the current reasonable interval of Hb Α2 (2.4-3.2%), a total of 289 cases of Hb Α2 were smaller than the normal range, accounting for 2.54% of the total number; 585 cases of HbΑ2 were higher than the normal range, accounting for 6.01% of the total number. Therefore, these results indicated that the 93% confidence range for Hb Α2 content of hemoglobin electrophoresis in the general population was 2.14– 3.63%. As can be seen from fig. 3, based on the cutoff value (Hb Α26.3%) of the current α-thalassemia hemoglobin electrophoresis screening, only 72.09% of the α-thalassemia gene carriers were in the range, which caused the false negative rate of 24.01% of the α-thalassemia hemoglobin electrophoresis screening. As can be seen from fig. 4, based on the cut-off value (Hb A2>2.9%) of the current β-thalassemia hemoglobin electrophoresis screening, 8 cases were out of the range, and the results of hemoglobin electrophoresis were Hb A: 91%, Hb F: 4.8%, Hb A2: 0.3%, Hb A: 95.7%, Hb F: 4.3%, Hb A2: 1.9%, Hb A: 32.2%, Hb F: 42.1%, Hb A2: 3.3%. All the three cases were eligible for the screening criteria of β-thalassemia hemoglobin electrophoresis screening of Hb F>2.0%.
| β thalassemia genes | Phenotypes | Cases (n) |
|---|---|---|
| β thalassemia gene heterozygotes | 126 | |
| CD41-42 | β0 | 58 |
| IVS-Ⅱ-654 | β+ | 75 |
| CD17 | β0 | 234 |
| βE | βE | 173 |
| TΑTΑboxnt-29 | β+ | 145 |
| β thalassemia gene double heterozygotes | 23 |
Table 2: Gene Mutations of Β Thalassemia and the Proportions
| α thalassemia genes | Cases (n) |
|---|---|
| --SEΑ/αα | 123 |
| -α3.7/αα | 67 |
| -α3.7/ααα | 73 |
| -α4.2/αα | 89 |
| --THΑI/αα | 114 |
| -α/αα | 236 |
| -αQS/αα | 123 |
Table 3: Gene Mutations Of Α Thalassemia And The Proportions
As can be seen from Table 4, there was no significant difference in Hb and MCH between α-thalassemia gene carriers and normal people, and MCV was statistically different; in addition, there was no statistical difference in Hb between β-thalassemia gene carriers and normal people, and MCV and MCH had statistical differences.
| α and β thalassemia positive | α and β thalassemia negative | T | Β | |
|---|---|---|---|---|
| Hb | 117.92±21.93 | 147.67±22.44 | -2.690 | 0.016 |
| MCV | 62.41±8.51 | 88.07±12.32 | -8.013 | <0.02 |
| MCH | 26.80±3.00 | 34.63±54.53 | -1.463 | 0.152 |
Table 4: The Comparison of Blood Routine Tests Between Thalassemia Gene Carriers and Healthy People
References
- Wang XY, Lin MX, Lin M. A novel 6.3 kb deletion and the Rare 27.6 kb Deletion Causing α+-Thalassemia in two Chinese Patients. Hemoglobin 2016;40(5): 4.
- He J, Song W, Yang J. Next-generation sequencing improves thalassemia carrier screening among premarital adults in a high prevalence population: the Dai nationality, China. Gene Med 2017;19(9): 1022-31.
- Ding Y, He P, He N. Genetic polymorphisms of pharmacogenomic VIP variants in Li nationality of southern China. Envi Toxi Pharmacol 2016;42: 237-42.
- Liang P, Sun H, Zhang X. Effective and precise adenine base editing in mouse zygotes. Protein Cell 2018; 9(9): 808-13.
- Chen J, Peng L, Han Y. A rapid quantification method for the screening indicator for β-thalassemia with near-infrared spectroscopy. Spectrochim Acta A Mol Biomol Spectrosc 2018; 193: 499-506.
- Fang Y, Hamit M, Yan CB. Feature Extraction and Classification on Esophageal X-Ray Images of Xinjiang Kazak Nationality. J Health care Eng 2017;(5): 1-11.
- Tang XL, Liu JY. Textual research on decipher of “prescriptions for treating children's head sore” from Zhi re bing yao lun (Essentials on Treatment of Febrile Diseases) in the Western Xia regime. Zhonghua Yi Shi Za Zhi 2016;46(2): 103-10.
- Li SY, Jiang M, Yao TY. Association of Insulin Resistance and β Cell Function with Lipid Metabolism in Middle-aged and Elderly Hui and Han Populations. Zhongguo Yi Xue Ke Xue Yuan Xue Bao Acta Academiae Medicinae Sinicae 2016; 38(2): 192.
- Zhong G, Chen Y, Liu L. Association between gene polymorphism of calcium/calmodulin-dependent kinase 4 and efficacy of amlodipine in the treatment of hypertension in Chinese Han nationality. Zhong Nan Da Xue Xue Bao Yi Xue Ban 2016; 41(8): 777.


