- *Corresponding Author:
- Miunhua Wu
Department of Oncology, First Clinical Medical College, Nanjing University of Chinese Medicine, Nanjing, Jiangsu Province 210023, China
E-mail: mh_1423@163.com
| Date of Received | 04 September 2022 |
| Date of Revision | 10 January 2023 |
| Date of Acceptance | 03 October 2023 |
| Indian J Pharm Sci 2023;85(5):1353-1366 |
This is an open access article distributed under the terms of the Creative Commons Attribution-NonCommercial-ShareAlike 3.0 License, which allows others to remix, tweak, and build upon the work non-commercially, as long as the author is credited and the new creations are licensed under the identical terms
Abstract
Lung adenocarcinoma is a highly aggressive subtype of lung cancer with a high mortality rate, which makes the investigation of novel lung adenocarcinoma therapeutic targets essential. Since oxidative stress has been shown to be a cancer-specific deplete in the lung, which is highly associated with oxidative stress, it is crucial to investigate and assess the clinical value of oxidative stress-related target genes in lung adenocarcinoma. In the current study, we obtained 3170 differentially expressed genes via differential analysis and 1058 oxidative stress-related genes via the molecular signatures database. Upon analyzing their intersection, 207 genes were identified. tRNA-histidine guanylyltransferase 1 like protein, glutathione peroxidase 8, and mitogen-activated protein kinase 3 were identified as lung adenocarcinoma biomarkers using machine learning algorithms. The tumor immune infiltrating analysis revealed that the tRNA-histidine guanylyltransferase 1 like protein gene is associated with the infiltration of regulatory T cells. In addition, the multivariate analysis revealed that elevated tRNA-histidine guanylyltransferase 1 like protein expression is a significant, independent predictor of overall survival. Furthermore, the pan-cancer analysis revealed that elevated tRNA-histidine guanylyltransferase 1 like protein expression is related to a worse prognosis in a variety of cancers. In light of these findings, the identification of tRNA-histidine guanylyltransferase 1 like protein as a novel biological marker may shed light on potential function mechanisms and the impact of the immune microenvironment in lung adenocarcinoma.
Keywords
Bioinformatics, the cancer genome atlas, tRNA-histidine guanylyltransferase 1 protein, lung adenocarcinoma
Lung Adenocarcinoma (LUAD) is the second most common cancer worldwide and the leading cause of cancer-related deaths[1]. In this regard, the missing of timely detection and drug resistance have contributed to LUAD's persistently high mortality rate, making it imperative that the disease's mechanisms be investigated[2,3]. LUAD development is a complex, multistep process that may be linked to aberrant gene expression. Consequently, a deeper comprehension of the molecular mechanisms underlying LUAD could lead to the development of more precise biomarkers for the treatment of LUAD. In this regard, machine learning, an innovative datadriven concept-acquisition approach[4] that was created for accurate prediction and classification in medicine, can enable researchers to uncover previously concealed insights[5].
Oxidative stress can act as a significant and varied regulator of cellular signaling processes, potentially instigating the onset of malignant tumors[6]. Within the context of LUAD, an overabundance of oxidative stress expressions critically influences advancement via cell signaling pathways intimately connected to tumor proliferation[7,8]. The tRNAHistidine Guanylyltransferase 1 Like protein (THG1L) gene is an oxidative stress-related gene, encodes a multifunctional protein that is specific to mitochondria and localized within the inner mitochondrial membrane[9-12]. Congenital diseases have been the focus of THG1L research in recent years. Accordingly, multiple congenital diseases, such as hematological abnormalities, severe developmental delays and epilepsy, have been linked to variants of the THG1L gene[13,14]. However, comprehensive studies analyzing the role of THG1L in LUAD are largely limited.
Using large-scale sequencing and bioinformatics analysis, various expressions of Oxidative Stress- Related Genes (OSRGs) were screened in this article. Utilizing (LASSO)-Cox regression analysis and the random forest algorithm, we identified three genes associated with the prognosis. Because the function of THG1L in LUAD has not been reported previously, the expression level of THG1L in LUAD was analyzed and its prognostic value was evaluated in LUAD patients. Lastly, the relationship between THG1L and immune cell infiltration, immunotherapy, and medication response was discussed to provide insight into the mechanism and role of THG1L in LUAD.
Materials and Methods
Data sources:
The University California Santa Cruz (UCSC) Xena Browser (https://xena.ucsc.edu/) was utilized to retrieve the Fragments Per Kilo base of exon per Million Mapped fragments (FPKM) form Ribonucleic Acid (RNA)-Seq data from The Cancer Genome Atlas (TCGA) database for 585 LUAD samples and the Genotype-Tissue Expression (GTEx) database for 288 normal lung tissue samples[15].
In addition, the UCSC Xena Browser was used to obtain the pan-cancer expression data. Furthermore, the clinical information regarding 522 samples was obtained from the TCGA dataset (https://portal.gdc.cancer.gov/). Moreover, RNAseq data (GSE108214) of cisplatin-resistant and sensitive LUAD cells were obtained from the Gene Expression Omnibus (GEO) database. Additionally, we collected the small conditional RNA (scRNA)-seq data from patients with LUAD (GSE117570). Meanwhile, 1058 genes associated with oxidative stress were obtained from the Molecular Signatures Database (MSigDB) (https:// www.gsea-msigdb.org/). All procedures were carried out using Strawberry Perl (version 5.30.0) and R (version 4.3.0) (Table 1).
| Gene | Forward primer sequence (5'–3') | Reverse primer sequence (5'–3') |
|---|---|---|
| THG1L | GTTAAGGTTCACGATTCCTTGGC | TCACGTACTCGAACTTGCTTTT |
| GAPDH | AATGGGCAGCCGTTAGGAAA | GCCCAATACGACCAAATCAGAG |
Table 1: The Sequences Of Primer Pairs for the Target Genes
Identification of differentially expressed oxidative stress related genes:
Differentially Expressed Genes (DEGs) between cisplatin-resistant and cisplatin-sensitive LUAD cells in the GSE108214 database were analyzed using the "limma" package of R, p<0.05 and |log2 Fold-Change (FC)|>1. Moreover, differentially expressed OSRDEGs were obtained by taking the intersection of OSRGs and DEGs. In addition, we employed the STRING database to explore the Protein-Protein Interaction (PPI) network of OSRDEGs. We leveraged the Maximal Clique Centrality (MCC) algorithms from the cytoHubba plug-in within Cytoscape (v3.7.2) to pinpoint central genes. The top 20 genes were identified as these hub genes.Differentially Expressed Genes (DEGs) between cisplatin-resistant and cisplatin-sensitive LUAD cells in the GSE108214 database were analyzed using the "limma" package of R, p<0.05 and |log2 Fold-Change (FC)|>1. Moreover, differentially expressed OSRDEGs were obtained by taking the intersection of OSRGs and DEGs. In addition, we employed the STRING database to explore the Protein-Protein Interaction (PPI) network of OSRDEGs. We leveraged the Maximal Clique Centrality (MCC) algorithms from the cytoHubba plug-in within Cytoscape (v3.7.2) to pinpoint central genes. The top 20 genes were identified as these hub genes.
Identification of prognosis genes by machine learning:
OSRDEGs for the TCGA database were subjected to a univariate Cox analysis to ascertain the molecules that were significantly correlated with patient survival. In order to optimize variables, the LASSO logistic regression machine learning algorithm was used. The optimized variables were then utilized in a multivariable Cox analysis. At the same time, the "random forest" package was utilized to analyze the most significant prognosis genes. The intersection genes were then discovered using multivariate Cox and random forest analysis, and were selected as potential LUAD patient indicators.
Function and enrichment analysis:
Using the "clusterProfiler" package, potential targets were subjected to Gene Ontology (GO) and Kyoto Encyclopedia of Genes and Genomes (KEGG) enrichment analyses with a p value of 0.05 serving as the filtering standard for functional analysis. The Gene Set Enrichment Analysis (GSEA) was used to explain variations in the concentrations of putative biomarkers along coordinate pathways. The R packages "clusterProfiler" and "ggpolt2" were subsequently employed to analyze and visualize GSEA data. The significance of GSEA analysis enrichment was determined by threshold values (p value 0.05)
Immune-related analysis:
By using the Estimation of Stromal and Immune cells in Malignant Tumor tissues using Expression data (ESTIMATE), single-sample Gene Set Enrichment Analysis (ssGSEA), and Tumor Immune Estimation Resource (TIMER) algorithms, associations between THG1L expression and Tumor-Infiltrating Immune Cells (TIICs) in tumor tissues were analyzed. The R package "ESTIMATE [1.0.13]" was used to compute immune and stromal score between groups with different gene expression. Moreover, the relative infiltration of 16 distinct immune cell types was estimated using the TCGA dataset. The TIMER database's gene module was utilized to look into the possible immunomodulatory mechanisms of THG1L[16,17]. Furthermore, The Cancer Immunome Database (TCIA) was utilized to calculate the IPS score of LUAD patients[18,19]. Additionally, Tumor Immune Dysfunction and Exclusion (TIDE) algorithm was used to estimate the immunotherapy response of the patients[20].
THG1L and medication response:
The correlation between drug sensitivity and THG1L expression was observed using CellMiner (http://discover.nci.nih.gov/cellminer). CellMiner was created for the community of cancer researchers to make it easier to analyze and incorporate pharmacological and molecular information for the NCl-60 tumor cell line. Accordingly, sixty distinct human cancer cell lines derived from NCI-60 were used to test more than 100 000 items.
Single-cell analysis:
The expression matrices for GSE117570 were obtained from the GEO database. The "Seurat" package was responsible for ensuring quality and dimension reduction. During the initial phase of quality control, Seurat objects were created for the LUAD groups and eliminated cells expressing fewer than 200 genes. Also excluded were genes expressed in less than three cells. After normalizing the gene expression profiles of the remaining cells, the Variance Stabilizing Transformation (VST) method was used to identify 2000 highly variable genes in every collection. The principal component analysis was performed after all transcripts were scaled. Unsupervised clustering (resolution= 1) was then employed to cluster the cells, which were subsequently visualized by Uniform Manifold Approximation and Projection (UMAP) algorithm using the top 20 principal components. Using the "singler" package, cell-type annotation was carried out. Furthermore, IrGSEA was used to integrate all single-cell rank-based gene set enrichment analyses with the Antiviral Peptides (AVPs), and the UCell enrichment scoring procedure was selected.
Statistical analysis:
The R programming language and environment were utilized for all statistical analyses. In addition, the "survminer" package of R was used to construct Kaplan–Meier (KM) curves; additionally, multivariable and univariable Cox regression analyses were conducted. The Receiver Operation Characteristic (ROC) and Area Under the Curve (AUC) are generated in order to compare the diagnostic and prognostic capabilities of THG1L. The Wilcoxon test was used to compare the enrichment scores, expression levels, and IPS of the two groups.
Immunohistochemistry (IHC) results from Human Protein Atlas (HPA):
The HPA (http://www.proteinatlas.org) was consulted to confirm the protein expression levels of THG1L in LUAD and normal tissues using IHC data. On the basis of proteomics, the HPA could provide IHC results for multiple proteins in both cancerous and noncancerous tissues.
Cell culture and transient transfection:
The Zhonggiao Xinzhou Biotechnology Institute supplied the human LUAD cell lines H1395 and H2009, as well as the human normal lung epithelial cell line BEAS-2B, which were all cultured in F-12 Dulbecco's Modified Eagle Medium (DMEM) containing 10 % fetal bovine serum. Both cell lines were kept in a humid incubator maintained at 37° and 5 % Carbon dioxide (CO2). The cells were then transfected with THG1L small interfering Ribonucleic Acid (siRNA) and the Negative Control (NC) using Lipofectamine 2000 (Invitrogen, United States of America (USA)).
The target sequences for THG1L siRNA were GTGATGAGTACAGCTTTGTGTTC (si-THG1L-1) and TTGTGTTCAAGCGGAAAACCAAT (si- THG1L-2).
Western blot:
Radio-Immunoprecipitation Assay (RIPA) buffer (Beyotime, China) was used to lyse the BEAS-2B, H1395, and H2009 cell lines. The samples were then denatured for 15 min at 100°. After being separated by 10 % Sodium Dodecyl-Sulfate Polyacrylamide Gel Electrophoresis (SDS-PAGE), the protein samples were transferred to Polyvinylidene Fluoride (PVDF) membranes. After an hour of blocking with a solution containing 5 % Bovine Serum Albumin (BSA), the membranes were incubated with primary antibodies for an entire day. The secondary antibodies were then applied for an additional 2 h at room temperature.
Reverse Transcription-quantitative Polymerase Chain Reaction (RT-qPCR):
The total RNA was isolated from the BEAS-2B, H1395, and H2009 cell lines using the TRIzol reagent (Thermo Fisher, USA). Subsequently, RNA from each sample (2 μg) was subjected to RT-qPCR using SYBR Green Master and the Light- Cycler 480 PCR System (Roche, USA). The complementary Deoxyribonucleic Acid (cDNA) was used as a template in a 20 μl reaction volume containing 10 μl of PCR mixture, 0.5 μl of forward and reverse primers, 2 μl of cDNA template, and the necessary amount of water. Threshold cycle (CT) readings were then collected and normalized to Glyceraldehyde 3-Phosphate Dehydrogenase (GAPDH) levels for all samples using the 2-ΔΔCT method.
Cell viability:
The Cell Counting Kit-8 (CCK-8) test was used to measure cell viability in accordance with product recommendations (Beyotime, China). Cells from various treatments were grown at a density of 1×10³ cells per well in 96-well plates. At each of the specified intervals, CCK-8 solution was applied. The Optical Density (OD) 450 values of each well were then calculated using a microplate reader (Thermo Fisher, USA) during a 2 h incubation period at 37°.
Transwell assay:
Human lung cancer cells (H1395, H2009) were tested for migration and invasion using transwell assays. Matrigel (BD Biosciences, USA) coated or uncoated chambers were inoculated with the human lung cancer cells (5×10⁴). Serum Free Medium (SFM) was used to add the top layer, whereas DMEM was used to add the bottom layer. After a 24 h incubation period, migrating or invading cells were stained with 0.1 % crystalline violet and then fixed with 4 % paraformaldehyde. The cells were counted with the aid of an optical microscope.
Flow cytometry:
Flow cytometry was used to analyze the cell cycle and apoptosis of H1395 and H2009 according to the manufacturer's protocol. To detect the cell cycle, cells were harvested with trypsin and resuspended in Phosphate Buffer Saline (PBS) at a concentration of 1×10⁵/200 μl. The cells were then stained with propidium iodide on ice for 30 min. For the detection of cell apoptosis, cells were harvested with trypsin and stained for 30 min on ice with Annexin V-Fluorescein Isothiocyante (FITC) and Propidium Iodide (PI) solution while being shielded from light. After PBS washing, all samples were identified using a BD FACS Calibur flow cytometer (BD, USA).
Results and Discussion
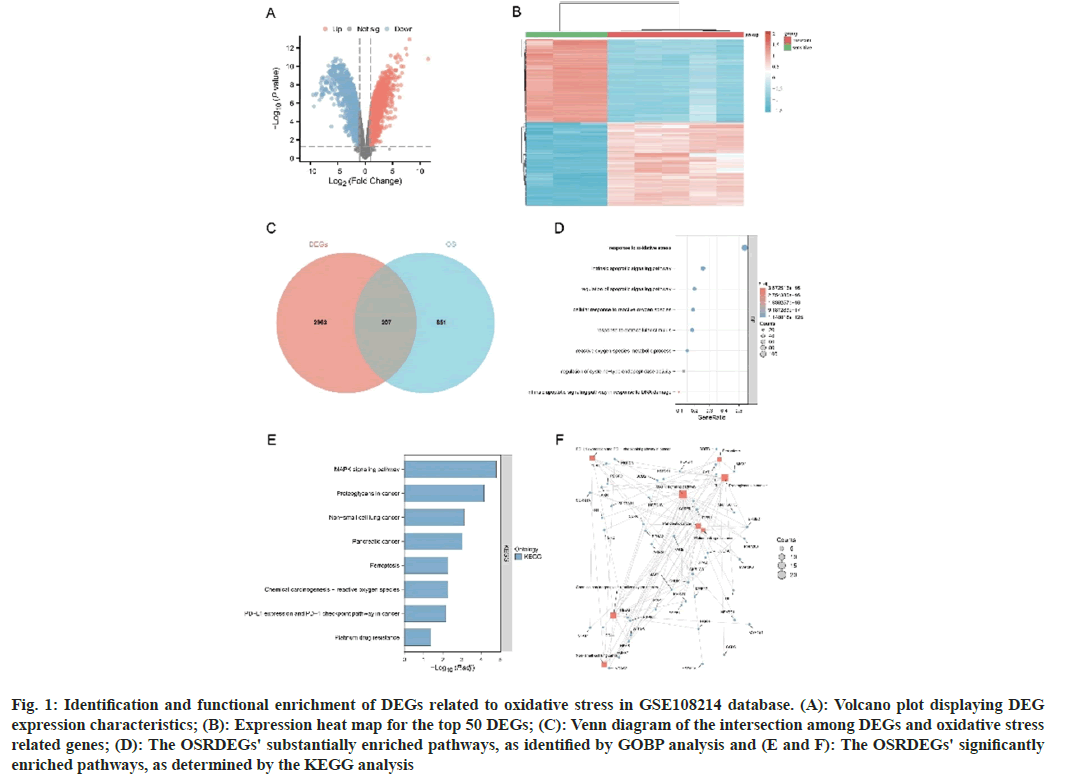
A total of 3170 DEGs were extracted from the GSE108214 database (fig. 1A). In addition, fig. 1B demonstrates a significant difference in the top 50 DEGs between cisplatin-sensitive and cisplatinresistant groups. Furthermore, 207 OSRDEGs were identified by intersecting DEGs with genes related to oxidative stress (fig. 1C). Furthermore, the hub gene of OSRDEGs was identified. Gene Ontology Biological Process (GOBP) enrichment analyses for these OSRDEGs revealed that the majority of their functions involve "response to oxidative stress", "regulation of apoptotic signaling pathway", and "cellular response to reactive oxygen species" (fig. 1D-fig. 1F), further demonstrate the "MAPK signaling pathway," "proteoglycans in cancer," and "non-small cell lung cancer," as demonstrated by the KEGG enrichment analyses.
Fig. 1: Identification and functional enrichment of DEGs related to oxidative stress in GSE108214 database. (A): Volcano plot displaying DEG expression characteristics; (B): Expression heat map for the top 50 DEGs; (C): Venn diagram of the intersection among DEGs and oxidative stress related genes; (D): The OSRDEGs' substantially enriched pathways, as identified by GOBP analysis and (E and F): The OSRDEGs' significantly enriched pathways, as determined by the KEGG analysis
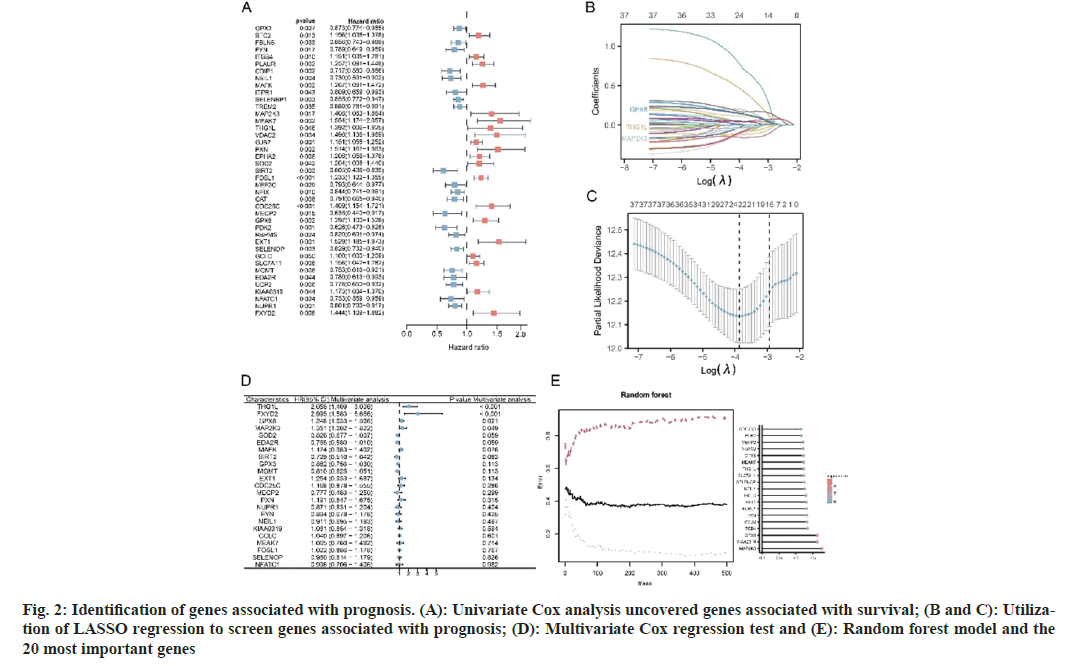
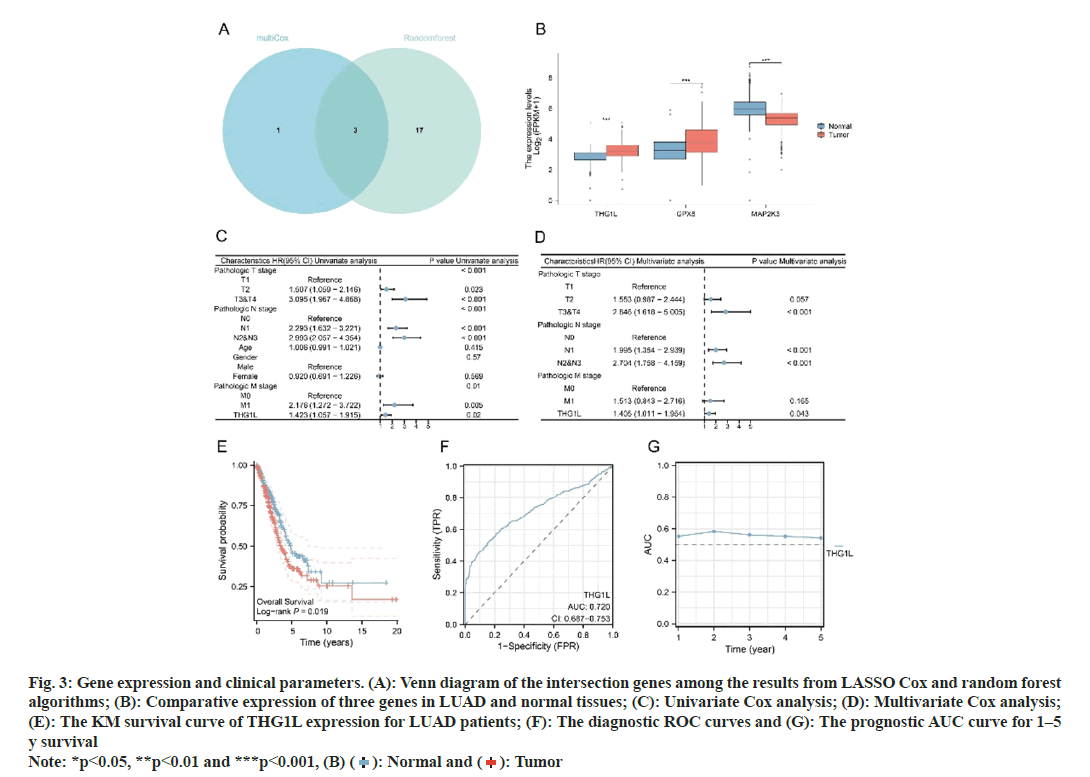
First, using Univariate Cox regression analysis on TCGA tumor tissue to identify prognostic-related OSRDEGs (p<0.05), 41 prognostic genes were identified (fig. 2A). Subsequently, prognostic genes, such as THG1L, FXYD Domain Containing Ion Transport Regulator 2 (FXYD2), Glutathione Peroxidase 8 (GPX-8), and MAP2K3, were screened with LASSO Cox regression (fig. 2B-fig. 2D). Moreover, the top 20 genes identified by random forest were selected as potential prognostic genes (fig. 2E). Combining the results of the LASSO Cox and random forest algorithms yielded THG1L, GPX8, and MAP2K3 as potential prognostic-related genes for LUAD (fig. 3A).
Fig. 2: Identification of genes associated with prognosis. (A): Univariate Cox analysis uncovered genes associated with survival; (B and C): Utilization of LASSO regression to screen genes associated with prognosis; (D): Multivariate Cox regression test and (E): Random forest model and the 20 most important genes
Fig. 3: Gene expression and clinical parameters. (A): Venn diagram of the intersection genes among the results from LASSO Cox and random forest
algorithms; (B): Comparative expression of three genes in LUAD and normal tissues; (C): Univariate Cox analysis; (D): Multivariate Cox analysis;
(E): The KM survival curve of THG1L expression for LUAD patients; (F): The diagnostic ROC curves and (G): The prognostic AUC curve for 1–5
y survival Note: *p<0.05, **p<0.01 and ***p<0.001, (B) ( ): Normal and (
 ): Tumor
Furthermore, as illustrated in fig. 3B, three genes showed significant expression differences between LUAD and normal tissues.
The function of THG1L within LUAD has not been reported previously. Herein, we selected THG1L from three potential biomarkers for further study. Accordingly, Cox analyses were conducted on patients with LUAD to determine the effect of THG1L expression and other clinical pathology factors on survival. As observed in fig. 3C, T classification, lymph node metastasis, distant metastasis, and THG1L were found to be significant survival predictors. In addition, THG1L was also found to function as an independent predictor of overall survival, as evident from the results of the multivariate analysis (fig. 3D). Moreover, THG1L overexpression was lead to a shorter overall survival for LUAD patients, according to survival analysis (fig. 3E). Based on the ROC study for diagnosis, THG1's AUC value was found to be 0.720 (fig. 3F). In addition, the prognostic AUC value for 1 y to 5 y survival was found to range between 0.5418-0.58241 as shown in fig. 3G.
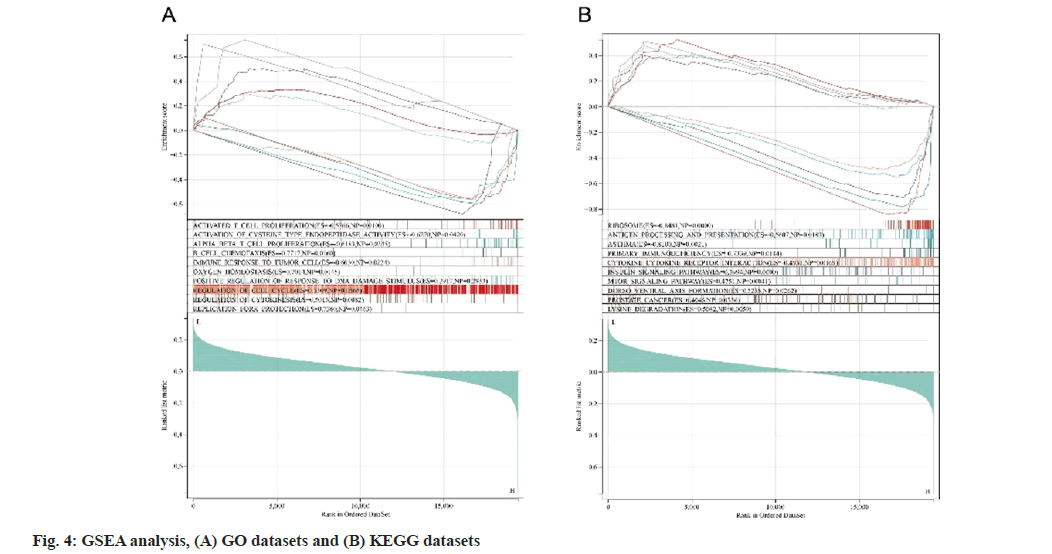
To explore the putative functions of THG1L, GO and KEGG analyses were constructed. We identified 10 gene pathways that are correlated with THG1L expression and found that THG1L is strongly associated with cell cycle- and immunerelated gene pathways. THG1L expression levels are correlated well with the proliferation of activated T cells, alpha beta T cells, B cells, immune responses to tumor cells, and cell cycle regulation (fig. 4A). Furthermore, as determined by the KEGG analysis, fig. 4B demonstrates that ribosome, antigen processing and presentation, cytokine-cytokine receptor interaction, and prostate cancer are associated with THG1L expression.
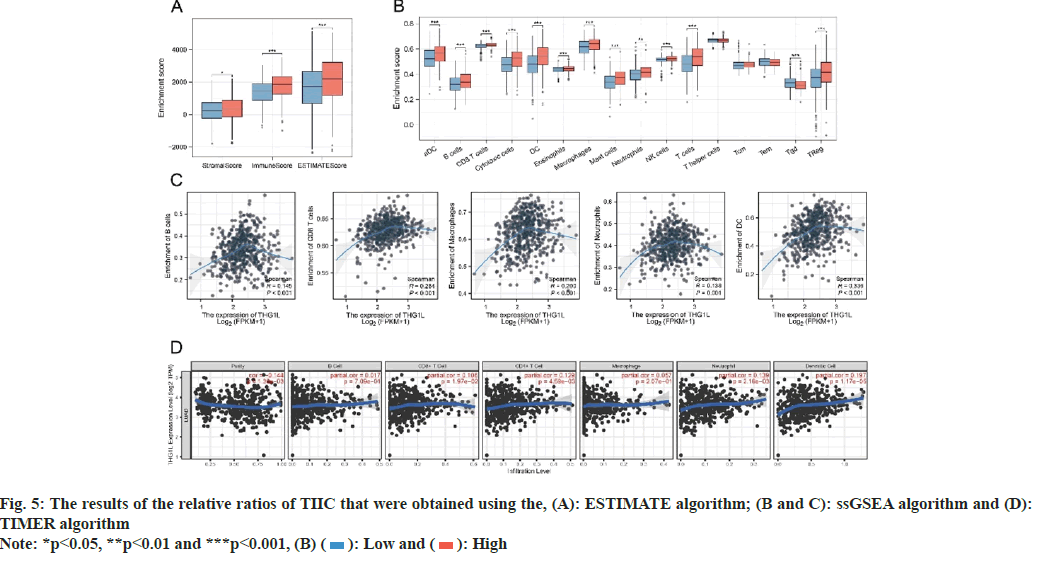
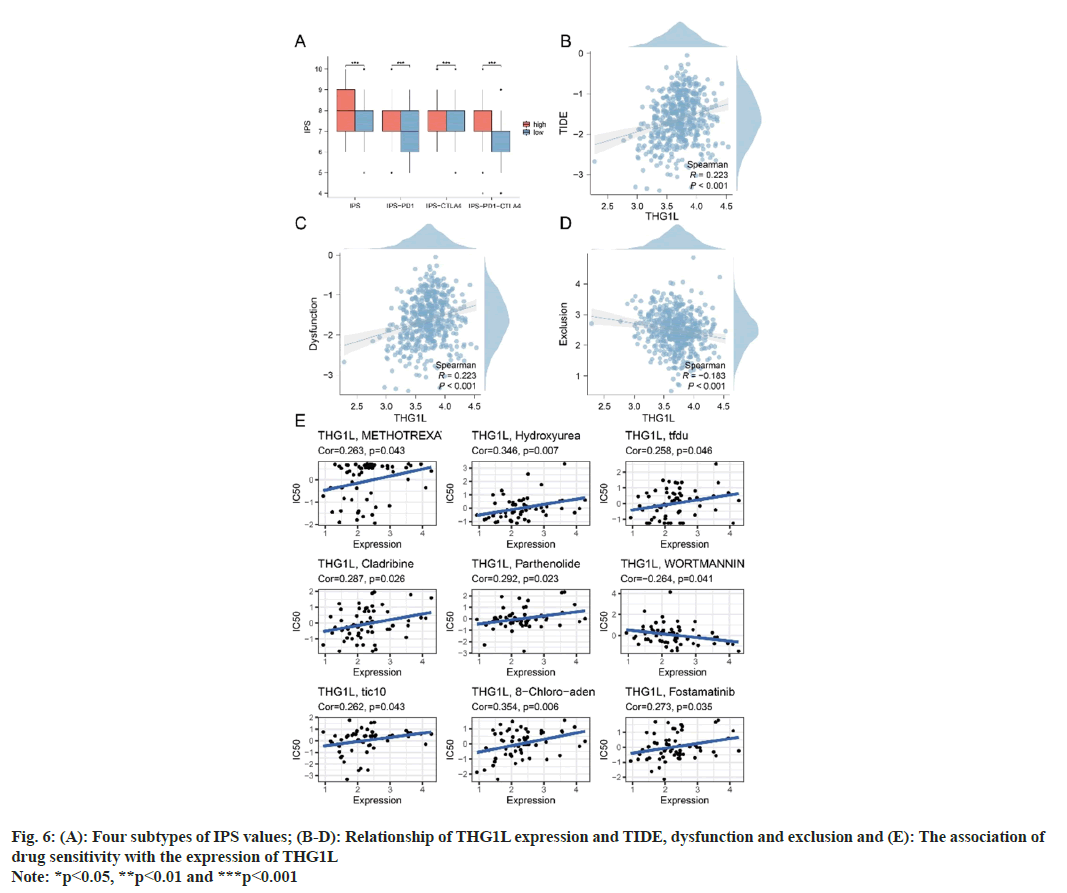
fig. 5A demonstrates a positive correlation between THG1L and immunological, stromal and estimate scores as measured by ESTIMATE. This suggests that the high expression of THG1L in tumor tissues may be linked to the immunity and stromal cell infiltration. Furthermore, the immune microenvironment of LUAD samples was quantified using the ssGSEA and TIMER algorithms. As determined by ssGSEA, the immune infiltration patterns of patients with high and low THG1L expression were distinct (fig. 5B). Immunological correlation demonstrated that THG1L can increase B cells, Cluster of Differentiation 8 (CD8+) T cells, macrophages, neutrophils, and Dendritic cells (DCs) cells in the LUAD microenvironment while decreasing Tgd cells (fig. 5C). In addition, the results of TIMER validate the ssGSEA conclusion (fig. 5D). Furthermore, the group with elevated THG1L expression had higher International Prognostic Score (IPS), IPS- Programmed cell death protein 1 (PD1), IPS-Cytotoxic T-Lymphocyte Associated protein 4 (CTLA4), and IPS-PD1-CTLA4 scores (fig. 6A). Additionally, a positive correlation was observed between THG1L expression and TIDE dysfunction (fig. 6B- fig. 6D).
THG1L expression was negatively correlated with medication response in patients receiving methotrexate, hydroxyurea, trifluridinein, cladribine, parthenolide, TIC10, and fostamatinib. Moreover, THG1L expression was positively associated with medication response in wortmannin-treated patients. Fig. 6E illustrates the correlation between THG1L expression and the anticipated medication response.
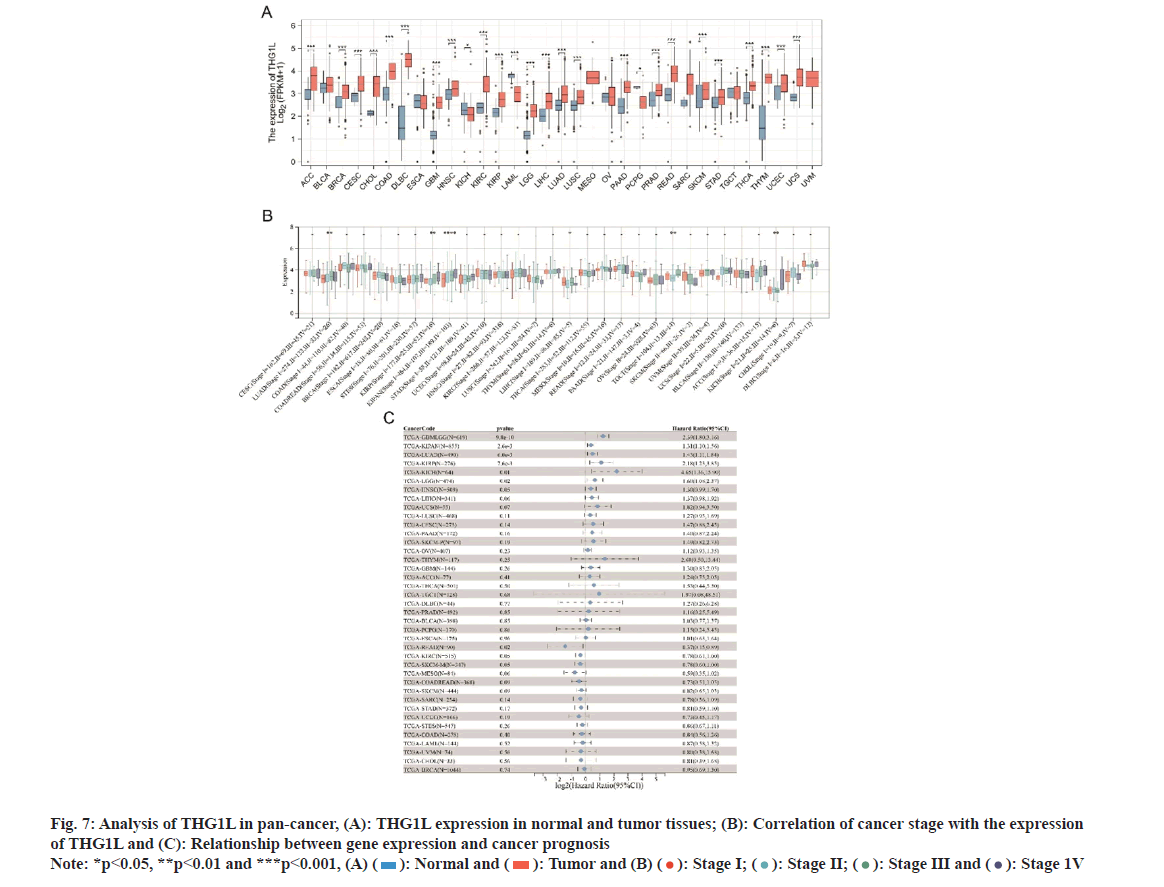
As depicted in fig. 7A, THG1L was found to be differentially expressed in various malignancies. Accordingly, a significant association was observed between THG1L and stages of LUAD, Liver Hepatocellular Carcinoma (LIHC), Testicular Germ Cell Tumors (TGCT), and Kidney Chromophobe (KICH) (fig. 7B). However, certain cancers, including Glioblastoma Multiforme (GBM), brain Lower Grade Glioma (LGG), LUAD, KIRP and KICH, had a poor prognosis when THG1L was overexpressed (fig. 7C).
Fig. 7: Analysis of THG1L in pan-cancer, (A): THG1L expression in normal and tumor tissues; (B): Correlation of cancer stage with the expression
of THG1L and (C): Relationship between gene expression and cancer prognosis Note: *p<0.05, **p<0.01 and ***p<0.001, (A) ( ): Normal and (
 ): Tumor and (B) (
 ): Stage I; (
 ): Stage II; (
 ): Stage III and (
 ): Stage 1V
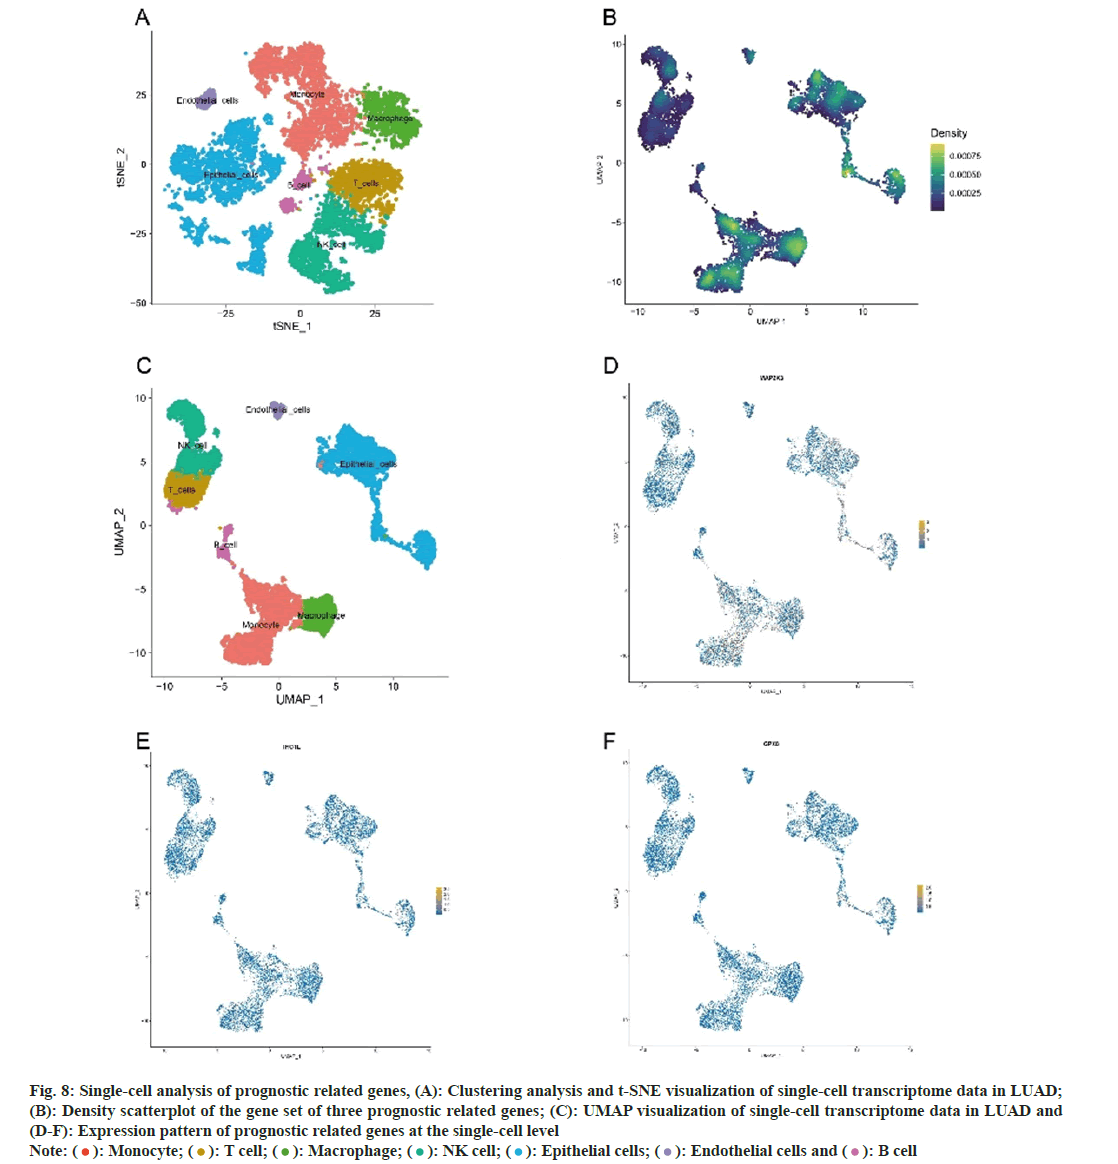
A total of 11 147 genes were extracted from 11 453 cells following a quality control examination. The number of genes (nFeature), the number of sequences per cell (nCount), the proportion of mitochondrial genes (percent.mt), and the proportion of ribosome genes (percent.rb) were displayed using Vlnplots. nCount was positively correlated with nFeature, as determined by correlation analyses. Twenty PCs were identified subsequently. In addition, cluster tree was used to identify the optimal resolution. The top 20 PCs were selected for t-SNE and UMAP analyses. By the cell-type annotations of UMAP and t-Distributed Stochastic Neighbor Embedding (t-SNE), LUAD cells were classified into seven groups (fig. 8A and fig. 8B); monocyte, T cells, macrophage, Natural Killer cells (NK cells), epithelial cells, endothelial cells, and B cells. Fig. 8C-fig. 8F depicts the levels of expression of three prognostic-related genes in LUAD cell populations. In addition, rank-based single-cell GSEA revealed that macrophage, monocyte and epithelial cells had a higher enrichment score (fig. 8C).
Fig. 8: Single-cell analysis of prognostic related genes, (A): Clustering analysis and t-SNE visualization of single-cell transcriptome data in LUAD;
(B): Density scatterplot of the gene set of three prognostic related genes; (C): UMAP visualization of single-cell transcriptome data in LUAD and
(D-F): Expression pattern of prognostic related genes at the single-cell level Note: ( ): Monocyte; (
 ): T cell; (
 ): Macrophage; (
 ): NK cell; (
 ): Epithelial cells; (
 ): Endothelial cells and (
 ): B cell
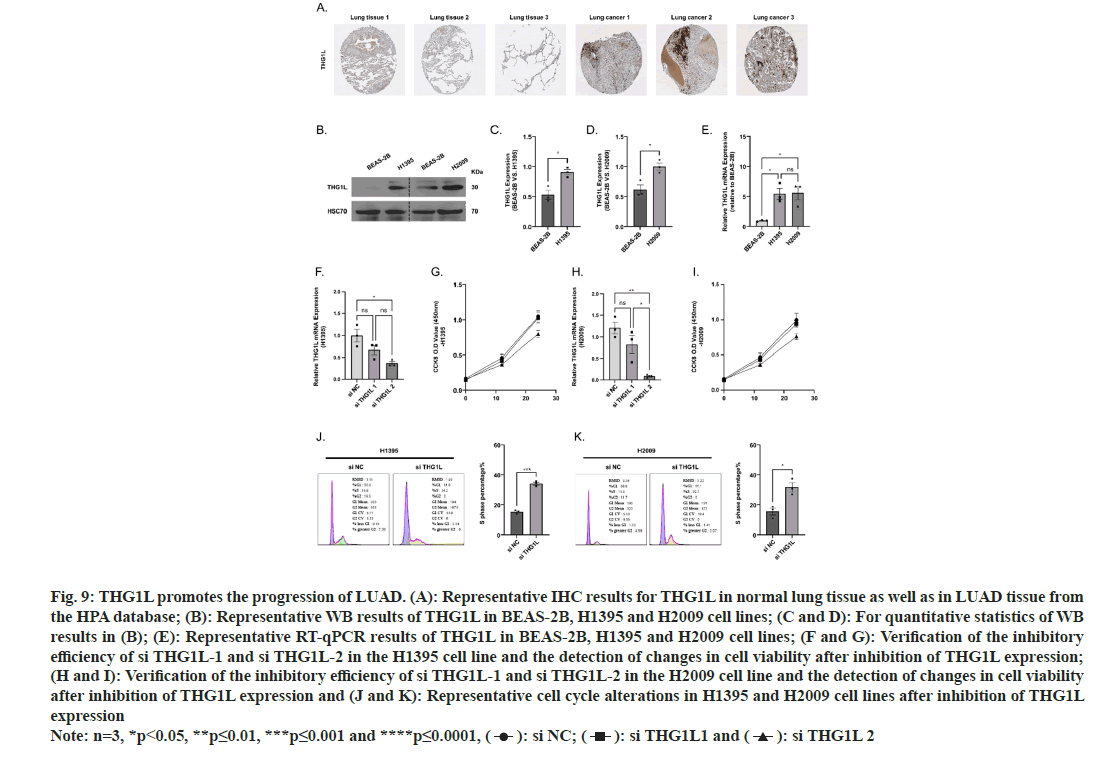
Fig. 9A illustrates that THG1L expression is elevated in patients with LUAD based on IHC results from patient tissue sections retrieved from the HPA database. THG1L was upregulated in LUAD cell lines as determined by Western blot and RT-qPCR (fig. 9B- fig. 9E) in BEAS-2B, H1395, and H2009. After determining that THG1L was upregulated in LUAD tissues and LUAD cell lines, we constructed two small interfering RNAs targeting THG1L. After RT-qPCR assay, we discovered that si THG1L-2 had the best interference effect (fig. 9F-fig. 9H). The results of Cell Counting Kit-8 (CCK-8) demonstrated that si THG1L-2 had the best ability to inhibit the viability of H1395 and H2009 cell lines (fig. 9I).
Fig. 9: THG1L promotes the progression of LUAD. (A): Representative IHC results for THG1L in normal lung tissue as well as in LUAD tissue from
the HPA database; (B): Representative WB results of THG1L in BEAS-2B, H1395 and H2009 cell lines; (C and D): For quantitative statistics of WB
results in (B); (E): Representative RT-qPCR results of THG1L in BEAS-2B, H1395 and H2009 cell lines; (F and G): Verification of the inhibitory
efficiency of si THG1L-1 and si THG1L-2 in the H1395 cell line and the detection of changes in cell viability after inhibition of THG1L expression;
(H and I): Verification of the inhibitory efficiency of si THG1L-1 and si THG1L-2 in the H2009 cell line and the detection of changes in cell viability
after inhibition of THG1L expression and (J and K): Representative cell cycle alterations in H1395 and H2009 cell lines after inhibition of THG1L
expression Note: n=3, *p<0.05, **p≤0.01, ***p≤0.001 and ****p≤0.0001, ( ): si NC; (
 ): si THG1L1 and (
 ): si THG1L 2
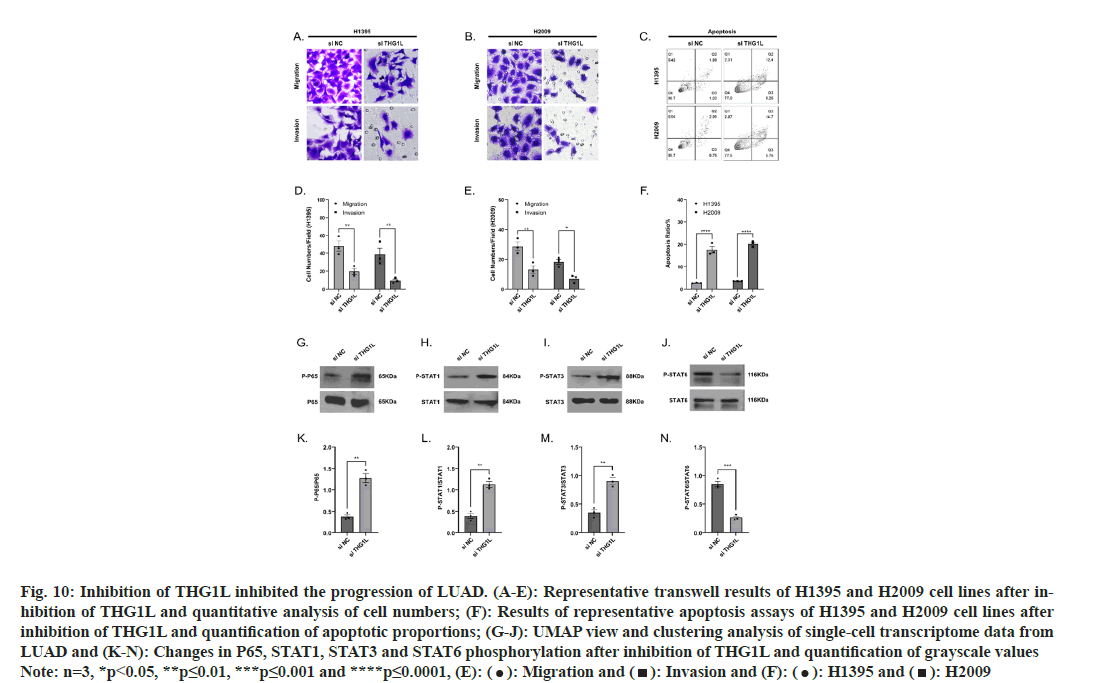
Changes in the cell cycle directly reflect alterations in proliferative capacity. Inhibition of THG1L expression in H1395 and H2009 cell lines resulted in a prolongation of the S phase and a decrease in cell proliferation capacity (fig. 9J and fig. 9K). Meanwhile, the Transwell assay and cellular apoptosis demonstrated that inhibition of THG1L expression decreased the migration and invasion ability of cells and increased the proportion of apoptosis (fig. 10A-fig. 10F). Lastly, we compared the alteration of proteins associated with inflammatory expression in LUAD cell lines before and after inhibition of THG1L expression. It was seen that the phosphorylation levels of P65, STAT1, and STAT3 were significantly increased (fig. 10G-fig. 10N), whereas the phosphorylation levels of STAT6 were significantly decreased after THG1L inhibition and the elevated levels of cellular inflammation may contribute to immunotherapy.
Fig. 10: Inhibition of THG1L inhibited the progression of LUAD. (A-E): Representative transwell results of H1395 and H2009 cell lines after inhibition
of THG1L and quantitative analysis of cell numbers; (F): Results of representative apoptosis assays of H1395 and H2009 cell lines after
inhibition of THG1L and quantification of apoptotic proportions; (G-J): UMAP view and clustering analysis of single-cell transcriptome data from
LUAD and (K-N): Changes in P65, STAT1, STAT3 and STAT6 phosphorylation after inhibition of THG1L and quantification of grayscale values Note: n=3, *p<0.05, **p≤0.01, ***p≤0.001 and ****p≤0.0001, (E): ( ): Migration and (
 ): Invasion and (F): (
 ): H1395 and (
 ): H2009
LUAD is a significant cause of cancer-related deaths worldwide, posing an enormous public health challenge[21]. Despite advances in the comprehension of its prognostic and predictive markers, personalizing treatments and predicting outcomes continue to present formidable challenges. Oxidative stress, a common denominator in many malignancies, exerts considerable influence on metabolic processes, angiogenesis and metastasis[22-24]. Oxidative stressderived aggressive phenotypes and therapeutic resistance are caused by the interaction of oxidative stress with cancer-related hallmarks/ pathways, and they can be utilized to predict the outcomes of LUAD patients[25-28]. Thus, in order to predict the prognosis and improve the treatment of LUAD patients, it is necessary to search for genes associated with oxidative stress, as oxidative stress is a crucial factor in the progression of cancer.
Using algorithms for machine learning, we identified three potential biomarkers for oxidative stress in our study. In addition, the immune infiltration, clinical correlation, putative action pathway, and single-cell expression of the pathogens were evaluated. The function of THG1L in LUAD has not been reported in earlier studies. As a result, THG1L was selected for further research. Our findings underscore the critical role of THG1L in LUAD's pathogenesis, hinting at its prospective use as a therapeutic target and prognostic marker. In our investigation, we discovered that THG1L expression increased significantly in LUAD. Patients with LUAD and an elevated THG1L expression level had a poor prognosis. Moreover, we conducted COX and ROC analyses in order to identify THG1L as a diagnostic and prognostic gene for LUAD patients. In addition, a pancancer analysis suggested a negative prognostic association between high THG1L expression and certain cancers. These results indicate that THG1L may be an oncogene and is essential for the development of LUAD.
However, the THG1L mechanism in LUAD remains ambiguous. Hickey et al., have shown that THG1L expression enhances mitochondrial biogenesis and amplifies profibrotic TGF-β1 signaling. Inhibition of endogenous THG1 L expression reduces mitochondrial respiratory capacity, fusion and ATP production, according to this study. In contrast, THG1L overexpression induced mitochondrial fusion and protected cells from apoptosis induced by reactive oxygen species. This suggests THG1L as a regulatory component in the dynamic control of mitochondria and bioenergetics, promoting cell survival under oxidative stress conditions[29]. Bhreathnach et al, identified three THG1L binding partners, HSPA5, TRAP1 and YBX1 that are instrumental in the cellular response to oxidative stress and indispensable for mitochondrial DNA repair[12]. Despite the link between THG1L and LUAD has not been clarified in detail, our findings and previous research on THG1L indicate that promoting mitochondrial survival and quality in response to oxidant stress may be THG1L's potential role in LUAD.
The putative biological functions of THG1L in LUAD were also investigated in the current study using GO and KEGG analysis and GSEA. GSEA uncovered significant differences in GO and KEGG enrichment between samples with high and low THG1L concentrations. Specifically, GESA analysis revealed the enrichment of numerous DNA damage-related and immune-related pathways, such as activated T cell proliferation, B cell chemotaxis, and positive regulation of response to DNA damage stimulus, among others. In recent years, DNA damage repair and immune infiltration have been associated with cancer's development and drug resistance, making them therapeutic targets for LUAD[30-33]. The results indicate that THG1L might have a significant part in the evolution of LUAD. High levels of THG1L expression may influence treatment resistance mechanisms and tumor immunology during the progression of LUAD. According to our findings, an elevated level of THG1L expression is associated with a poor prognosis. Therefore, we hypothesized that the increased expression of THG1L may play a crucial regulatory role among these pathways, thereby contributing to the prognosis of LUAD.
According to the GSEA, THG1L expression may be associated with immune cell infiltration. Correspondingly, the relationship between immune cell infiltration and THG1L expression was investigated in LUAD. ssGSEA and TIMER analysis revealed strong positive correlations between THG1L expression and the infiltration levels of CD8+ T cells, B cells, neutrophils, macrophages and DC cells. Furthermore, ssGSEA revealed a negative correlation between THG1L levels and TGD cells, suggesting that THG1L may influence LUAD immune infiltration by influencing TGD infiltration. TGD cells are necessary immune cells that exert diverse antitumor effects[34-37].
Wrobel et al.[38] discovered that Tgd cells can lyse numerous epithelial tumor cells, including Non-Small Cell Lung Cancer (NSCLC) cells. Meanwhile, prior clinical studies have shown that Tgd-cell immunotherapy for patients with recurrent NSCLC may be safe and feasible[39]. We hypothesize that an increase in THG1L inhibits the infiltration of Tgd cells into LUAD. We hypothesize that THG1L is necessary for LUAD immune regulation. This hypothesis, however, requires additional experimental testing, particularly to investigate the specific interactions between THG1L and Tgd cells.
While these findings are significant, we recognize the limitations of our analysis, most notably the absence of in vitro and in vivo experiments. Therefore, additional research is required to establish THG1L as a promising potential biomarker for the diagnosis, prognosis and treatment of LUAD.
In conclusion, THG1L as a novel biomarker may have functional mechanisms that promote the development of LUAD and the influence of the immune microenvironment. Thus, by intervening THG1L, the prognosis of LUAD patients may be promoted.
Acknowledgements:
This study is supported by Wu Mianhua Inheritance Studio of National Famous and Old Chinese Medicine Experts (State Administration of Traditional Chinese Medicine No. [2022] 75); Inheritance Studio of the Second National Famous Chinese Medicine Experts (State Administration of Traditional Chinese Medicine Office No. [2022] 245); Academic Experience Inheritance Project for the 7th Batch of Old Chinese Medicine Experts by State Administration of Traditional Chinese Medicine (State Administration of Traditional Chinese Medicine No. [2022] 76); Wu Mianhua Inheritance Studio of Famous and Old Chinese Medicine Experts in Jiangsu Province (Science and Education of Traditional Chinese Medicine in Jiangsu Province No. [2021]7); “Million Talent Project” for Inheritance and Innovation of Traditional Chinese Medicine (Huangqi Project) by Drug Administration, Huangqi Scholar (State Administration of Traditional Chinese Medicine No. [2018] 284) and Postgraduate Research and Practice Innovation Program of Jiangsu Province (No. KYCX22_1930).
Author’s contribution:
Lingyan Zhu and Yuanyuan Qin conceived and designed the study, and have contributed equally to this work. Lingyan Zhu, Yuanyuan Qin, Li Li and Wenting Li carried out experiments and bioinformatics analysis. Lingyan Zhu wrote the manuscript. Mianhua Wu supervised the whole project. All authors contributed to the article and approved the submitted version.
Conflict of interests:
The authors declared no conflict of interests.
References
- Sung H, Ferlay J, Siegel RL, Laversanne M, Soerjomataram I, Jemal A, et al. Global cancer statistics 2020: GLOBOCAN estimates of incidence and mortality worldwide for 36 cancers in 185 countries. CA Cancer J Clin 2021;71(3):209-49.
[Crossref] [Google Scholar] [PubMed]
- Travis WD. Pathology of lung cancer. Clin Chest Med 2011;32(4):669-92.
[Crossref] [Google Scholar] [PubMed]
- Lin X, Ye R, Li Z, Zhang B, Huang Y, Du J, et al. KIAA1429 promotes tumorigenesis and gefitinib resistance in lung adenocarcinoma by activating the JNK/MAPK pathway in an m6A-dependent manner. Drug Resist Updat 2023;66:100908.
[Crossref] [Google Scholar] [PubMed]
- Kourou K, Exarchos TP, Exarchos KP, Karamouzis MV, Fotiadis DI. Machine learning applications in cancer prognosis and prediction. Comput Struct Biotechnol J 2015;13:8-17.
[Crossref] [Google Scholar] [PubMed]
- Lockwood WW, Wilson IM, Coe BP, Chari R, Pikor LA, Thu KL, et al. Divergent genomic and epigenomic landscapes of lung cancer subtypes underscore the selection of different oncogenic pathways during tumor development. PloS one 2012;7(5):e37775.
[Crossref] [Google Scholar] [PubMed]
- Yin J, Ren W, Liu G, Duan J, Yang G, Wu L, et al. Birth oxidative stress and the development of an antioxidant system in newborn piglets. Free Radic Res 2013;47(12):1027-35.
[Crossref] [Google Scholar] [PubMed]
- Finkel T. Signal transduction by reactive oxygen species. J Cell Biol 2011;194(1):7-15.
[Crossref] [Google Scholar] [PubMed]
- Li Y, Zhao X, Jiang X, Chen L, Hong L, Zhuo Y, et al. Effects of dietary supplementation with exogenous catalase on growth performance, oxidative stress, and hepatic apoptosis in weaned piglets challenged with lipopolysaccharide. J Anim Sci 2020;98(3):skaa067.
[Crossref] [Google Scholar] [PubMed]
- Hyde SJ, Eckenroth BE, Smith BA, Eberley WA, Heintz NH, Jackman JE, et al. tRNAHis guanylyltransferase (THG1), a unique 3′-5′ nucleotidyl transferase, shares unexpected structural homology with canonical 5′-3′ DNA polymerases. Proc Natl Acad Sci USA 2010;107(47):20305-10.
[Crossref] [Google Scholar] [PubMed]
- Zorzano A, Liesa M, Sebastián D, Segalés J, Palacín M. Mitochondrial fusion proteins: Dual regulators of morphology and metabolism. Semin Cell Dev Biol 2010;21(6):566-74.
[Crossref] [Google Scholar] [PubMed]
- Hickey FB, Corcoran JB, Griffin B, Bhreathnach U, Mortiboys H, Reid HM, et al. IHG-1 increases mitochondrial fusion and bioenergetic function. Diabetes 2014;63(12):4314-25.
[Crossref] [Google Scholar] [PubMed]
- Bhreathnach U, Griffin B, Brennan E, Ewart L, Higgins D, Murphy M. Profibrotic IHG-1 complexes with renal disease associated HSPA5 and TRAP1 in mitochondria. Biochim Biophys Acta Mol Basis Dis 2017;1863(4):896-906.
[Crossref] [Google Scholar] [PubMed]
- Edvardson S, Elbaz-Alon Y, Jalas C, Matlock A, Patel K, Labbé K, et al. A mutation in the THG1L gene in a family with cerebellar ataxia and developmental delay. Neurogenetics 2016;17:219-25.
[Crossref] [Google Scholar] [PubMed]
- Shaheen R, Maddirevula S, Ewida N, Alsahli S, Abdel-Salam GM, Zaki MS, et al. Genomic and phenotypic delineation of congenital microcephaly. Genet Med 2019;21(3):545-52.
[Crossref] [Google Scholar] [PubMed]
- Goldman MJ, Craft B, Hastie M, Repečka K, McDade F, Kamath A, et al. Visualizing and interpreting cancer genomics data via the Xena platform. Nat Biotechnol 2020;38(6):675-8.
[Crossref] [Google Scholar] [PubMed]
- Li T, Fan J, Wang B, Traugh N, Chen Q, Liu JS, et al. TIMER: A web server for comprehensive analysis of tumor-infiltrating immune cells. Cancer Res 2017;77(21):e108-10.
[Crossref] [Google Scholar] [PubMed]
- Li B, Severson E, Pignon JC, Zhao H, Li T, Novak J, et al. Comprehensive analyses of tumor immunity: Implications for cancer immunotherapy. Genome Biol 2016;17(1):1-6.
[Crossref] [Google Scholar] [PubMed]
- van Allen EM, Miao D, Schilling B, Shukla SA, Blank C, Zimmer L, et al. Genomic correlates of response to CTLA-4 blockade in metastatic melanoma. Science 2015;350(6257):207-11.
[Crossref] [Google Scholar] [PubMed]
- Hugo W, Zaretsky JM, Sun LU, Song C, Moreno BH, Hu-Lieskovan S, et al. Genomic and transcriptomic features of response to anti-PD-1 therapy in metastatic melanoma. Cell 2016;165(1):35-44.
[Crossref] [Google Scholar] [PubMed]
- Fu J, Li K, Zhang W, Wan C, Zhang J, Jiang P, et al. Large-scale public data reuse to model immunotherapy response and resistance. Genome Med 2020;12:1-8.
- Shen BJ, Lo WC, Lin HH. Global burden of tuberculosis attributable to cancer in 2019: Global, regional and national estimates. J Microbiol Immunol Infect 2022;55(2):266-72.
[Crossref] [Google Scholar] [PubMed]
- Mougiakakos D, Johansson CC, Kiessling R. Naturally occurring regulatory T cells show reduced sensitivity toward oxidative stress–induced cell death. Blood 2009;113(15):3542-5.
[Crossref] [Google Scholar] [PubMed]
- Gorrini C, Harris IS, Mak TW. Modulation of oxidative stress as an anticancer strategy. Nat Rev Drug Discov 2013;12(12):931-47.
[Crossref] [Google Scholar] [PubMed]
- Piskounova E, Agathocleous M, Murphy MM, Hu Z, Huddlestun SE, Zhao Z, et al. Oxidative stress inhibits distant metastasis by human melanoma cells. Nature 2015;527(7577):186-91.
[Crossref] [Google Scholar] [PubMed]
- Global cancer statistics 2020: GLOBOCAN estimates of incidence and mortality worldwide for 36 cancers in 185 countries
- Sosa V, Moliné T, Somoza R, Paciucci R, Kondoh H, Leonart ME. Oxidative stress and cancer: An overview. Ageing Res Rev 2013;12(1):376-90.
[Crossref] [Google Scholar] [PubMed]
- Liu X, Chen Z. The pathophysiological role of mitochondrial oxidative stress in lung diseases. J Transl Med 2017;15(1):1-3.
[Crossref] [Google Scholar] [PubMed]
- Goldkorn T, Filosto S, Chung S. Lung injury and lung cancer caused by cigarette smoke-induced oxidative stress: Molecular mechanisms and therapeutic opportunities involving the ceramide-generating machinery and epidermal growth factor receptor. Antioxid Redox Signal 2014;21(15):2149-74.
[Crossref] [Google Scholar] [PubMed]
- Hickey FB, Corcoran JB, Docherty NG, Griffin B, Bhreathnach U, Furlong F, et al. IHG-1 promotes mitochondrial biogenesis by stabilizing PGC-1α. J Am Soc Nephrol 2011;22(8):1475.
[Crossref] [Google Scholar] [PubMed]
- Zhu C, Xie Y, Li Q, Zhang Z, Chen J, Zhang K, et al. CPSF6-mediated XBP1 3’UTR shortening attenuates cisplatin-induced ER stress and elevates chemo-resistance in lung adenocarcinoma. Drug Resist Updat 2023;68:100933.
[Crossref] [Google Scholar] [PubMed]
- Zhang S, Cao M, Yan S, Liu Y, Fan W, Cui Y, et al. TRIM44 promotes BRCA1 functions in HR repair to induce cisplatin chemoresistance in lung adenocarcinoma by deubiquitinating FLNA. Int J Biol Sci 2022;18(7):2962.
[Crossref] [Google Scholar] [PubMed]
- Shi Y, Xu Y, Xu Z, Wang H, Zhang J, Wu Y, et al. TKI resistant-based prognostic immune related gene signature in LUAD, in which FSCN1 contributes to tumor progression. Cancer Lett 2022;532:215583.
[Crossref] [Google Scholar] [PubMed]
- Geng Q, Li L, Shen Z, Zheng Y, Wang L, Xue R, et al. Norepinephrine inhibits CD8+ T-cell infiltration and function, inducing anti-PD-1 mAb resistance in lung adenocarcinoma. Br J Cancer 2023;128(7):1223-35.
[Crossref] [Google Scholar] [PubMed]
- Yoshida Y, Nakajima J, Wada H, Kakimi K. γδ T-cell immunotherapy for lung cancer. Surg Today 2011;41:606-11.
[Crossref] [Google Scholar] [PubMed]
- Saura-Esteller J, de Jong M, King LA, Ensing E, Winograd B, de Gruijl TD, et al. Gamma delta T-cell based cancer immunotherapy: Past-present-future. Front Immunol 2022;13:915837.
[Crossref] [Google Scholar] [PubMed]
- Silva-Santos B, Serre K, Norell H. γδ T cells in cancer. Nat Rev Immunol 2015;15(11):683-91.
[Crossref] [Google Scholar] [PubMed]
- Galati D, Zanotta S, Bocchino M, de Filippi R, Pinto A. The subtle interplay between gamma delta T lymphocytes and dendritic cells: Is there a role for a therapeutic cancer vaccine in the era of combinatorial strategies? Cancer Immunol Immunother 2021;70:1797-809.
[Crossref] [Google Scholar] [PubMed]
- Wrobel P, Shojaei H, Schittek B, Gieseler F, Wollenberg B, Kalthoff H, et al. Lysis of a broad range of epithelial tumour cells by human γδ T cells: Involvement of NKG2D ligands and T‐cell receptor‐versus NKG2D‐dependent recognition. Scand J Immunol 2007;66(2‐3):320-8.
[Crossref] [Google Scholar] [PubMed]
- Nakajima J, Murakawa T, Fukami T, Goto S, Kaneko T, Yoshida Y, et al. A phase I study of adoptive immunotherapy for recurrent non-small-cell lung cancer patients with autologous γδ T cells. Eur J Cardiothorac Surg 2010;37(5):1191-7.
[Crossref] [Google Scholar] [PubMed]
