- *Corresponding Author:
- V. A. Chatpalliwar
Department of Pharmaceutical Chemistry, R. C. Patel College of Pharmacy Karvand Naka, Shirpur, Dist: Dhule-425 405, India
E-mail: vchatpalliwar@yahoo.co.in
| Date of Submission | 14 June 2007 |
| Date of Revision | 30 January 2008 |
| Date of Acceptance | 18 August 2008 |
| Indian J Pharm Sci 2008, 70 (4): 529-531 |
Abstract
Quinapril hydrochloride and hydrochlorothiazide were simultaneously determined by HPTLC in pharmaceutical formulations. The drugs were separated on silica gel 60 F 254 plates using suitable combination of solvents as mobile phase. The validation parameters, tested in accordance with the requirements of ICH guidelines, prove the suitability of methods.
Keywords
HPTLC, quinapril hydrochloride, hydrochlorothiazide
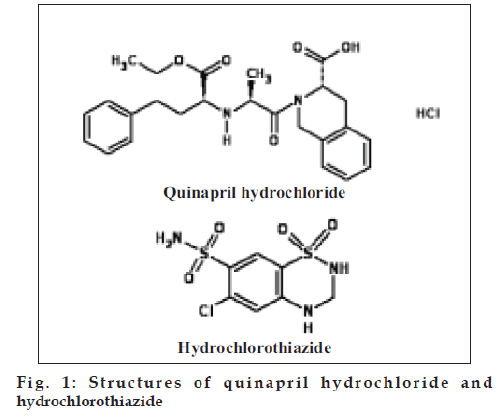
Quinapril hydrochloride (fig. 1), chemically, (3S)- 2-[(2S)-2-[[(1S)-1-(ethoxycarbonyl)-3-phenylpropyl] amino]-1-oxopropyl]-1,2,3,4-tetrahydro-3- isoquinolinecarboxylic acid hydrochloride [1], is an angiotensin converting enzyme (ACE) inhibitor, used to treat hypertension and cardiac failure [2,3]. Different HPLC methods have been reported for the analysis of quinapril and its active metabolites [4,5]. Quinapril has been separated from its metabolite, quinaprilat, from biological ß uid using gradient elution-reversed phase chromatographic system [6].
Hydrochlorothiazide (fig. 1), chemically, 6-chloro- 3,4-dihydro-2H-1,2,4-benzothiadiazine-7-sulfonamide- 1,1-dioxide [7-11], is a thiazide diuretic used in the treatment of oedema associated with heart failure and with renal and hepatic disorders. Different analytical methods using HPTLC [12], HPLC [13-18 ] and spectrophotometry [19-20] have been reported for hydrochlorothiazide. However, there is no method reported for simultaneous estimation of quinapril hydrochloride and hydrochlorothiazide using HPTLC or HPLC. The proposed methods presented here are simple, fast, accurate and precise HPTLC methods for simultaneous determination of quinapril hydrochloride and hydrochlorothiazide in tablets.
Quinapril hydrochloride (batch no. NCL/QN/18) and hydrochlorothiazide (batch no.5005HCRJ) were supplied as a gift sample from Macleods Pharmaceuticals, India. All chemicals used were of HPLC grade, purchased from Qualigens fine Chemicals, Mumbai, and were used as such. The tablets were procured from local market.
Samples were applied (Hamilton microsyringe using Linomat V applicator, Switzerland) as 6 mm bands spaced 13 mm on 20 cm×10 cm aluminum backed silica gel 60 F254 TLC plates (Merck, Darmstadt, Germany). Development was achieved for 70 mm in Camag twin-trough chamber (20 cm×10 cm) previously saturated for 15 min at 25±2° with the vapors of solvent system ethyl acetate: acetone: acetic acid (6.5: 3: 0.5 v/v/v). Subsequently, plates were dried and scanned at 208 nm using Camag TLC scanner 3 equipped with Wincats software (version 1.3.0) and deuterium light source.
Standard stock solution containing 100 µg/ ml of quinapril hydrochloride and 125 µg/ml of hydrochlorothiazide were prepared in methanol. Linearity was performed by applying six times the stock solution to give concentrations of 400- 2800 ng/spot and 500-350 ng/spot of quinapril hydrochloride and hydrochlorothiazide, respectively. Calibration curve was established by plotting peak area on ordinate and corresponding concentration on abscissa.
Twenty film-coated tablets (Accuretic, Pfizer) were accurately weighed, and their average weight was determined. Powder equivalent to 10 mg of quinapril hydrochloride and 12.5 mg of hydrochlorothiazide was dissolved in methanol, sonicated for 20 min; solution was filtered and diluted to 100 ml with methanol. The solution was applied on the plate to give 1200 ng/ spot of quinapril hydrochloride and 1500 ng/spot of hydrochlorothiazide, respectively. Six such plates were developed as described above. The results of assay are summarized in Table 1. The method was validated as per the various parameters given in ICH guidelines [21].
| Tablet | Component | Label Claim (mg) | Amount Found mg ± SD (n=6) |
% Label Claim | % RSD |
|---|---|---|---|---|---|
| Batch 1 | Quinapril hydrochloride | 10 | 9.97 ± 0.08 | 99.75 | s0.78 |
| Hydrochlorothiazide | 12.5 | 12.45 ± 0.14 | 99.67 | 1.12 | |
| Batch 2 | Quinapril hydrochloride | 10 | 9.96 ± 0.068 | 99.59 | 0.68 |
| Hydrochlorothiazide | 12.5 | 12.39 ± 0.11 | 99.16 | 0.87 |
Table 1: Results Of Assay of Tablets
The linearity was studied in the concentration range of 400–2800 ng/spot for quinapril hydrochloride and 500–3500 ng/spot for hydrochlorothiazide. Precision of the method is expressed in terms of % RSD.
The peak purity of quinapril hydrochloride and hydrochlorothiazide was determined by correlating the spectra’s of drug at the peak start (S), peak apex (M) and at peak end (E) positions. Recovery studies were performed by standard addition method at 80%, 100% and 120% level, to the pre-analyzed samples and contents were reanalyzed, using the proposed method. Ruggedness of the proposed method was determined by performing assay by two different analysts, using similar operational and environmental conditions.
Linearity was observed in the concentration range of 400 - 2800 ng/spot and 500 - 3500 ng/spot; correlation coefficients (r) being 0.9992 and 0.9993 with the slopes 2.094 and 1.8753 for quinapril hydrochloride and hydrochlorothiazide, respectively. The intraday and inter-day precision ranged between 0.212- 0.380% and 0.217-0.416% for quinapril hydrochloride and between 0.325-0.642% and 0.434- 1.162% for hydrochlorothiazide, respectively. LOD and LOQ were found to be 123.02 ng/spot and 372.77 ng/spot for quinapril hydrochloride and 143.82 ng/spot and 435.81 ng/spot for hydrochlorothiazide, respectively.
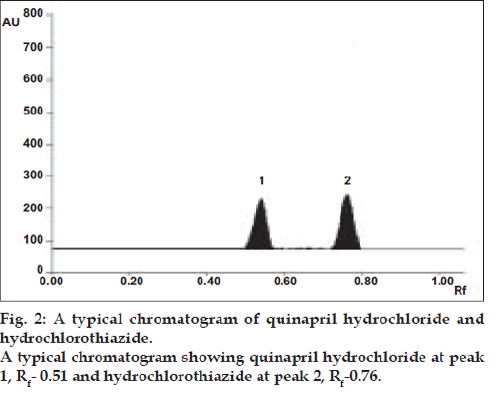
Specificity of the method was well demonstrated by efficient separation of both drugs by the solvent system (fig. 2). The Rf values for quinapril hydrochloride and hydrochlorothiazide were found to be 0.51 and 0.76, respectively. The peak purity is expressed as correlation r (S, M) = 0.9986, r (M, E) = 0.9967 for quinapril hydrochloride, and correlation r (S, M) = 0.9996, r (M, E) = 0.9995 for hydrochlorothiazide. The recoveries for quinapril hydrochloride and hydrochlorothiazide were ranged between 99.37- 100.79% and 99.33-100.53%, respectively.
The proposed HPTLC methods provide simple, accurate and reproducible quantitative analysis for simultaneous determination of quinapril hydrochloride and hydrochlorothiazide in tablets. The reported HPLC method [6] employed two mobile phases over a reversed phase column coupled with pre-column-solid-phase extraction, to separate the drug from its metabolite, indicating high cost required for such analysis. The linearity and accuracy of the method [6] are not conforming to the requirements of ICH guidelines.
Moreover, the method reported in present article can be employed for separation of quinapril hydrochloride from hydrochlorithiazide; the drug available in several combination-formulations with quinapril.
Acknowledgements
The authors are thankful to Macleods Pharmaceuticals Ltd. (Mumbai), for providing drug samples, and R. C. Patel College of Pharmacy, Shirpur, for providing facilities to perform the research work.
References
- Moffat AC, Osselton MD, Widdop B. Clarkes Analysis of Drugs andPoisons, 3rd ed. London: Pharmaceutical Press; 2004. p. 1516-7.
- Sweetman SC. Martindale- The Complete Drug Reference. 33rd ed.London: Pharmaceutical Press; 2002. p. 963-4.
- Kerins DM, Robertson RM, Robertson D. Drugs used for the treatmentof myocardial ischemia. In; Hardman JG, Limbird LE, Gilman AG.Goodman and Gilman’s: The Pharmacological Basis of Therapeutics,10th ed. New York: McGraw Hill, Medical Publishing Division; 2001.p. 841.
- Kuglar AR, Olson SC, Smith DE. Determination of quinapriland quinaprilat by high-performance liquid chromatography withradiochemical detection, coupled to liquid scintillation counting spectrometry. J Chromatogr B 1995;666:360-7.
- Bonazzi D, Gotti R, Andrisano V, Cavrini V. Analysis of AC Einhibitors in pharmaceutical dosage forms by derivative UVspectroscopy and liquid chromatography (HPLC). J Pharma Biomed Anal 1997;16:431-8.
- Abbara CH, Aymard G, Hinh S, Diquet B. Simultaneous determinationof quinapril and its active metabolite quinaprilat in human plasmausing high performance liquid chromatography with UV detection. J Chromatogr B 2002;766:199-207.
- Moffat AC, Osselton MD, Widdop B. Clarkes Analysis of Drugs andPoisons, 3rd ed. London: Pharmaceutical Press; 2004. p. 1109-10.
- Sweetman SC. Martindale- The Complete Drug Reference, 33rd ed.London: Pharmaceutical Press; 2002. p. 907-10.
- Pharmacopoeia of India, Government of India, Delhi: The Controller ofPublications; 1985. p. 244-5.
- British Pharmacopoeia. London: The Stationary OfÞce; 2004. p. 979-80.
- The United States Pharmacopoeia 27, The National Formulary 22,United States: Pharmacopoeial Convention, Inc; 2004. p. 917-8.
- Shinde VM, Desai BS, Tendolkar NM.Simultaneous determination of propranolol hydrochloride and hydrochlorothiazide in tablets byquantitative TLC. Indian Drugs 1994:31:192-6.
- Bachman WJ, Stewart JT. HPLC-photolysis-electrochemical detectionin pharmaceutical analysis: Application to the determination of spironolactone and hydrochlorothuazide in tablets. J Chromatogr Sci 1990;28:123-8.
- De Croo F, Bossche WV, De Moerloose P. Simultaneous quantitative determination of amiloride hydrochloride and hydrochlorothiazide intablets by high-performance liquid chromatography. Chromatographia 1985;20:477-81.
- Atay O, Tamer U, Arikan D. Determination of cilazapril and hydrochlorothiazide in pharmaceuticals by high performance liquid chromatography. Analytical Letters 2001;34:1153-61.
- Suhagia BN, Shah RR, Patel DM. Development of RP-HPLC methodfor evaluating losartan potassium and hydrochlorothiazide tablets. Indian J Pharma Sci 2005;67:37-42.
- Zarapkar SS, Rane SH. Reverse phase high-performance liquid chromatographic determination of ramipril and hydrochlorothiazide intablets. Indian Drugs 2000;37:589-93.
- Jonczyk A, Nowakowska Z. Determination of hydrochlorothiazide, triamterene and propranolol hydrochloride by the spectrophotometric method and high-performance liquid chromatography. Acta Pol Pharm 2001;58:339-44.
- Erk N. Spectrophotometric analysis of valsartan and hydrochlorothiazide. Anal, Lett 2002;35:283-302.
- Chandwani OD, Dahibhate PP, Kadam SS, Dhaneshwar SR. Simultaneous spectrophotometric estimation of enalapril maleate and hydrochlorothiazide. Indian Drugs 1996;33:401-2.
- ICH Harmonised Tripartite Guideline, Validation of Analytical Procedures: Methodology, Q 2 B: 1-8.


