- *Corresponding Author:
- Bharani Pandilla
Department of Pharmaceutical Analysis, C. L. Baid Metha College of Pharmacy, Chennai 600097, Tamil Nadu, India
E-mail: Chemical structure of Ifetroban sodium
| Date of Received | 24 October 2021 |
| Date of Revision | 14 May 2023 |
| Date of Acceptance | 19 September 2023 |
| Indian J Pharm Sci 2023;85(5):1344-1352 |
This is an open access article distributed under the terms of the Creative Commons Attribution-NonCommercial-ShareAlike 3.0 License, which allows others to remix, tweak, and build upon the work non-commercially, as long as the author is credited and the new creations are licensed under the identical terms
Abstract
A new simple rapid, isocratic, and stability-indicating reverse phase high performance liquid chromatography technique was developed for the quantification of Ifetroban. Optimization was achieved with Zorbax SB C18 (250×4.6 mm, 5 μ) and mobile phase comprising of 0.1 mM phosphate buffer (pH 3.0±0.05):acetonitrile (65:35 % v/v). The mobile phase was pumped at a flow rate of 1.0 ml/min and analysis was performed with a photodiode array detector. The method was validated as per International Council for Harmonisation guidelines with respect to precision, linearity, accuracy, ruggedness and specificity. The drug is exposed to various degradation conditions like acidic and basic hydrolysis, oxidation, and exposure to ultra-violet light and temperature (dry heat) and the degraded samples were analyzed by the developed method. No co-eluting degradants or interfering peaks were observed during stress conditions and all the degradants were resolved from the main peak.
Keywords
Ifetroban, high-performance liquid chromatography-photodiode array, method development, validation, degradation studies
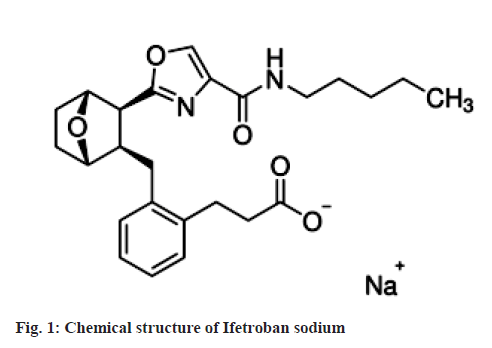
Ifetroban sodium is 2-[[(1S, 2R, 3S, 4R)-3- [4-[(Pentylamino) carbonyl]-2-oxazolyl]-7- oxabicyclo [2.2.1] hept-2-yl]methyl]-benzene propanoic acid sodium salt (fig. 1). Ifetroban is a potent and selective thromboxane A2/prostaglandin H2 receptor antagonist. Thromboxane A2 is involved in vascular contraction and platelet activation. Studies from animal experiments and clinical studies indicate that hypertension is associated with hyper aggregability of platelets and increased thromboxane A2 levels in blood, urine and tissues.
The precursors to thromboxane A2, prostaglandin G2, and prostaglandin H2, also bind and activate the receptors. A receptor antagonist for reversing the actions of thromboxane A2/prostaglandin H2, is an improved strategy rather than a thromboxane synthesis inhibitor[1]. A detailed literature survey for Ifetroban revealed that there is no reported High-Performance Liquid Chromatography (HPLC) technique for the estimation of Ifetroban sodium. Khan et al.[2] developed an HPLC-mass spectrometry kinetic analysis technique for studying the stability of aqueous solutions of the major metabolite, Ifetroban 1-O-acyl glucuronide[2]. Direct injection capillary gas chromatographicmass spectroscopic analysis was developed by Jemal et al.[3] for the assay of Ifetroban and Xia et al.[4] demonstrated that FAIMS can be used to establish the location of the in-source collisioninduced dissociation in electro spray ionization mass spectrometry[4]. Therefore, it was desirable to develop a rapid, specific, precise and rugged method that can be applied for the estimation of Ifetroban in Active Pharmaceutical Ingredient (API) and formulations.
Materials and Methods
All experiments were performed using ‘A class’ volumetric glassware, Ifetroban sodium was received as a gift sample. HPLC grade acetonitrile was procured from Rankem Fine Chemical Limited and water of Milli-Q RO system (Millipore, Bedford, USA). Potassium dihydrogen phosphate, sodium hydroxide, hydrogen peroxide, hydrochloric acid and ortho-phosphoric acid were of analytical grade. The HPLC system was Waters® e2695 Separation Module connected with a Photodiode Array (PDA) detector. The data acquisition was performed by Empower software. Analytical balance (Semimicro): Shimadzu AUW220D), Ultra-sonicator (LMUC-12): Spectrum Tek, Digital pH meter (PH12-5p-920): Spectrum Tek, Hot air oven: Inlab Equipment Pvt. Ltd. For method development and validation, separation and quantification were made on Zorbax SB-C18 (250×4.6 mm, 5 μm) column. In the current method, the mobile phase composed of 0.1 mM phosphate buffer pH fixed at 3.0±0.05and acetonitrile in the proportion of 65:35 v/v and solvent delivery rate was 1ml/min. and wavelength fixed at 215 nm with a sample volume of 20 μl.
Preparation of mobile phase and stock solutions:
Potassium dihydrogen phosphate (0.1 mM) was dissolved in 900 ml milli Q water, pH was fixed at 3.0±0.05 using ortho phosphoric acid and volume made up to 1000 ml. The buffer was filtered through a 0.45 μm nylon membrane filter. 650 ml of Phosphate buffer and 350 ml of acetonitrile were mixed, filtered and used as mobile phase. Ifetroban, 25 mg was accurately weighed, dissolved and diluted with mobile phase to 25 ml (1000 ppm). This solution was diluted with a suitable volume of mobile phase to get the standard solution (200 ppm).
Analysis of formulation:
A sample equivalent to about 25 mg was exactly weighed and dissolved in 15 ml of methanol and sonicated for a few minutes to ensure complete extraction, the volume was made up to 25 ml with mobile phase to get 1000 ppm. The sample stock solution was diluted with a suitable volume of mobile phase to get 200 ppm. The solution was filtered through a 0.45 μm nylon filter before injection into the column.
Method validation:
The developed method was validated according to the International Conference on Harmonization (ICH) guidelines[5]. System precision was evaluated by injecting six consecutive standards, and the percentage Relative Standard Deviation (% RSD) was calculated. System suitability was verified by determining various parameters like tailing factor, column efficiency (N), selectivity and resolution. To check interference due to diluent, placebo and degradants, a single injection of diluent and duplicate sets of placebo preparation and sample solution were injected. The spectral homogeneity of the Ifetroban peak was checked by scanning in the range of 210 nm-400 nm into each set retention time and resolution were checked. In accordance with ICH guidelines, precision was assessed at three different levels and repeatability (intra-day precision) was performed in two steps to check system and method repeatability. System precision was evaluated by performing six consecutive injections of standard (200 μg/ml), followed by injecting six independent samples (each of 200 μg/ ml). Intermediate precision (inter-day variation) was evaluated by a second analyst using different columns in the same lab on different days.Accuracy was performed at 80 %, 100 %, and 120 % levels by the standard addition method. Each concentration was analyzed 3 times and average recoveries were measured. For robustness evaluation of the HPLC method, a few parameters like flow rate, percentage of acetonitrile in the mobile phase and pH of the mobile phase were purposely changed. The system suitability criteria should meet the pre-established acceptance values at all the modified conditions, i.e., change in flow rate, mobile phase proportion and pH of the buffer.
Preparation of calibration curve solutions and linearity:
The standard stock solution of Ifetroban (1000 μg/ ml) was diluted with the mobile phase to obtain the final concentration of 50-600 μg/ml.
Interference of degradation products:
Forced degradation studies of Ifetroban, was performed under different stress conditions as mentioned in ICH guideline Q1A (R2)[6]. Stress degradation studies were performed by exposing the standard drug solution to various degradation conditions such as acidic medium, basic medium, neutral medium, oxidation and photo degradation studies[7,8]. Within the study of selectivity, a series of degradation studies were carried out, where the formulation samples, API and placebo were subjected to different degrees of stress. Acid degradation was carried out by adding 1 ml of 0.1 N HCl and 1 N HCl in two different flasks, to 2 ml of standard stock solution. The solution was kept at 80° for 2 h, neutralized with sodium hydroxide,and diluted with mobile phaseto get 200 ppm. Alkali degradation was done by keeping the 2 ml of standard stock solution with 1 ml of 0.1 N and 1 N sodium hydroxide. The solution was kept at 80° for 2 h and neutralized with hydrochloric acid, further diluted with mobile phaseto get 200 ppm. Degradation with peroxide was carried out by adding 10 % and 30 % v/v hydrogen peroxideto 2 ml of standard stock solution and kept at 80° for 2 h. It was cooled to room temperature and the sample was further diluted to get 200 ppm with mobile phase and analyzed by the optimized chromatographic conditions. For thermal degradation, API was kept at 80° for 2 h and the sample solution was diluted to 200 ppm with the mobile phase. For photo degradation (Ultra- Violet (UV)), Ifetroban was kept in a UV chamber at a wavelength of 254 for 2 h and the sample solution was prepared with mobile phase to get a concentration of 200 ppm and analyzed.
Results and Discussion
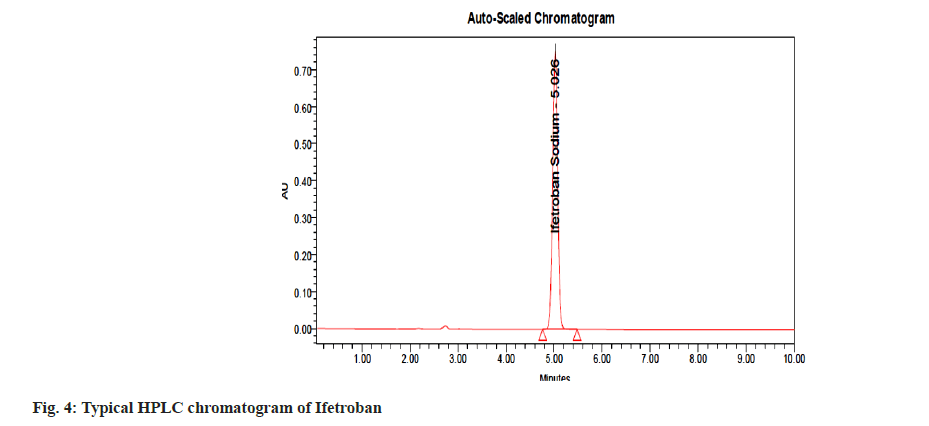
A stability-indicating analytical method should establish the capability of quantification of the API and the determination of potential degradation products without any interference. A satisfactory separation with good peak symmetry and steady baseline was achieved with Zorbax SB C18 (250×4.6 mm, 5 μm) and mobile phase comprising of 0.1 mM phosphate buffer (pH 3.0±0.05):acetonitrile (65:35 % v/v) at a flow rate of 1.0 ml/min. The quantification of Ifetroban was achieved at 215 nm. To obtain the best chromatographic conditions, the mobile phase was optimized to provide satisfactory selectivity and sensitivity in a short run time. Phosphate buffer resulted in high sensitivity and the use of acetonitrile resulted in better sensitivity and short analysis time (retention time was 5.06±0.010), improving the peak symmetry (about 1.1). Moreover, an acceptable resolution of Ifetroban and the degradation products were obtained, confirming the stability-indicating capability of the proposed method. For the selection of the best wavelength of detection, a PDA detector was used.
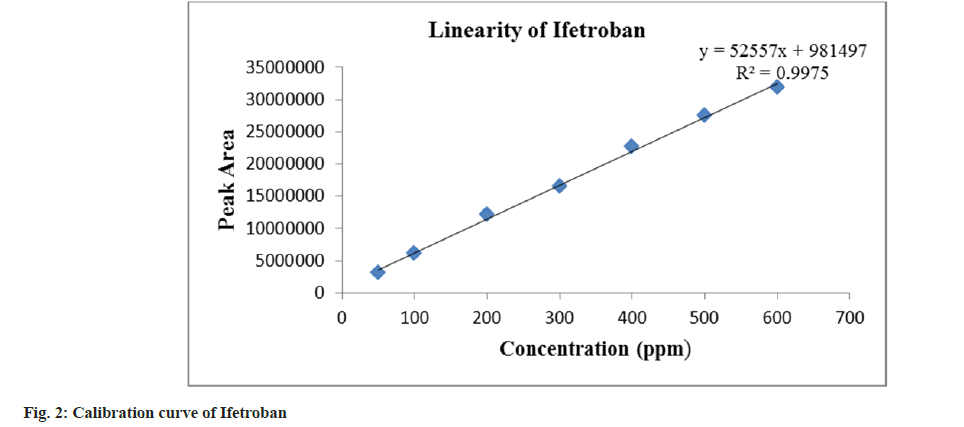
The parameters like retention time, theoretical plate, tailing factor, and repeatability (% RSD of retention times and peak areas) are shown in Table 1. The acceptance criteria for theoretical plates were fixed at NLT 2000. The tailing factor was 1.1, which indicates that the peak shape is good and demonstrates the system suitability for the analysis of Ifetroban. The calibration curve was plotted over a concentration range of 50-600 μg/ ml for Ifetroban. The calibration curve (fig. 2) was plotted taking concentration on X-axis and peak areas on Y-axis; and the regression equation, y=52557x+981497 with correlation coefficient (R2) value 0.998 shows good linearity in the selected concentration range, as represented in Table 1.
| Parameters | Ifetroban |
|---|---|
| Retention Time | 5.06 |
| Theoretical Plates | 2058.49±1.55 |
| Tailing Factor (asymmetry factor) | 1.12±0.013 |
| LOD (μg/ml) | 0.12 |
| LOQ (μg/ml) | 0.34 |
| Linearity range (µg/ml) | 50-600 µg/ml |
| Slope | 52557 |
| Intercept (a) | 981497 |
| Correlation coefficient (R2) | 0.9975 |
Note: SD: Standard Deviation, n=6
Table 1: System Suitability Parameters and Regression Characteristics
Accuracy was performed at 80 %, 100 % and 120 % levels by the standard addition method. Each concentration was analyzed 3 times and average recoveries were measured as shown in Table 2. The average percent recovery of 80, 100 and 120 % was about 100.73, 100.36 and 101.23. The overall relative standard deviation (% RSD) is less than 0.5, which is below the acceptance limit of 2% indicating the method is accurate. According to ICH guidelines, precision was done at three different levels. System precision was evaluated by performing six consecutive injections of standard the % RSD, which was 0.88. Method precision was done by injecting six independent samples (each of 200 μg/ml) and the % RSD was 0.96 showing the method is precise. Intermediate precision (interday variation) was established by a second analyst using different columns in the same lab on a different day and the % RSD was 0.94 which shows the method is rugged, as represented in Table 3. The % RSD of the retention time, tailing factor and peak areas were within the acceptable range when flow rate, the proportion of the buffer, pH were changed, against nominal conditions. The results and the range of the modified chromatographic variables appraised in the robustness are given in Table 4.
| Name of drug | Accuracy level | Amount of drug (µg/ml) | Quantity added (µg/ml) | Recovered (μg/ml)±SD (n=3) | % Accuracy±SD (n=3) |
|---|---|---|---|---|---|
| Ifetroban | 80 % | 100 | 60 | 161.16±0.18 | 100.73±0.11 |
| 100 % | 100 | 100 | 200.72±0.66 | 100.36±0.33 | |
| 120 % | 100 | 140 | 242.96±0.55 | 101.23±0.23 |
Note: Three samples at three different concentrations were analyzed; SD: Standard Deviation, n=3
Table 2: Accuracy Data for Ifetroban by Rp-Hplc
| S No. | System precision | Method precision | Intermediate precision |
|---|---|---|---|
| 1 | 12541270 | 12328713 | 14211935 |
| 2 | 12511953 | 12421086 | 14496589 |
| 3 | 12297598 | 12597534 | 14323872 |
| 4 | 12528729 | 12287895 | 14431702 |
| 5 | 12608085 | 12426326 | 14297298 |
| 6 | 12418327 | 12547892 | 14210867 |
| Mean | 12484327 | 12434907.67 | 14328711 |
| SD | 110015.45 | 120305.85 | 116038.1 |
| % RSD | 0.88 | 0.96 | 0.80 |
Note: Concentration level used was 200 ppm, % RSD: Percentage Relative Standard Deviation, (n=6)
Table 3: Precision Studies
| Factor | Mean Retention time | Mean Tailing factor | Mean Peak area |
|---|---|---|---|
| (RSD≤2.0) | (RSD≤2.0) | (RSD≤2.0) | |
| Flow rate: 0.9 ml/min | 0.89 | 0.79 | 0.92 |
| Flow rate: 1.1 ml/min | 1.23 | 0.47 | 0.31 |
| Buffer:ACN (63:37) | 1.57 | 0.85 | 0.98 |
| Buffer:ACN (67:33) | 1.48 | 1.58 | 0.71 |
| At pH 2.9 | 1.23 | 0.79 | 1.56 |
| At pH 3.1 | 1.12 | 1.05 | 1.56 |
| Note: Three factors like flow rate, buffer proportion and pH were altered, % RSD: Percentage Relative Standard Deviation (n=6) | |||
Note: Three factors like flow rate, buffer proportion and pH were altered, % RSD: Percentage Relative Standard Deviation (n=6)
Table 4: Results of Robustness Study Of Ifetroban by Hplc
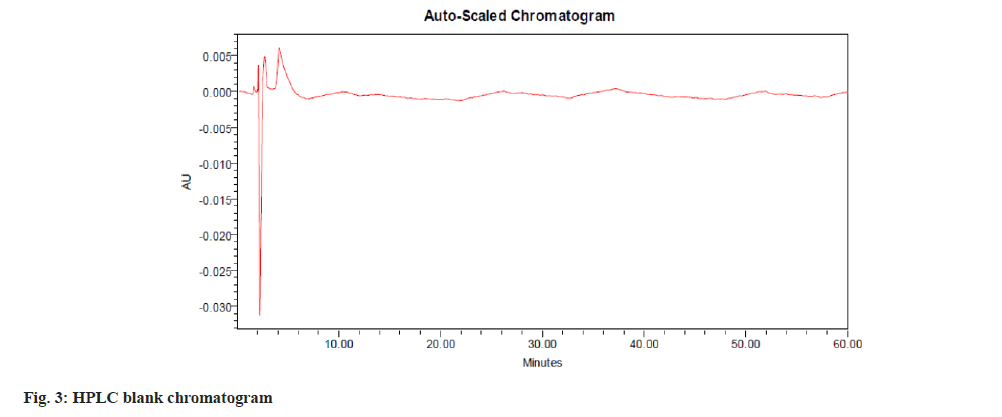
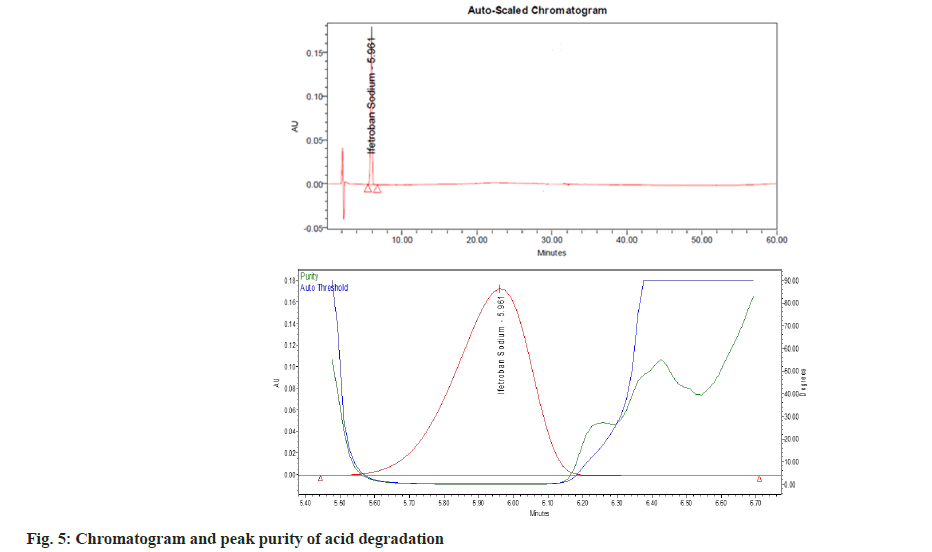
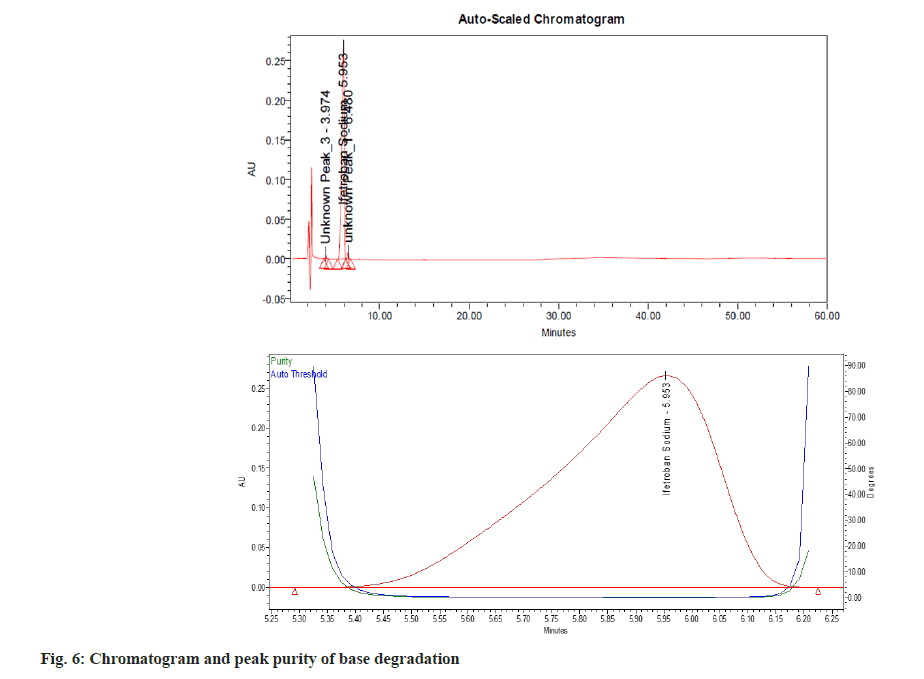
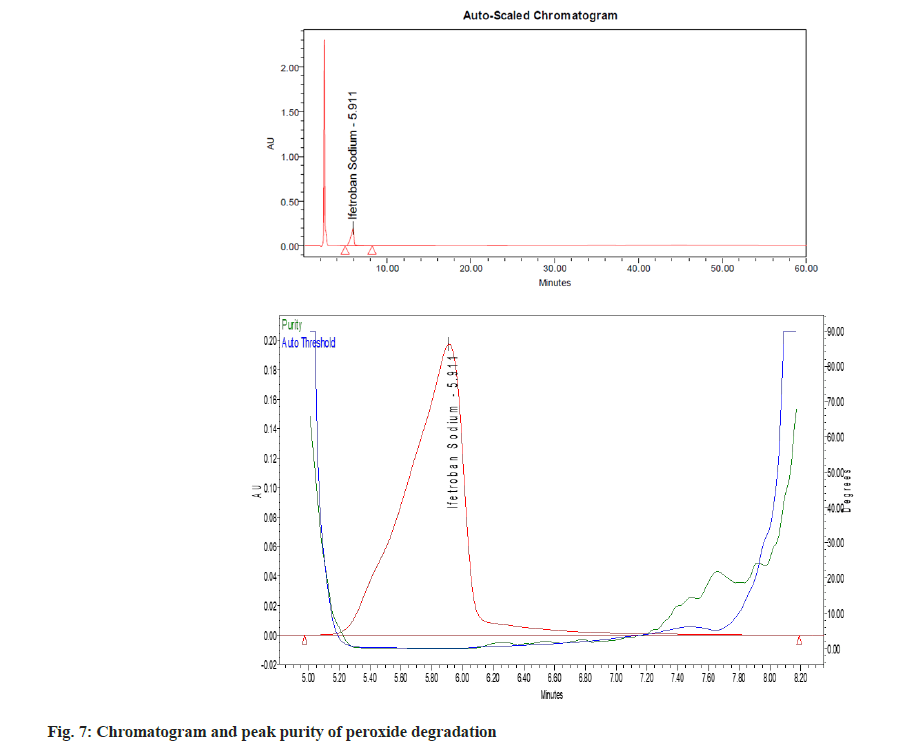
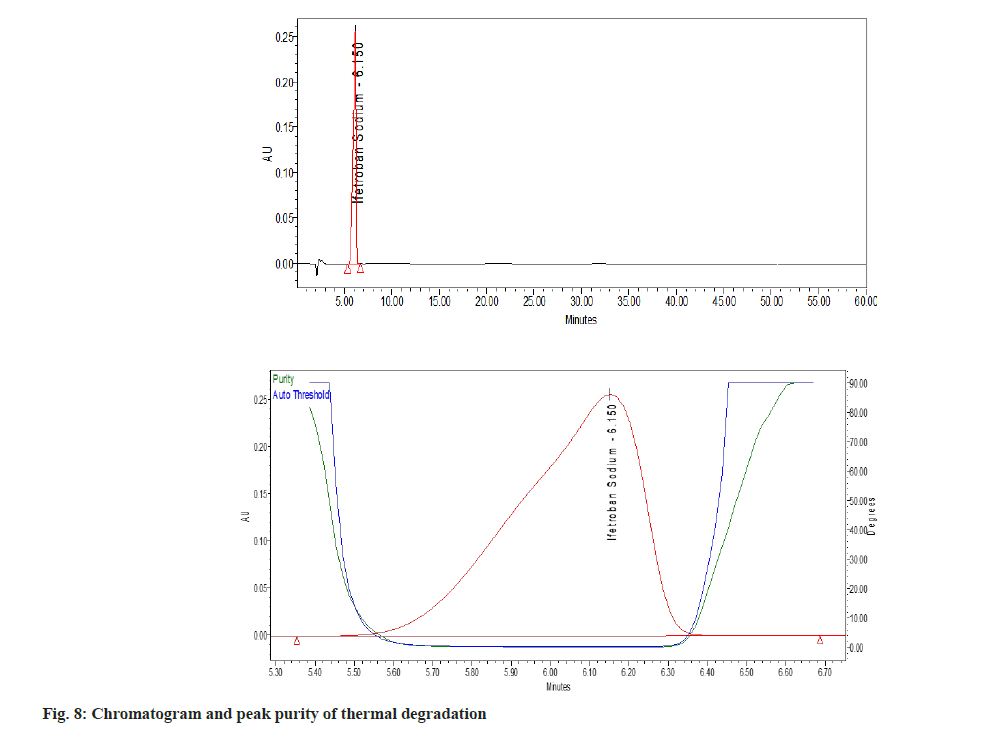
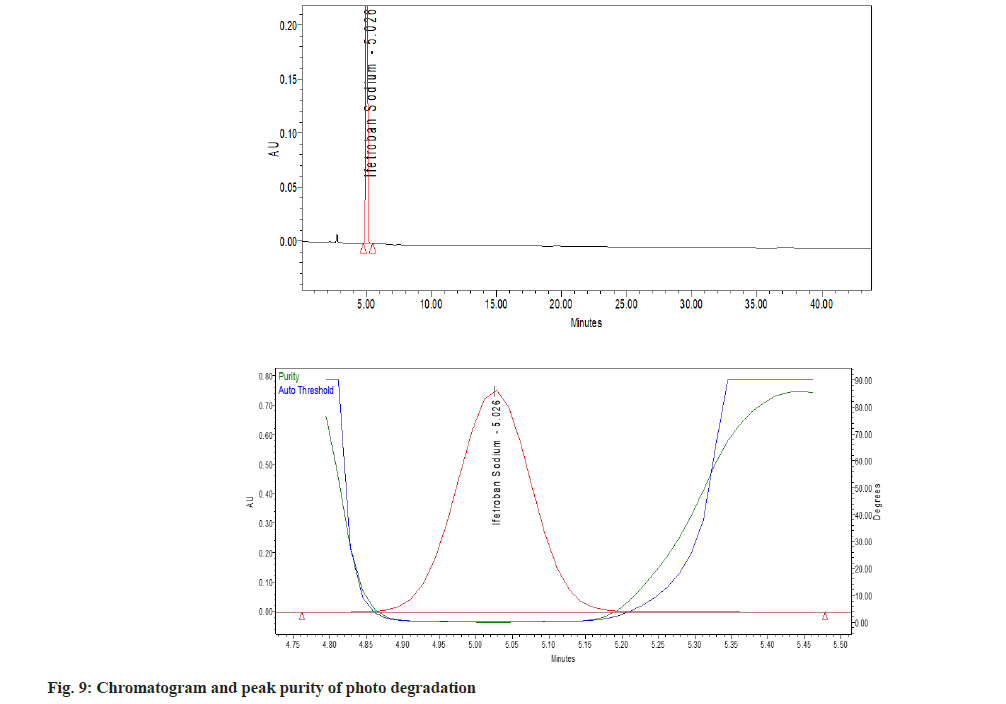
Upon comparison of the blank, placebo and standard, no significant interference was observed at the retention time of Ifetroban. Forced degradation studies of the drug were performed under different stress conditions as mentioned in ICH guidelines Q1A (R2)[6]. The sample solution containing Ifetroban was subjected to acidic, alkaline, oxidative, thermal degradation and photolytic degradation conditions. Acidic and alkaline degradation were performed at 80° temperature. In alkali degradation two unknown peaks at a retention time of 3.9 and 6.4 min were detected for which the United States Pharmacopeia resolution was 5.2. Even with 1 N sodium hydroxide the degradation was not more than 10 % from the mass balance studies. In UV degradation studies an unknown peak was detected, for which the resolution was 2.1. The purity threshold was 0.278 and the purity angle was 0.070 for the main peak in UV studies, which clearly indicates the peak is pure. The degraded samples were analyzed along with the control samples (lacking degradation treatment) and examined for any interferences of the peak of interest in the control or degraded sample from the potential degradation products[9].
The percent degradation of the main (active) peak was calculated after the completion of the analysis and is shown in Table 5. The main peak was pure (fig. 3), i.e., no other peak merged with the main peak. There are no valleys or shoulders on the peak as shown in fig. 4- fig. 9. This depicts that the main peak in all the stress degradation studies was pure. The presence of more than one compound in the chromatographic peak can be detected by peak purity. Peak purity analysis confirmed that all the components and any unexpected co-eluting degradation products have been chromatographically separated. The purity threshold was greater than the purity angle in all the stress samples as shown in Table 5.
| Degradation method | Optimize condition | % degradation of Ifetroban | Purity angle | Purity threshold |
|---|---|---|---|---|
| Acid | 1 ml 0.1N HCl for 30 min at 80º | 1.56 | 0.07 | 0.296 |
| Alkali | 1 ml 0.1 N NaOH for 30 min at 80º | 3.28 | 0.113 | 0.592 |
| Peroxide | 1 ml 10 % H2O2 for 30 min at 80º | 0.28 | 0.185 | 2.181 |
| Thermal | 1 h at 80º | 4.61 | 0.059 | 0.261 |
| UV | 2 h exposed to UV | 2.94 | 0.07 | 0.278 |
Note: Purity threshold was greater than the purity angle indicating peak is pure
Table 5: Result of Forced Degradation Study
This work was an illustrative example of stabilityindicating HPLC method development and the method was validated in accordance with ICH guidelines. The method was successfully used for the quantification of Ifetroban in pharmaceutical formulation and the assay results with the proposed method were 100.36±0.33 %. In this study, all possible forced degradation studies were performed on Ifetroban and all degradants were well resolved from the main peak in a single isocratic run. Also, the validation studies indicated that the method can be transferable to multiple labs and hence useful for pharmaceutical QC analysis. Further, the developed method can be used for the assay of Ifetroban during different phases of drug manufacturing.
A stability-indicating method was developed to explore the degradation behavior of Ifetroban. Sensitive and reliable liquid chromatography coupled with photodiode array detector method for the determination of Ifetroban and its degradation products was developed. The method developed was able to separate degradants peak (from hydrolytic reactions, oxidative, thermal and photolytic reactions) from the main peak. This method can be applied for the stability studies of Ifetroban.
Conflicts of interest:
The authors declared that there are no conflicts of interest.
References
- Rosenfeld L, Grover GJ, Stier Jr CT. Ifetroban sodium: An effective TxA2/PGH2 receptor antagonist. Cardiovasc Drug Rev 2001;19(2):97-115.
[Crossref] [Google Scholar] [PubMed]
- Khan S, Teitz DS, Jemal M. Kinetic Analysis by HPLC− electrospray mass spectrometry of the pH-dependent acyl migration and solvolysis as the decomposition pathways of ifetroban 1-O-acyl glucuronide. Anal Chem 1998;70(8):1622-8.
[Crossref] [Google Scholar] [PubMed]
- Jemal M, Patel A, Teitz DS. Direct injection for high sample throughput capillary gas chromatographic-mass spectrometric bioanalysis. J Chromatogr B Biomed Appl 1995;666(2):251-7.
[Crossref] [Google Scholar] [PubMed]
- Xia YQ, Jemal M. High-field asymmetric waveform ion mobility spectrometry for determining the location of in-source collision-induced dissociation in electrospray ionization mass spectrometry. Anal Chem 2009;81(18):7839-43.
[Crossref] [Google Scholar] [PubMed]
- Guideline IH. Validation of analytical procedures: Text and methodology. Q2 (R1). 2005;1(20):5.
- Stability testing of new drug substances and Products. (Q1A 2) International Conference on Harmonization, Geneva, Switzerland. 2003.
- Snyder LR, Kirkland JJ, Glajch JL. Practical HPLC method development. John Wiley and Sons; 2012.
- Reynolds DW, Facchine KL, Mullaney JF, Alsante KM, Hatajik TD, Motto MG. Available guidance and best practices for conducting forced degradation studies. Pharm Tech 2002; 26(2):48-56.
- Mulgund SV, Phoujdar MS, Londhe SV, Mallade PS, Kulkarni TS, Deshpande AS, et al. Stability indicating HPLC method for simultaneous determination of mephenesin and diclofenac diethylamine. Indian J Pharm Sci 2009;71(1):35-40.
[Crossref] [Google Scholar] [PubMed]
