- *Corresponding Author:
- B. Veluchamy
Department of Botany, Arignar Anna Government Arts College, Namakkal 637002, Tamil Nadu, India
E-mail: palanivbalu@gmail.com
| Date of Received | 19 June 2021 |
| Date of Revision | 30 August 2022 |
| Date of Acceptance | 20 March 2023 |
| Indian J Pharm Sci 2023;85(2):344-354 |
This is an open access article distributed under the terms of the Creative Commons Attribution-NonCommercial-ShareAlike 3.0 License, which allows others to remix, tweak, and build upon the work non-commercially, as long as the author is credited and the new creations are licensed under the identical terms
Abstract
Actinomycetes were isolated from the sediment samples collected from Pichavaram Mangrove forest in Thandavarayan Sholagan Pet, Chidambaram Taluk, Cuddalore district, Tamilnadu, South India. The actinomycetes were screened for antibacterial (bioactive metabolite) production against Gram positive and Gram negative bacterial organisms. Molecular characterization was performed through 16S rRNA gene amplification to identify the actinomycetes. Standardization of media was done by designing the media at various pH, incubation temperature and sodium chloride concentration and incubation time. It is concluded that four actinomycetes were able to synthesis bioactive metabolite and two actinomycetes (PMA2 and PMA6) were characterized at molecular level as Streptomyces species. They grow better at pH 7.0 and the optimum temperature was found to be 34-37°. PMA2 tolerates up to 5 % sodium chloride concentration, whereas PMA6 tolerates up to 7.5 %. Minimum 7 d of incubation time is necessary for the growth of actinomycetes and concurrently, the antibacterials were peaked from 8th d.
Keywords
Streptomyces, sodium chloride concentration, pH, temperature, incubation time, bioactive metabolite
Now-a-days bacterial infections have been considerably increased causing several lethal diseases and epidemics. The bacterial diseases include tuberculosis, plague, typhus, typhoid fever, diphtheria, pneumonia, dysentery and cholera. Inappropriate and repetitive utilization of antibiotics is the major cause for the bacterial resistance. Bacteria turn out to be resistant to synthetic drugs by devastation or inactivation of the drug, prevention of the penetration of the drug in to the target site inside the microbe and modification of drug target sites[1]. The pattern of powerful advanced drugs received great significance in recent years because of the progressive development of drug resistant bacteria and fungi. They cause several diseases to humans and plants might lead to lesser availability of food products and diminishment of economy. So, it becomes crucial to produce effective and strong drugs for the eradication of pathogens[2]. The antibiotic discovery led to a breakthrough in medical field to effectively control the infection causing microbes. The evolution of pathogenic resistance towards antibiotics kept many lives at risk by dropping the success rate of modern medicine. It is determined that resistance to antibiotics lead to increased mortality rate and the treatment cost[3]. The natural products have minimal amount of side effects than the synthetic products. Hence, the demand for the natural product is increasing and may lead to over exploitation of natural resources. The search is going on for the novel products to be used as antioxidant, antiseptic, anti-inflammatory, emollient, anti keratolytic, antiseborrheic activity and antibacterial[4]. Traditionally, several microbes and plants are utilized to exhibit several biological functions include hypotensive, antidiabetic and antibacterial activities[5]. The earth plane has 70 % of marine environment and the ocean is rich in unexplored potential sources for countless drugs and secondary metabolites[6]. The ocean is believed to be highest resource of powerful compounds and symbolize a considerable number of microbes which are producing the drugs[7]. Numerous actinomycetes are scattered in the aquatic environments like oceans, rivers and seas. They reside in sponges, marine sediments, sea sands and water[8]. The actinomycetes are imperative group of microbes taking part as the natural antibiotic producers. They are renowned for their broad range of biological activities such as antiviral, antibacterial, antiparasitic, antifungal, antitumor, immunosuppressive, immunostimulatory, enzyme inhibitory and herbicidal properties[9]. Marine actinomycetes encompass the ability to produce a mixture of secondary metabolites even at excessive salinity, stress and high temperature[6].
Mangrove ecosystem is the principal manufacturer of biological diversity and microorganisms are renowned to be wealthy sources of bioactive compounds. Mangrove actinobacteria are the promising sources for biologically active compounds as the ecological network of mangrove is completely diverse from the terrestrial environment. They produce an array of antibiotic, anticancer compounds and enzyme inhibitors. Mangrove actinobacteria are proficient to produce a set of enzymes which are highly stable even at higher temperature and alkaline environment[10]. An universal guideline used for the investigation of the moral and ethical value on the effects of operational parameters of a process by changing the value of only one factor at each time and recording the influence of that value on the final response[11]. The aim of the study includes improving the capability of bioactive metabolite synthesis by Streptomyces species by several physio-chemical parameters like pH, Temperature, Incubation time and sodium chloride concentration.
Materials and Methods
Sample collection:
The sediment samples were collected from the Pichavaram Mangrove forest in Thandavarayan Sholagan Pet, Chidambaram Taluk, Cuddalore district, Tamilnadu, South India. The geological position is 11.41° N latitude, 79.79° E longitude and at an altitude of above+5.25 M MSL[12].
Screening for bioactive metabolite production:
The samples were inoculated in to Starch Casein Agar medium incorporated with cycloheximide (25 μg/ml) and nalidixic acid (25 μg/ml). The dishes were incubated for 7 d at 30°. The actinomycetes were tested against Gram-positive and Gramnegative bacteria for the screening of antibacterial (bioactive metabolite) synthesis. The bacterial organisms used in this study were Microbial Type Culture Collection (MTCC) and Gene bank cultures, they include Bacillus subtilis (B. subtilis), Bacillus Megaterium (B. Megaterium), Bacillus cereus, Staphylococcus aureus, Staphylococcus epidermidis, Escherichia coli, Salmonella typhi (S. typhi), Salmonella typhimurium, Pseudomonas aeruginosa and Klebsiella pneumonia[12].
Molecular characterization:
The total genetic content was pulled out from the actinomycetes PMA2 and PMA6 and amplified by the 16S rRNA universal primers (785F and 907R). The amplified products were sequenced, compared the sequence with BLASTn tool and analyzed the phylogenetic tree through MEGA-X[13].
Standardization of media:
Effect of pH: The medium was standardized for the better growth of actinomycetes. The medium was prepared at different ranges of pH, temperature and different concentrations of Sodium Chloride. Different pH ranges like 6.0, 6.5, 7.0, 7.5 and 8.0 were set and adjusted the pH of the medium either by adding 0.1 N HCl or 0.1 N NaOH. A loopful of actinomycete broth was inoculated in the medium and incubated at 37°[14].
Effect of temperature: Nutrient media was prepared, adjusted the pH range in to 7.0 and inoculated with the actinomycetes. Different ranges of temperature were set like 30°, 32°, 34°, 37° and 40°. The cultures were incubated at different temperature ranges for 7 d[15].
Effect of salinity: Different salt concentrated (0 %, 1 %, 2.5 %, 5 %, 7.5 %, 10 %, 12.5 % and 15 %) medium were prepared, streaked with the actinomycetes and incubated to investigate the salt forbearance capability of the actinomycetes[15].
Effect of incubation time for the growth and bioactive metabolite production: The actinomycete PMA2 and PMA6 were inoculated in to nutrient broth and incubated up to 15 d. The growth was absorbed at 600 nm spectrophotometrically. Parallelly, st d, 4th d, 8th d and 12th d culture was extracted with 50 % ethylacetate. Finally, the antibacterial assay was performed against B. Megaterium (MTCC 2949) and S. typhi (MTCC 3216)[16,17]. The result was observed, it has produced the zone of inhibitions and the results have been recorded. All the experiments were repeated thrice.
Statistical analysis:
The test was performed in triplicates and one way Analysis of Variance (ANOVA) was accomplished to find out the standard deviation by R-open source software, result shows the p value as p<0.05 and it is considered statistically as the level of significance[15].
Results and Discussion
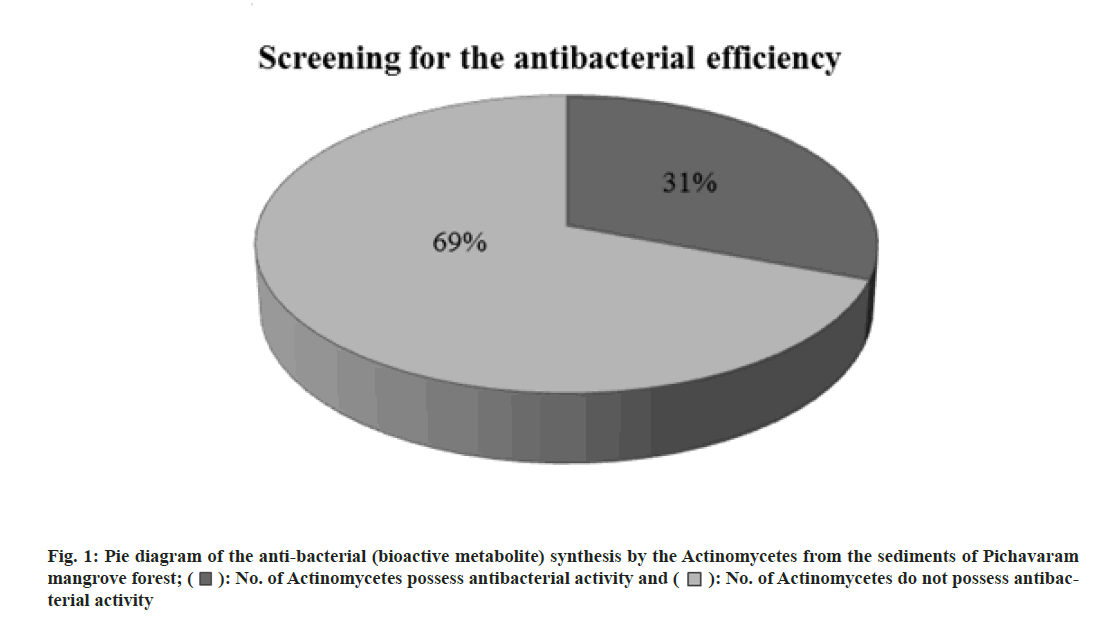
Totally 13 actinomycetes were isolated and tested for antibacterial (bioactive metabolite) production. Among 13 actinomycetes isolated, only four actinomycetes (31 %) were positive for antibacterial synthesis. The result of screening the antibacterial (bioactive metabolite) synthesis of actinomycetes against the bacterial organisms was shown in Table 1. Fig. 1 shows the pie diagram of the antibacterial (bioactive metabolite) synthesis by the actinomycetes from the sediments of Pichavaram mangrove forest.
| Actinomycetes | Bacterial Organisms | |||||||||
|---|---|---|---|---|---|---|---|---|---|---|
| Gram +ve organisms | Gram -ve organisms | |||||||||
| Bacillus subtilis | Bacillus Megaterium | Bacillus cereus | Staphylococcus aureus | Staphylococcus epidermidis | Escherichia coli | Pseudomonas aeruginosa | Salmonella typhi | Salmonella typhimurium | Klebsiella pneumonia | |
| PMA1 | - | - | - | - | - | - | - | - | - | - |
| PMA2 | + | ++ | + | + | + | + | + | + | + | - |
| PMA3 | - | - | - | - | - | - | - | - | - | - |
| PMA4 | - | - | - | - | - | - | - | - | - | - |
| PMA5 | - | - | - | - | - | - | - | - | - | - |
| PMA6 | - | ++ | - /+ | ++ | + | - | - | ++ | ++ | - |
| PMA7 | - | - | - | - | - | - | - | - | - | - |
| PMA8 | - | - | - | - | - | - | - | - | - | - |
| PMA9 | - | + | + | ++ | + | - | + | + | + | - |
| PMA10 | - | - | - | - | - | - | - | - | - | - |
| PMA11 | - | - | - | - | - | - | - | - | - | - |
| PMA12 | - | - | - | - | - | - | - | - | - | - |
| PMA13 | - | - | - | - | + | - | - | - | - | - |
Note: (++): Strong activity; (+): Mild activity and (-): Activity not detected
Table 1: Screening the Antibacterial (Bioactive Metabolite) Synthesis of Actinomycetes Against the Bacterial Organisms
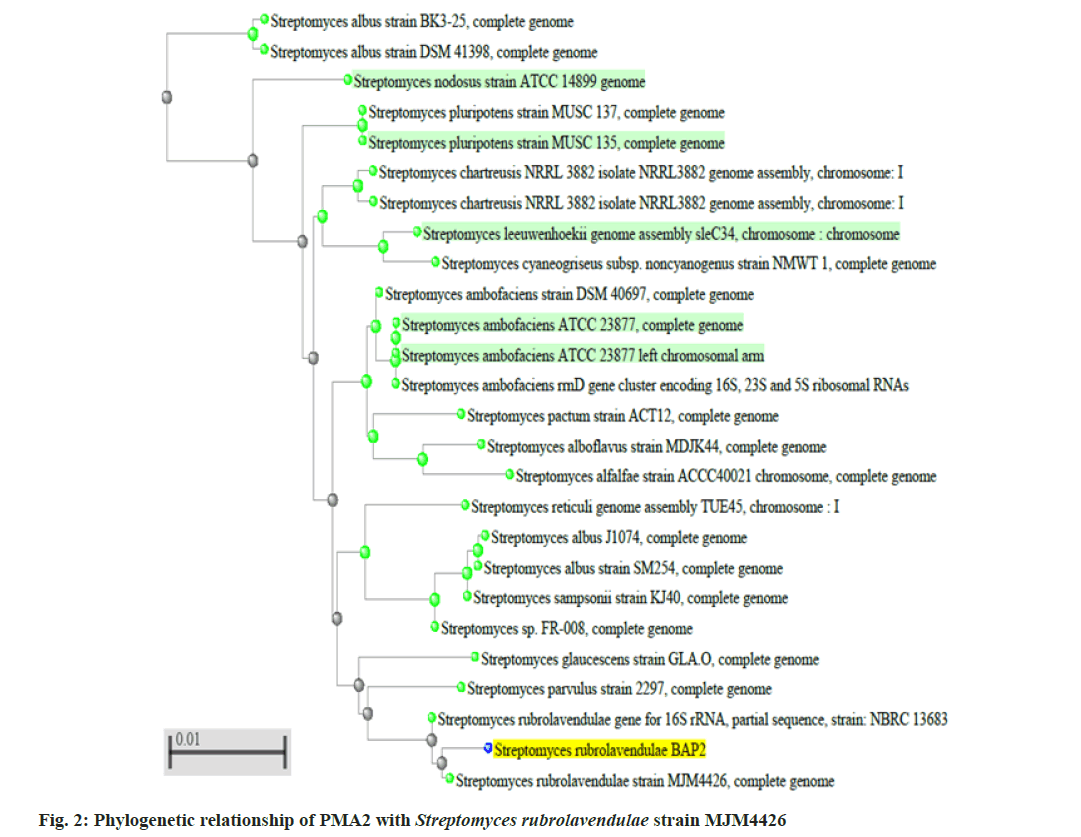
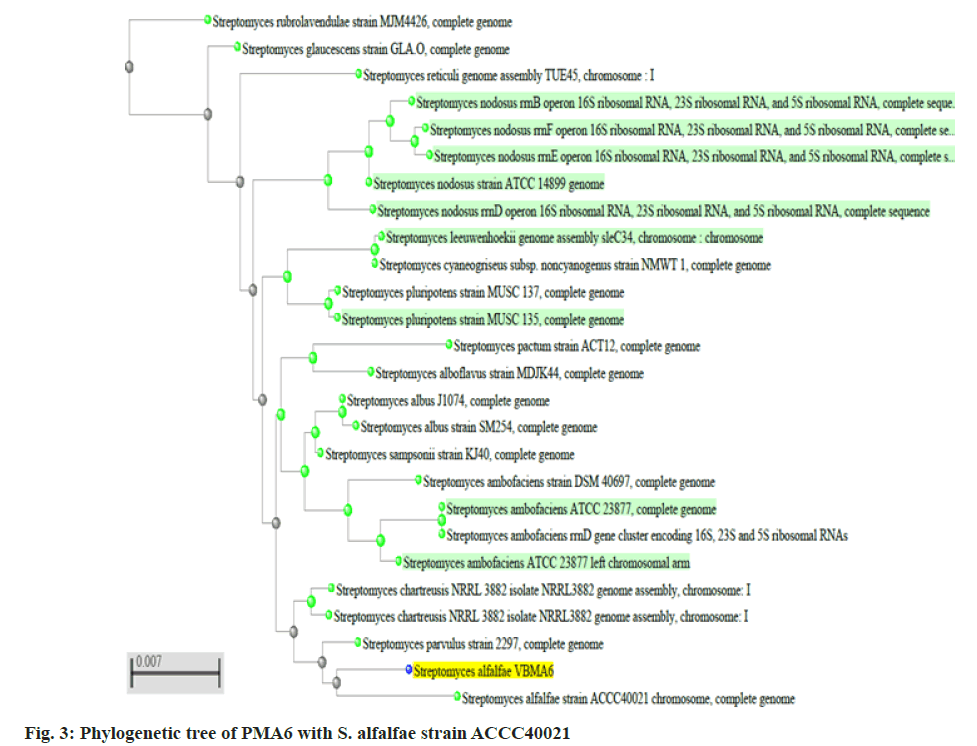
Two better bioactive metabolite synthesizing actinomycetes (PMA2 and PMA6) were selected, amplified the 16S rRNA genes and produced the fragment size around 1600 basepairs. The sequences were analyzed through BLASTn tool and phylogenetic tree construction. PMA2 has best sequence similarity with Streptomyces rubrolavendulae strain MJM4426 and PMA6 is highly similar with Streptomyces alfalfae (S. alfalfae) strain ACCC40021. Hence, the actinomycetes were identified and submitted the sequences as Streptomyces rubrolavendulae strain BAP2 and S. alfalfae VBMA6 and accession numbers were attained as MH183395 and MH183396 respectively. Fig. 2 shows the phylogenetic relationship of PMA2 with Streptomyces rubrolavendulae strain MJM4426 and fig. 3 shows phylogenetic tree of PMA6 with S. alfalfae strain ACCC40021.
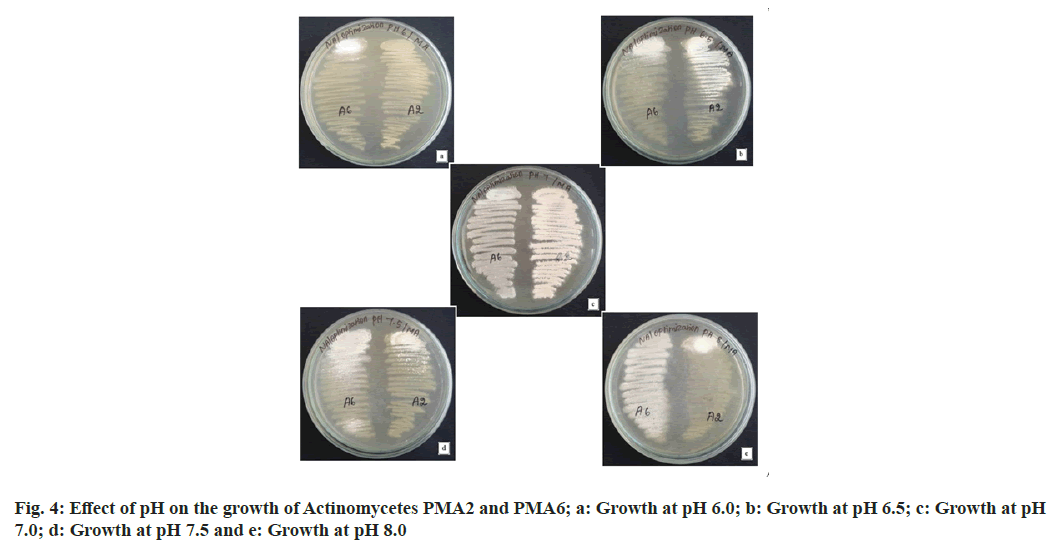
The actinomycetes PMA2 and PMA6 were grown in the medium with all pH ranges, but pH 6.0 shows minimal growth of PMA2, the growth increased in pH 6.5 and pH 7.0. Later, the growth diminishes in the pH 7.5 and 8.0. Better growth of the actinomycete PMA2 was observed in pH 7.0. PMA6 grown in pH 6.0 very minimally, the growth increased in the pH 6.5 and 7.0. The growth has been reduced in pH 7.5 and slightly increased in pH 8.0. PMA6 was grown well in pH 7.0. From this result, it has been concluded that pH 7.0 is the optimum pH for the growth the actinomycetes PMA2 and PMA6. Fig. 4 shows the images of effect of pH for the better growth of actinomycetes and Table 2 displays the result of effect of pH for the better growth of actinomycetes.
| S No | Actinomycete | pH 6.0 | pH 6.5 | pH 7.0 | pH 7.5 | pH 8.0 |
|---|---|---|---|---|---|---|
| 1 | PMA2 | + | + | +++ | + | + |
| 2 | PMA6 | + | + | +++ | + | ++ |
Note: +: Low growth; ++: moderate growth and +++: better growth
Table 2: Effect of Ph on the Growth of Actinomycetes Pma2 and Pma6
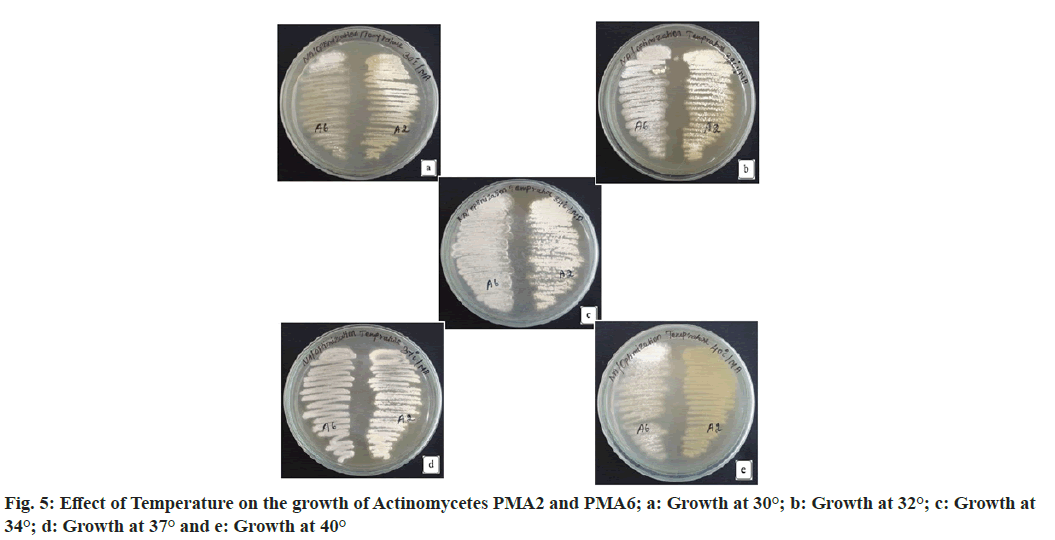
Both PMA2 and PMA6 were grown in the medium with different temperature ranges. Decreased rate of growth was observed for both the actinomycetes PMA2 and PMA6 at temperature 30°. PMA2 and PMA6 grown moderately at 32° and better growth were recorded at 34° and 37° for both the actinomycetes. At 40°, the growth reduced greatly for PMA2 and moderate growth was recorded for PMA6. Since, the best growth was observed at 34° and 37°, this temperature range is found optimum for the growth the actinomycetes PMA2 and PMA6. Fig. 5 shows the effect of Temperature on the growth of the actinomycetes PMA2 and PMA6. The result has been displayed in Table 3.
| S No | Actinomycete | 30° | 32° | 34° | 37° | 40° |
|---|---|---|---|---|---|---|
| 1. | PMA2 | + | ++ | +++ | +++ | + |
| 2. | PMA6 | + | ++ | +++ | +++ | ++ |
Note: +: Low growth; ++: moderate growth and +++: better growth
Table 3: Effect of Temperature on the Growth of Actinomycetes Pma2 and Pma6
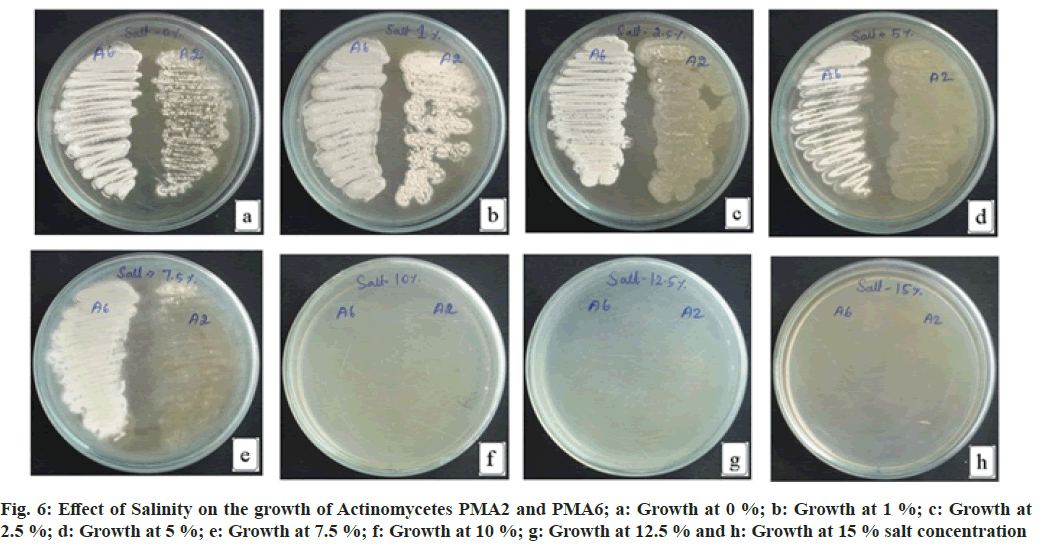
The actinomycete PMA2 shows increased growth at 1 % NaCl, moderate growth at 0 % NaCl, 2.5 % NaCl and 5.0 % NaCl concentrations. Decreased growth rate of PMA2 was recorded at 7.5 % NaCl concentration. The growth was not detected at 10 %, 12.5 % and 15 % NaCl concentrations. PMA6 grows well in 0 % NaCl, 1 % NaCl, 2.5 % NaCl, 5.0 % NaCl and up to 7.5 % NaCl concentrations. There were no growth occurred for PMA6 at 10 %, 12.5 % and 15 % NaCl concentrations. Both actinomycetes could tolerate the absence of salt, PMA2 tolerates up to 5 % salt concentration and PMA6 tolerates up to 7.5 % salt concentration. Fig. 6 illustrates the effect of salinity on the growth of actinomycetes. The result has been depicted in Table 4.
| S No | Actinomycete | 0 % | 1 % | 2.50 % | 5 % | 7.50 % | 10 % | 12.50 % | 15 % |
|---|---|---|---|---|---|---|---|---|---|
| 1 | PMA2 | ++ | +++ | ++ | ++ | + | - | - | - |
| 2 | PMA6 | +++ | +++ | +++ | +++ | +++ | - | - | - |
Note: +: Low growth; ++: moderate growth; +++: better growth and -: growth not detected
Table 4: Effect of Salinity on the Growth of Actinomycetes Pma2 and Pma6
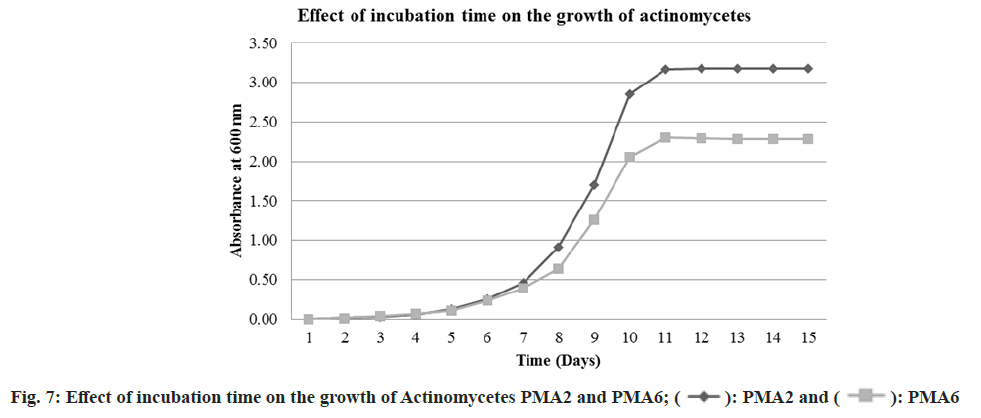
The actinomycete PMA2 and PMA6 were inoculated in to nutrient broth and incubated up to 15 d. The growth was absorbed at 600 nm spectrophotometrically. The growth phase started immediately after inoculation. But up to 6 d, there were no better growth for both the actinomycetes. It indicates that the first 6 d are considered to be lag phase for PMA2 and PMA6. After that, rapid growth occurred up to 11 d and it is the exponential phase for both the actinomycetes. After 11th d, PMA 2 and PMA6 enter in to stationary phase. Fig. 7 shows the graphical representation of the effect of incubation time on the growth of actinomycetes PMA2 and PMA6.
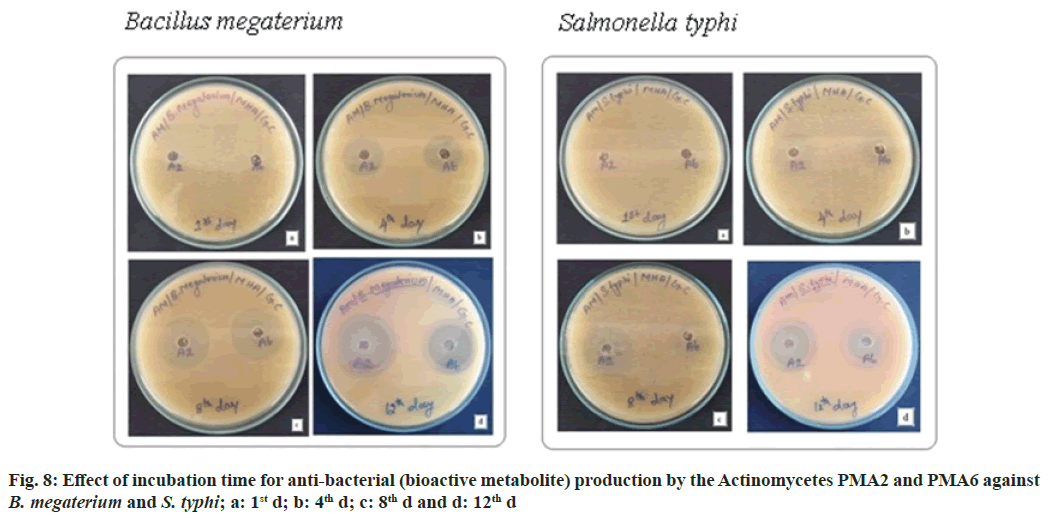
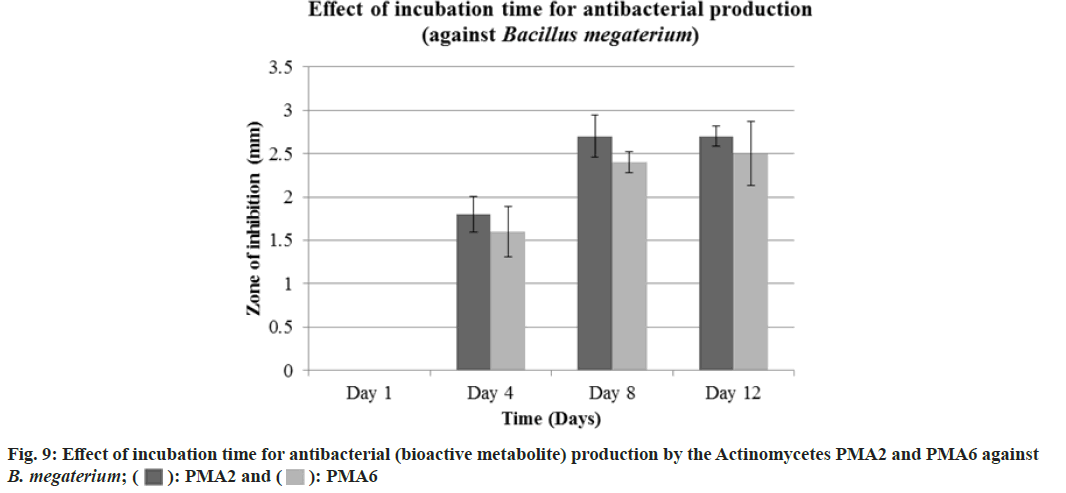
The actinomycete PMA2 and PMA6 were inoculated in to nutrient broth and incubated up to 15 d. 1st d, 4th d, 8th d and 12th d culture was extracted with 50 % ethylacetate. Finally, the antibacterial assay was performed against B. Megaterium (MTCC 2949) and S. typhi (MTCC 3216). Fig. 8 showed the effect of incubation time for antibacterial (bioactive metabolite) production by the actinomycetes PMA2 and PMA6 on B. Megaterium and S. typhi.On the 1st d, PMA2 and PMA6 were not producing the antibacterials (bioactive metabolite) and they started to produce them from the 4th d for both the cultures. Actinomycete PMA2 produced zone of inhibitions from d 4, the diamenter of the zones were measured as 1.8±0.21 mm, 2.7±0.24 mm and 2.7±0.12 mm and Actinomycete PMA6 produced 1.6±0.29 mm, 2.4±0.12 mm and 2.5±0.37 mm diameter of zone of inhibitions on 4th d, 8th d and 12th d respectively against B. Megaterium. Fig. 9 showed the graphical representation of effect of incubation time for antibacterial (bioactive metabolite) production by the actinomycetes PMA2 and PMA6 on B. Megaterium.
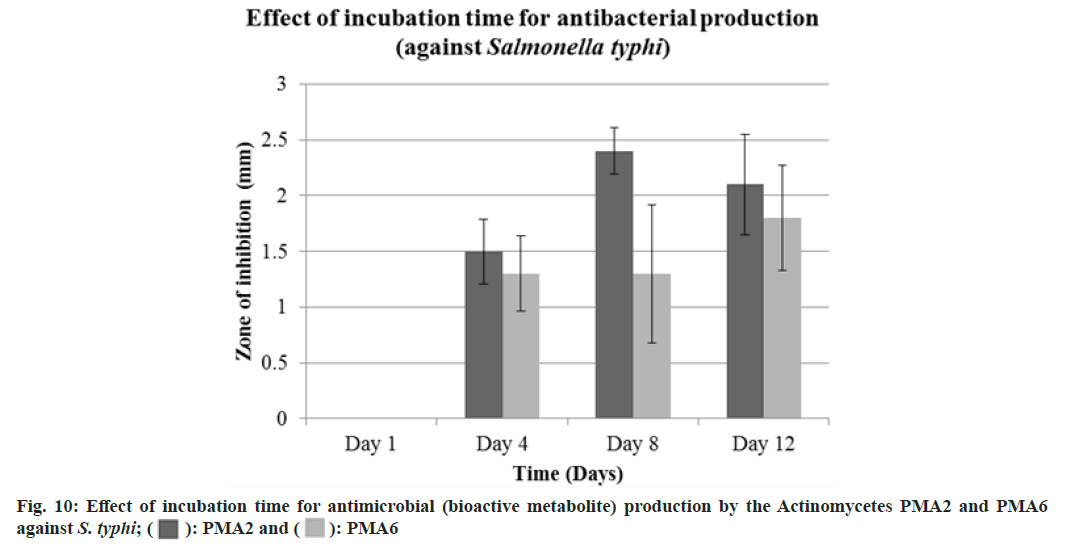
Diameter of the zone of inhibition was recorded against S. typhi, Actinomycete PMA2 produced 1.5±0.29 mm, 2.4±0.21 mm and 2.1±0.45 mm zone of inhibitions and PMA6 produced 1.3±0.34 mm, 1.3±0.62 mm and 1.8±0.47 mm zone of inhibitions on 4th d, 8th d and 12th d respectively. The production of antibacterials (bioactive metabolite) was at the peak on 8th d for both the actinomycetes PMA2 and PMA6. Fig. 10 showed the graphical representation of effect of incubation time for antibacterial (bioactive metabolite) production by the actinomycetes PMA2 and PMA6 against S. typhi.
The actinomycetes synthesis of bioactive metabolite was confirmed in screening method, among 13 actinomycetes isolated, only four actinomycetes were capable of producing bioactive metabolites against the tested bacterial organisms and the rest of the nine actinomycetes were incapable to synthesize them. Eight actinomycetes were isolated, amid them only one was not capable of exhibiting antibacterial property and other seven actinomycetes deserve that property[18]. Only 21 % of actinomycetes were synthesizing antibacterial compound out of 33 actinomycetes against fish pathogens[19]. Phylogenetic analysis revealed the organisms belong to Streptomyces rubrolavendulae and S. alfalfae. It is reported that the isolate NLKPB45 at molecular level and it was related closely with Streptomyces species[20]. It is valuable to discriminate the effect of physical and chemical factors on the growth and production of biologically active metabolite[17]. Nutrient media was prepared at different pH ranges like 6.0, 6.5, 7.0, 7.5 and 8.0 growth of both the actinomycetes PMA2 and PMA6 occurred in all pH ranges but peaked at pH 7.0. Hence, it is concluded that pH 7.0 is the optimum pH for the growth of actinomycetes. Concerning the forbearance of pH, there was higher rate of growth occurred for Streptomyces strains with pH 4.0, 7.0 and 8.0. Though, Saccharothrix strain only grew at pH 7.0 and 8.0[21].The optimum temperature for the growth of actinomycetes was experimentally proved to be 34°-37°. Starch Casein Broth was inoculated with Streptomyces bellus and incubated at various temperature ranges like 30°, 35°, 40° and 45° for the production of pigment. The optimum temperature was 40° for the growth and production. It was also recorded as pH 6-8 was optimum for the growth and production of pigment[22]. The stability of the antifungal proficient Streptomyces strain KX852460 against Rhizoctonia solani AG-3 strain KX852461 was examined for the control of target spot disease in tobacco plant leaf. At 60-90° the activity was observed better and pH 5.0-8.0 displayed highest activity. The temperature and pH ranges beyond these levels were not favourable for antifungal efficiency[23]. The actinomycete PMA2 tolerates sodium chloride concentration up to 5.0 %. But it grows well at 1 % concentration of sodium chloride. The actinomycete PMA6 tolerates and grows well up to 7.5 % of sodium chloride concentration. Streptomyces species named KDT32 was grown at the pH range of 6-12 and 0-7 % Sodium chloride concentration. Similarly, another Streptomyces species named KGT32 was able to grow at pH 5-12 and 0-9 % NaCl concentration. Both species were able to produce catalase enzyme and antimicrobial (antibacterial and antifungal) compounds[24]. Optimization of the media components of Streptomyces species AS11 was performed for the synthesis of bioactive secondary metabolites by diverse factors like sodium chloride concentration (2-6 %), pH (5.0-8.0) and temperature (20-50°). It is observed that, 4.5 % sodium chloride provided the better growth of Streptomyces species. It also recorded optimum pH and temperature in the range of 7.5 and 38° respectively for the better synthesis of bioactive compound[25].The actinomycetes PMA2 and PMA6 enter in to exponential phase at 7th d. Up to 6 d, they need of adaptation period. It has been concluded that the production of antibacterials was minimal on d 4 and peaked at 8th d for both the actinomycetes PMA2 and PMA6. The production of enzyme Penicillin acylase which involves in the biosynthesis of Amoxicillin antibiotic was analyzed in B. subtilis. Two isolates B. subtilis (B1 and B2) strains grown at pH ranges 7 and 8, no growth was found at pH 9 and 10. It was also confirmed that Penicillin acylase production was maximum at pH 7 and 48 h of incubation period. The optimum temperature for the production of penicillin acylase was found to be at 45°[26]. The growth and production of antimicrobial metabolites were tartaned at various ranges of pH (pH 6.5, 7.0, 7.5 and 8.0), Temperature (20, 25, 30 and 40°) and incubation periods (4, 5, 6, 7, 8, 9 and 10 d). The maximal growth and production of antimicrobial metabolite was observed from 7 d at neutral pH. 30° was considered to be the optimum temperature for the maximum production of antimicrobial metabolites[27].
Acknowledgements:
The authors are thankful to the Head, Department of Biotechnology, Principal and Management of K. S. Rangasamy College of Arts and Science (Autonomous), Tiruchengode for providing necessary laboratory facilities during the study period.
Conflict of interest:
The authors declared no conflict of interests.
References
- Joshi PC, Chejara DR, Mahajan DH. Facile synthesis and characterization of some new 5-ethylidene-thiazolidine-2, 4-diones and their antimicrobial evaluation. Indian J Pharm Sci 2020;82(5):871-80.
- Raju S, Ashok D, Vinuthna C. Comparative antimicrobial activity of phytofabricated Ag and Au nanoparticles from Ledebouria hydrabadensis rhizome using various methods. Indian J Pharm Sci 2020;82(5):851-60.
- Machado E, Gelinski J, Baratto CM, Borges EM, Vicente VA, Nascimento MM, et al. Technological potential of antimicrobial peptides: A systematic review. Indian J Pharm Sci 2019;81(5):807-14.
- Karan S, Turan C, Sangun MK, Eliuz EA. Bioactive compounds and antimicrobial activity of glasswort Salicornia europaea. Indian J Pharm Sci 2021;83(2):229-37.
- Abdou R, Alqahtani AM, Attia G. Bioactive metabolites of Aspergillus neoniger, an endophyte of the medicinal plant Ficus carica. Indian J Pharm Sci 2021;83(1):101-9.
- Rajivgandhi G, Vijayan R, Kannan M, Santhanakrishnan M, Manoharan N. Molecular characterization and antibacterial effect of endophytic actinomycetes Nocardiopsis sp. GRG1 (KT235640) from brown algae against MDR strains of uropathogens. Bioact Mater 2016;1(2):140-50.
[Crossref] [Google Scholar] [PubMed]
- Nisha P, John N, Mamatha C, Thomas M. Characterization of bioactive compound produced by microfouling actinobacteria (Micrococcus luteus) isolated from the ship hull in Arabian Sea, Cochin. Kerala. Mater Today Proc 2020;25:257-64.
- Abdelfattah MS, Elmallah MI, Hawas UW, Abou El-Kassema LT, Eid MA. Isolation and characterization of marine-derived actinomycetes with cytotoxic activity from the Red Sea coast. Asian Pacific J Tropic Biomed 2016;6(8):651-7.
- Pagmadulam B, Tserendulam D, Rentsenkhand T, Igarashi M, Sawa R, Nihei CI, et al. Isolation and characterization of antiprotozoal compound-producing Streptomyces species from Mongolian soils. Parasitol Int 2020;74:101961.
[Crossref] [Google Scholar] [PubMed]
- Arumugam T, Kumar PS, Kameshwar R, Prapanchana K. Screening of novel actinobacteria and characterization of the potential isolates from mangrove sediment of south coastal India. Microb Pathog 2017;107:225-33.
[Crossref] [Google Scholar] [PubMed]
- Sarfaraz M, Dhruv RK, Doddayya H, Khan KA. Factorial design based optimization of hydroxyzine hydrochloride fast dissolving tablets. Indian J Pharm Sci 2020;82(5):797-808.
- Aarthi M, Kamalanathan D, Balakrishnan V. Isolation of actinomycetes from the sediments of Pichavaram mangrove forest, South India and analysing their antibacterial efficacy. Asian J Pharm Clin Res 2020;13(4):120-5.
- Aarthi M, Velmurugan T, Prasannarajeshkumar M, Balakrishnan V. Molecular Identification of Actinomycetes with Effectual Antibacterials from the Sediments of Pichavaram Mangrove Forest, South India, by Sequencing the High G+C Content Genomic DNA. Indian J Nat Sci 2020;10(61):125-32.
- Oskay M. Antifungal and antibacterial compounds from Streptomyces strains. African J Biotechnol 2009;8(13):17.
- Semwal P, Rawat V, Sharma P, Baunthiyal M. Actinobacteria from cow feces: Isolation, identification and screening for industrially important secondary metabolites. Microbiol Biotechnol Lett 2018;46(1):68-76.
- Balachandran C, Duraipandiyan V, Arun Y, Sangeetha B, Emi N, Al-Dhabi NA, et al. Isolation and characterization of 2-hydroxy-9, 10-anthraquinone from Streptomyces olivochromogenes (ERINLG-261) with antimicrobial and antiproliferative properties. Brazilian J Pharmacogn 2016;26(3):285-95.
- Anuhya G, Jyostna V, Aswani KY, Bodaiah B, Sudhakar P. Influence of physico-chemical parameters on secondary metabolite production by marine fungi. Int J Curr Pharm Res 2017;9(5):112-8.
- Benhadj M, Gacemi-Kirane D, Menasria T, Guebla K, Ahmane Z. Screening of rare actinomycetes isolated from natural wetland ecosystem (Fetzara Lake, northeastern Algeria) for hydrolytic enzymes and antimicrobial activities. J King Saud Univ Sci 2019;31(4):706-12.
- Thirumurugan D, Vijayakumar R, Vadivalagan C, Karthika P, Khan MK. Isolation, structure elucidation and antibacterial activity of methyl-4, 8-dimethylundecanate from the marine actinobacterium Streptomyces albogriseolus ECR64. Microb Pathog 2018;121:166-72.
[Crossref] [Google Scholar] [PubMed]
- Kalyani BS, Krishna PS, Sreenivasulu K. Screening and identification of novel isolate Streptomyces sp., NLKPB45 from Nellore costal region for its biomedical applications. Saudi J Biol Sci 2019;26(7):1655-60.
[Crossref] [Google Scholar] [PubMed]
- Lima JV, Martins SC, Siqueira KA, Soares MA, Martins CM. Characterization of actinobacteria from the semiarid region, and their antagonistic effect on strains of rhizobia. Afr J Biotechnol 2017;16(11):499-507.
- Srinivasan M, Keziah SM, Hemalatha M, Devi CS. Pigment from Streptomyces bellus MSA1 isolated from marine sediments. In IOP Conference Series: Materials Science and Engineering 2017;263(2):1-11.
- Ahsan T, Chen J, Zhao X, Irfan M, Wu Y. Extraction and identification of bioactive compounds (eicosane and dibutyl phthalate) produced by Streptomyces strain KX852460 for the biological control of Rhizoctonia solani AG-3 strain KX852461 to control target spot disease in tobacco leaf. AMB Expr 2017;7(54):1-9.
- Bizuye A, Gedamu L, Bii C, Gatebe E, Maina N. Molecular-based identification of Actinomycetes species that synthesize antibacterial silver nanoparticles. Int J Microbiol 2020;2020:1-7.
- Al-Ansari M, Kalaiyarasi M, Almalki MA, Vijayaraghavan P. Optimization of medium components for the production of antimicrobial and anticancer secondary metabolites from Streptomyces sp. AS11 isolated from the marine environment. J King Saud Univ Sci 2020;32(3):1993-8.
- Shaikh ANK, Mankale KK, Dixit PP. Production of penicillin acylase by Bacillus subtilis. Int J Pharm Biol Sci 2018;8(1):70-4.
- Khattab AI, Babiker EH, Saeed HA. Streptomyces: Isolation, optimization of culture conditions and extraction of secondary metabolites. Int Curr Pharm J 2016;5(3):27-32.
 ): No. of Actinomycetes possess antibacterial activity and (
 ): No. of Actinomycetes do not possess antibacterial
activity
 ): PMA2 and (
 ): PMA6